Transcription
1Q-2017 Consolidated Results Conference CallFULL IFRSMay 26th, 2017The IR Recognition granted by the Colombian Securities Exchange (Bolsa de Valores de Colombia S.A) is not a certification of the registered securities or the solvency of the issuer.
DisclaimerBanco de Bogotá is an issuer of securities in Colombia. As a financial institution, the Bank, as well as its financial subsidiaries, is subject toinspection and surveillance from the Superintendency of Finance of Colombia.As an issuer of securities in Colombia, Banco de Bogotá is required to comply with periodic reporting requirements and corporategovernance practices. In 2009 the Colombian Congress enacted Law 1314 establishing the implementation of IFRS in Colombia. As a result,since January 1, 2015, financial entities and Colombian issuers of publicly traded securities, such as Banco de Bogotá, must preparefinancial statements under IFRS, with some exceptions established by applicable regulation.IFRS as applicable under Colombian regulations differs in certain aspects from IFRS as currently issued by the IASB. This report was preparedwith unaudited consolidated financial information, which is in accordance with IFRS as currently issued by the IASB.At June 30th 2016, Banco de Bogotá deconsolidated Corficolombiana (ceded control of Corficolombiana to Grupo Aval). The Bank nowholds its 38.3% stake of Corficolombiana as an equity investment. As a result, 4Q2016 figures do not consolidate Corficolombiana.Additionally, Banco de Bogotá, as approved by its Board of Directors, signed in December 22nd 2016, a Shareholders’ Agreement betweenCorficolombiana, Banco de Bogotá, Banco de Occidente and Banco Popular which resulted in Corficolombiana becoming the directcontroller of Casa de Bolsa S.A; the Bank now holds its 22.8% stake of Casa de Bolsa as an equity investment. Moreover, unless otherwisenoted, for comparative purposes figures for 1Q2016 have been adjusted excluding Corficolombiana and Casa de Bolsa.The Colombian peso/dollar end-of-period annual and quarterly revaluation as of March 31, 2017 was 3.8%. In this report, calculations ofgrowth, excluding the exchange rate movement of the Colombian Peso, use the exchange rate as of March 31, 2017 (COP 2,885.57).This report may include forward-looking statements and actual results may vary from those stated herein as a consequence of changes ingeneral, economic and business conditions, changes in interest and currency rates and other risks factors. Recipients of this document areresponsible for the assessment and use of the information provided herein. Banco de Bogotá will not have any obligation to update theinformation herein and shall not be responsible for any decision taken by investors in connection with this document. The content of thisdocument is not intended to provide full disclosure on Banco de Bogotá or its subsidiaries.In this document we refer to trillions as millions of millions and to billions as thousands of millions.Details of the calculations of Non GAAP measures such as ROAA and ROAE, among others, are explained when required in this report.2
2017 First Quarter Performance HighlightsAttributable Net Income for the period was 616.8 billion pesos before the wealth tax which represented a19.8% increase versus 1Q16. Including the wealth tax the attributable net income was 558.4 billion.CommentaryKey Metrics ROAA: 1.9% / ROAE: 15.3%(1)Profitability Net Interest Margin: 6.0% Fee Income Ratio: 34.9% Efficiency Ratio: 47.6%(2) Gross Loans: 96.3Balance Sheet Total Deposits: 95.8 Deposits / Net Loans: 1.02x Deposits % Funding: 78.6% 90 Days PDL Ratio(3): 1.7% Net Cost of Risk: 2.0%Credit & Capital Tier 1 Ratio: 9.2% Total Solvency: 13.9% ROAA increased 20bps. ROAE decreased 20bps NIM increased 20bps from 1Q16, commensuratewith Central Bank rate hikes. Fee income increased 3.0% primarily due topension fees; excluding FX, growth was 8.7% Efficiency shows an improvement from 48.2% . Gross Loans increased 6.5%; excluding FX, growthwas 8.3%. Total Deposits grew 7.5%; excluding FX, growthwas 9.2%. Deposits / Net Loans illustrates an improvementfrom the last quarter of 2016. 90 Days PDL Ratio slightly increased from 1.6%. Net Cost of Risk, excluding extraordinaries,decreased 10bps from 2.1%. Total Solvency remained stable from 4Q16. Tier 1and Total Solvency ratios are both well aboveregulatory minimums.(1) Including wealth tax ROAA and ROAE were 1.7% and 13.9% respectively.(2) Efficiency ratio is excluding one time expenses (personnel severance, amortization and other administrative expenses)(3) 90 days PDL Ratio is excluding extraordinary past due from Electricaribe. Including this extraordinary the 90 days PDL ratio was 2.0%Note: Changes / growths refer to 1Q2017 over 1Q2016, unless otherwise stated.3
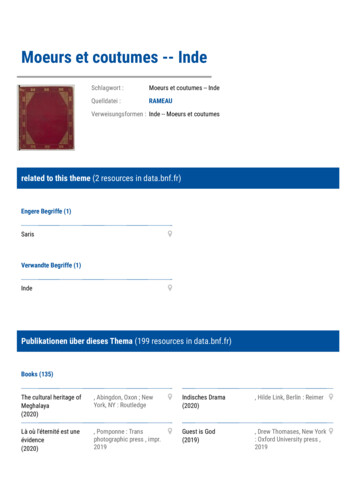
Macroeconomic Context - Colombia (1/3)Quarterly GDP (YoY %)20144.6%8%20153.1%20162.0%Annual GDP growth by sector (YoY %)2017e2.0% - 3%Industry20162.0%1.1%17-Q12%0%-2%Dec-00Dec-04QoQ %Dec-08Dec-12YoY 693495.5%2.8%0.9%4.4%4.9%2.2%Social services3.6%Unemployment (1)Average Price per Barrel US 2014201520161002.9%-1.4%ConstructionPrice Barrel of WTI Oil (US /barrel)1204.3%-0.6%Electricity, gas and waterFinancial services7.7%-0.1%-9.4%Oil and Mining4%10%Unemployment as of December for each period43Unemployment as of March for each 8.4%8.7%8.6%2013201420158.7%40WTI oil (USD/barrel)20201420152016Source: DANE, Bloomberg. Estimates Economic Research Banco de Bogotá.201720112012(1) Total national unemployment.201620174
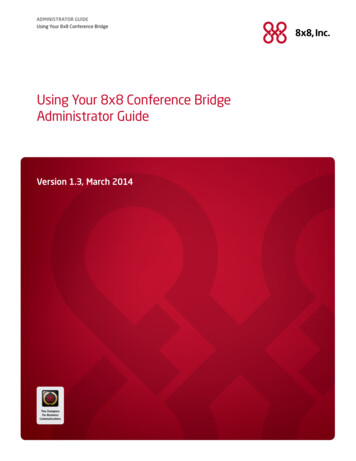
Macroeconomic Context - Colombia (2/3)Core and total inflation (YoY %)Market-based inflation expectations – BEI** (%)10%5%Headline inflation(1)Core inflation pr-14Apr-15Apr-16Apr-17BEI 2YBEI 5YInflation target0%Mar-10 Mar-11 Mar-12 Mar-13 Mar-14 Mar-15 Mar-16 Mar-17Exchange Rate (COP/USD)Central bank interest rate vs. DTF rate* (%)8%7%BEI 3Y3,500Central Bank Rate2014 2015 20162017e4.50% 5.75% 7.50% 5.75% - 20174%3%Centralbank rateTasa Q164Q161Q171Q17 /1Q16 1Q17 /4Q16Average3,263.493,016.072,924.2610.39%3.04%End of period3,000.633,000.712,885.573.83%3.84%Positive change COP appreciationNegative change COP devaluationSource: DANE, Banco de la República (BR). Estimates Economic Research Banco de Bogotá.(1) Average of four measures preferred by BR: 1) without foodstuff; 2) without foodstuff and regulated; 3) without foodstuff, public services and gasoline; and 4) core 20. * Monthly average. **Monthly average with information up to May-03-17.5
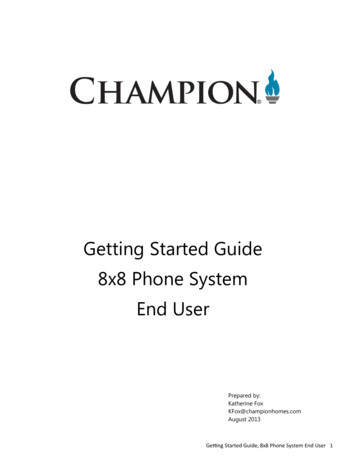
Macroeconomic Context - Colombia (3/3)Current Account (% GDP, quarterly)Trade balance (USD M, % GDP, monthly)Current account2014 2015 2016 2017e-5.2% -6.4% -4.4% -4%-6%-8%4%-USD726 M-2.8% urrent transfersServices balanceCurrent accountDec-13-1,500Dec-14Dec-15Dec-16Labor and investment incomeTrade balanceOther sectors-8%% GDP-2,000Mar-11Foreign investment: direct and portfolio*(USD M, monthly)2,000-6%Trade balance (USD M)Mar-12Mar-13Mar-14Mar-15Mar-16International reserves (USD M, months of imports)50Oil and mining1,5004013 46,963International reserves (USD M)IR in months of importsHistorical 3Apr-14Apr-15Apr-16Source: DANE, Banco de la República. Estimates: Economic Research Banco de Bogotá.* With information from Balanza Cambiaria up to pr-176
Macroeconomic Context – Central AmericaGDP (YoY %)Inflation (YoY %)5.8620162017e2017e4.754.34.043.0 3.333.6 3.45.010CRPAGUNIHOESCENAM84.563.9 4.04.03.93.22.41.61.50.542.4 2.32201-20El Salvador Guatemala Honduras Costa 17US Trade Balance (% of GDP)Central bank interest rate (%)20NI106MXHOGUCRCenam5.50043.002.50-10PA2Costa pr-17-3020002004200820122016Source: SECMCA, International Monetary Fund (IMF). Estimates Economic Research Banco de Bogotá. ES: El Salvador, HO: Honduras, CR: Costa Rica,GU: Guatemala, NI: Nicaragua, PA: Panama. * CAFTA: Central America Free Trade Agreement.7
Consolidated Balance Sheet StructureFigures in Ps. TrillionsTotal AssetsGrowth excludingFX1Q17/1Q16: 6.8%1Q17/1Q16: 8.7%1Q17/4Q16: 1.7%1Q17/4Q16: 3.6%134.7141.4143.91Q-164Q-161Q-17Assets 67.2%20.7%3.2%68.7%8.5%67.5%ColombianOperation (2)54.8%54.1%55.6%ForeignOperation (1)45.2%45.9%44.4%Loans and Leases, NetFixed Income InvestmentsEquity InvestmentsOther Assets (3)(1)(2)(3)Foreign operations reflect BAC Credomatic operations in Central America.Includes Banco de Bogotá in Colombia, Porvenir, Fidubogotá, Almaviva, Banco de Bogotá Panamá, Finance, Ficentro and Megalínea.Other Assets: Cash and balances at Central Bank , Derivatives, Allowance for financial assets held for investment, Other financial assets at fair value through profit or loss, Non-current assetsheld for sale, Tangible Assets, Intangible Assets, Income Tax Assets, Other Accounts Receivable, Derivatives used for hedging and Other Assets.NOTE: Deferred Tax Asset and Liability included on a net basis.8
Consolidated Loan Portfolio Breakdown by BusinessSegmentFigures in Ps. TrillionsGross Loan PortfolioGrowth excludingFX1Q17/1Q16: 6.5%1Q17/1Q16: 8.3%1Q17/4Q16: -0.8%1Q17/4Q16: 0.9%90.41Q-1697.096.34Q-161Q-17Gross Loan Portfolio rMicrocredit0.4%96.3Growth (%)Excluding FX1Q17/1Q16Growth(%)1Q17/4Q16Growth (%)Excluding 50.797.00.4%Mortgage60.7%4Q-1660.8%0.4 %1Q-179
Loan Portfolio Quality (1/3) – Consolidated30 days PDLs/ Gross Loans90 days PDLs / Gross Loans30 days PDLs / Gross LoansExcluding ExtraordinaryCost of Risk (1)90 days PDLs / Gross LoansProvision loss (net of recoveries of charged-off assets) / Average LoansProvision loss / Average LoansExcluding Extraordinary s / 30 days PDLs1.17xCharge-offs .9x0.9x1Q-164Q-16Allowances / 90 days PDLs1.3x1.5x0.86x1Q-171.5%2.0%CoverageCharge-offs (1) / Average 90 days PDLs0.96x2.1%2.1%Allowances/Gross Loans2.4%2.4%0.9x0.8x1Q-172.6%(1) Annualized(2) Extraordinary excludes the 30 days PDLs and 90 days PDLs from Electricaribe.(3) Extraordinary for 4Q-16 and 1Q-17 excludes Electricaribe s provision expense.10
Loan Portfolio Quality (2/3) – Colombia (1) andCentral AmericaColombia COPDelinquency Ratio30 day PDLS / Gross LoansExcluding Extraordinary (2)90 day PDLS / Gross LoansExcluding Extraordinary (2)Cost of RiskProvision Loss, net ofrecoveries of charge-offExcluding Extraordinary (2)Charge-Off RatioCharge offs / 90 days PDLsExcluding Extraordinary (2)Charge offs / Avg LoansCoverageAllowance / 30 days PDLsExcluding Extraordinary (2)Allowances / 90 days PDLsExcluding Extraordinary (2)Allowances / Gross LoansCentral America 26x1.53x3.5%1.3%1.4%1.5%(1) Includes Banco de Bogotá in Colombia, Porvenir, Fidubogotá, Almaviva, Banco de Bogotá Panamá, Finance, Ficentro and Megalínea.(2) Extraordinary for 4Q-16 and 1Q-17 excludes Electricaribe s provision expense. Additionally For 1Q-17 Extraordinary excludes the 30 days PDLs and 90 days PDLsfrom Electricaribe.11
Loan Portfolio Quality (3/3) – Consolidated30 days PDLs1Q-16Commercial1.9%4Q-161.8%90 days PDLs1Q-172.7%1Q-161.4%4Q-161.6%2.1%Excluding Extraordinary %14.6%7.8%9.4%10.1%Total Loans2.7%2.7%3.3%1.6%1.7%2.0%Excluding Extraordinary (1)Coverage Ratio2.9%0.9xExcluding Extraordinary (1)0.9x0.8x0.9x1.7%1.5x1.4x1.3x1.5x(1) For 1Q-17 Extraordinary excludes the 30 days PDLs and 90 days PDLs from Electricaribe.12
Consolidated FundingFigures in Ps. TrillionsGrowth excluding FXGrowth excluding FXTotal FundingTotal Deposits1Q17/1Q16: 8.9%1Q17/1Q16: 9.2%1Q17/4Q16: 4.0%1Q17/4Q16: 3.7%1Q17/1Q16: 7.1%1Q17/1Q16: 7.5%1Q17/4Q16: 2.3%1Q17/4Q16: 5.61.94.278.413.81.06.978.613.72.85.0DepositsBanks and othersInterbank BorrowingsLong Term -17Time DepositsSaving AccountsChecking AccountsOthers posits / Net Loans (%)(2)1.01x0.99x1.02x1Q-164Q-161Q-17(1) Other Deposits include: Deposits from other Banks and Correspondent Accounts, Banking Services Liabilities, Collection Banking Services and Other Deposit.(2) Net Loans includes commercial, consumer, mortgages and microcredit. Deposits include checking, savings, time deposits and other deposits.13
Equity and Capital AdequacyFigures in Ps. TrillionsAttributable Equity Minority InterestShareholders ‘ Equity1Q17/1Q16: 2.6%1Q17/1Q16: 3.1%1Q17/4Q16: -3.6%1Q17/4Q16: Shareholders' EquityNon-controlling interest15.416.415.81Q-164Q-161Q-17Total Equity/ Assets12.0%12.2%11.6%TangibleCapital Ratio (1)7.9%8.3%7.8%0.8Consolidated Capital Adequacy (2)RegulatoryMinimum:Total:9.0%Tier I:4.5%(1)(2)Tier ITier 161Q-17Tangible Capital ratio is calculated as Total Equity minus Goodwill and others Intangible Assets / Total Assets minus Goodwill and other Intangible Assets.Capital Ratios are calculated under the methodology of the Colombian Superintendency of Finance. The capitalization generated by the deconsolidation of Corficolombiana wasincluded as Tier I in 4Q-16.14
Consolidated Net Interest MarginQuarterly Net Interest MarginNet InterestIncome(1)Growth excludingFX(Billion COP)Growth Rate1Q17/1Q16: .01,679.49.3%1.5%Net Interest Margin on Investments (2)Net Interest Margin (4)1Q17/4Q16: 3.0%Net Interest Margin on Loans 1Q-1710.7%11.4%11.1%(includes Interbank Funds)3.8%4.9%5.2%Average FundingCost / Total Int.Bearing Funding3.9%4.4%4.2%Yield on loansYield on fixed incomeSource: Banco de Bogotá. Consolidated Figures.(1) Net interest Income includes: Net interest income Net trading income from investment securities held for trading Net income from Central American hedging activities.(2) Investments' Net Interest Margin : Net Interest income on fixed income securities Net trading income from investment securities held for trading income from interbank and overnightfunds, for the period, annualized / Average securities Interbank and overnight funds.(3) Loans Net Interest Margin: Net Interest Income on Loans for the period, annualized / Average loans and financial leases.(4) Net Interest Income for the period, annualized / Average interest earning assets.15
Fees and Other Operating IncomeGross Fee incomeFigures in Ps. BillionsGrowth excludingFX1Q17/1Q16: 3.0%1Q17/1Q16: 8.7%1Q17/4Q16: -2.9%979.22.8%Banking feesFee IncomeRatio (1)23.8%3.8%3.5%Fiduciary activites2.9%1Q17/4Q16: -1.5%1,008.618.6%21.8%OtherPension 4.7%34.5%34.9%Other Operating IncomeDerivatives and foreign exchange gains (losses), net(2)Other Income (3)Equity method income from associates, dividend income (4)Total Other Operating .0123.4212.7-14.2321.9120.850.232.9203.9Fee Income ratio is calculated: Gross Fee income / Net interest income before provision Gross fee income Net trading income from investment securities held for trading Other Income.Derivatives and foreign exchange gains (losses), net includes the portion of “Net Trading Income” related to derivatives and Net foreign exchange gains (losses). For presentation purposes we present thisline with reclassifications.Other income includes: Net gain on sale of investments, earnings on the sale of non-current assets held for sale and other income. 4Q-16 includes 126 billion COP of non recurrent income associated withthe fair value of our 16.4% share in Credibanco. 1Q-16 includes 52,4 billion of extraordinary income from the sale of our investment in CIFIN.Equity method income from associates includes Corficolombiana, Pizano and ATH. 4Q-16 includes an impairment loss in Episol , a wholly owned subsidiary of Corficolombiana, for 99billion COP related to it s CRDS Investment; as result Banco de Bogotá was affected by COP 31.7 billions in the income statement and COP 6.5 billion in Other Comprehensive Incomeas per it s 38.3% participation in Corficolombiana.16
Consolidated Efficiency RatioOperating Expenses/ Total Income(1)48.2%(4)1Q-1649.8%4Q-16 (3)Operating Expenses/Average Assets / Calculated as Personnel plus administrative expenses divided by net interest income plus net trading income, income on sale of investment and held for sale assets and fees andother services income, net (excluding other income)2/ Calculated as annualized personnel plus administrative and other expenses divided by average of total assets.3/ Efficiency Ratios are excluding COP 90.6 billion of expenses; including these expenses the ratios were 51.0% and 4.00% for 4Q164/ Ratios are excluding the wealth tax. Including this tax, efficiency ratio was 54.0% for 1Q16 and 49.8% for 1Q17.17
ProfitabilityFigures in Ps. BillionsFiguresexcludingwealth taxNet Income attributable to controlling AA (1)1.9%1.7%1.7%1.7%1.2%1Q-16ROAE -17(1) ROAA for each quarter is calculated as annualized Net Income divided by average of total assets.(2) ROAE for each quarter is calculated as annualized Net Income attributable to shareholders divided by average attributable shareholders' equity.18
1Q-2017 Consolidated Results Conference Call FULL IFRS May 26th, 2017 The IR Recognition granted by the Colombian Securities Exchange (Bolsa de Valores de Colombia S.A) is not a certification of