Transcription
COMMUNITY AND ECONOMICDEVELOPMENT DEPARTMENTThe mission of the Community and Economic DevelopmentDepartment, through its diverse service, is to continuouslyimprove Riverside’s quality of life by facilitating investmentand economic development that is beneficial to the City –and its neighborhoods and business districts – and meets orexceeds community expectations.139
140Community and Economic Development Department140
DEPARTMENT OVERVIEWSERVICES PROVIDEDThe Community and Economic Development Department exists to serve the public and is dedicatedto enthusiastically and responsively working with residents, businesses, property owners, developers,community organizations, elected and appointed officials, and public agency staff to accomplishinvestment that contributes to economic development and advances our city’s outstanding qualityof life.BUSINESS GOALSThe Department’s Business Goals are: To attract, protect and increase private investment to stimulate the economy, increase thenumber of jobs, and elevate residents’ prosperity in the City;To increase, preserve and protect the City’s housing stock to ensure available housing for allresidents;To provide valued city planning, urban design, and building services that contribute to orderlyand responsible growth, revitalization and development of the built and natural environment;and,To revitalize and stabilize neighborhoods through timely, responsive strategic investment,community-based Neighborhood outreach and engagement, and effective codeenforcement of property maintenance concerns.DEPARTMENT DIVISIONS AND SECTIONSThe Community and Economic Development Department includes the following Divisions andSections:Administration: This division provides administrative support, oversight and leadership to the ninedivisions in the Community and Economic Development Department. The Division’s primaryresponsibility is to manage the department’s general operations to ensure efficient and effectiveservice delivery while ensuring alignment with the City’s Strategic Plan, goals, and objectives.Building and Safety: This division protects and enhances the built environment by ensuring allconstruction within the City complies with adopted State and local Codes and Standards. This is donethrough the review of Building Plans and specifications for code compliance, issuance of constructionpermits and the completion of various building inspections throughout a project. After projectcompletion and approval by the Building and Safety Division, a Certificate of Occupancy is issued.Code Enforcement: This division serves the citizens of Riverside by ensuring compliance with all adoptedcity codes that govern the proper use and maintenance of private properties. This division receivesrequests for service for property maintenance and health and safety concerns. The main objectivesare to enhance the quality of life in our neighborhoods, protect property owner’s investments, educateresidents, perform community outreach and promote public health, safety and welfare.Economic Development: This division is responsible for the attraction and retention of businesses to theCity. Promote the City through targeted collateral materials and website, host or sponsor outreachevents and attending tradeshows/conventions.Housing Grants: This division oversees the management of two federal programs: the CommunityDevelopment Block Grant Program and the Housing Opportunities for Persons with AIDS (HOPWA).Housing Authority and Homeless Outreach: This division provides homeownership opportunities anddevelops quality affordable housing opportunities for individuals and families while promoting selfsufficiency and neighborhood revitalization. In addition, this division provides access to services and141Community and Economic Development Department141
housing for homeless individuals and families; and links homeless individuals and families to theappropriate housing intervention and supportive services.Neighborhood Engagement and Historic Preservation: This division is responsible for connectingRiverside’s citizens to activities and programs that lead to a better quality of life including, but notlimited to, the following: Riverside Neighborhood Partnership, Riverside Community Garden Council,Our Riverside Our Neighborhoods, and Fit Fresh Fun.Planning: This division is responsible for the implementation and maintenance of the City’s GeneralPlan/Zoning Code, developing vision plans for future growth and development, updating the City’sSpecific Plans and Zoning Ordinances, reviewing and routing of outside agency proposals for landdevelopment and policy documents. The division consists of three teams: Advanced Planning andSpecial Projects; Current Planning; and, the Planning Information team. The Planning Division isresponsible for a broad range of programs and projects developing and implementing land useplanning tools for the City, including the General Plan, the Zoning Code, Specific Plans, and Designand Sign Guidelines.Property Services: This division acquires real property interests necessary for construction of the City’spublic projects and disposes of surplus city-owned land. Real Property Services staff prepare right-ofentry agreements to access city property, resolve title issues related to ownership of real property,provide real property valuations and estimates, administer appraisal review, purchase required realproperty interests, and other property matters.Successor Agency: This division is responsible for winding down the former Redevelopment Agencyactivities through implementation of the Long Range Property Management Plan.DEPARTMENT OBJECTIVESObjectivesStatusFinancial and OperationalChallenges to Implement Objective1. Enter into purchase and saleagreements to dispose of theremaining 28 SuccessorAgency properties.Five properties are currently inescrow. Staff is marketingremaining properties.Developer obtaining entitlement andreceiving approval for sale from theCalifornia Department of Finance.2. Coordinate thedevelopment of Chow Alley.Entered lease agreement withthe County of Riverside on April5, 2016.Relocation of mechanical equipmentfor the Riverside County PublicDefender’s Office. Entering into newlease with the developerMain Street Festival of Lights.3. Complete an update to theDowntown, University andMarketplace Specific Plan.No status update pendingbudget approval.Budget challenges that may not result infunding for the updates.4. Obtain financing to carry outthe Riverside EndingHomeless Service CampusTenant Improvements.Securing consultant to preparea funding strategy plan. CityCouncil to review on May 24,2016.Fundraising challenges and difficultyidentify funding sources.142Community and Economic Development Department142
ObjectivesStatusFinancial and OperationalChallenges to Implement Objective5. Enhance developmentreview services and refocusoperations to be morecustomer service orientedthrough One Stop Shop,Streamline Riverside,Computronix and UniformPlan Check timelines.The One Stop Shop in initialplanning phase. StreamlineRiverside was presented toPlanning Commission in March2016 and review by CityCouncil May 2016. Computronixprocess mapping initiatedJanuary 2016. Uniform PlanCheck timelines initiated April2016.Physical reorganization andconfiguration of the 2nd, 3rd and 5thfloors for One Stop Shop.6. Enhance Grow RiversideInitiative to foster the growthof a sustainable local foodand agriculture system thatbenefits the community,environment and economyof Riverside.No status update pendingbudget approval.Budget challenges that may not result insufficient funding. Event coordinatorneeded for Grow Riverside conferencelocation for 2017.7. Process entitlements forStalder Building, a mixed-useproject consisting of 165residential units and 22,000sq. ft. of commercial space.Preliminary meeting held withthe developer in first quarter of2016.Process entitlements.8. Collaborate with localstakeholders and submitapplication for Tech Hiregrant. Will allowimplementation of technicalfield training options forRiverside workers.Tech Hire designated by WhiteHouse in March 2016. Workinggroup met in January andFebruary 2016.Award notification from the White Housestill pending.9. Complete a comprehensivereimagining of transit hubs(i.e. SPOT).Preliminary concept completedin March 2016. AwardedBeyond Grant on February 23,2016.Design and construction funding to beidentified and targeted.10. Select EconomicDevelopment program thatevaluates CRIA, EFID, andother opportunities.Signed agreement withKosmont to lead review offinancing opportunities.Community support is needing. Inherentchallenges in forming the governingstructure.143Community and Economic Development Department143
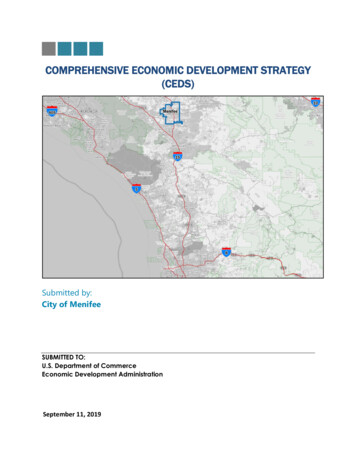
ORGANIZATIONAL CHART AND PERSONNEL SUMMARYCHART 6 – COMMUNITY AND ECONOMIC DEVELOPMENT ORGANIZATION CHART112.75 Total FTE for FY 2016/17 and FY 2017/2018Administration8.00 FTEBuildingand eservationPlanningReal PropertyServices22.00 FTE24.00 FTE6.00 FTE6.00 FTE24.00 FTE4.75 FTEHousingGrantsHomelessOutreach ServicesHousing AuthoritySuccessorAgency4.00 FTE3.00 FTE8.00 FTE3.00 FTETABLE 42 – COMMUNITY AND ECONOMIC DEVELOPMENTPERSONNEL SUMMARY/AUTHORIZED POSITIONS BY uilding and Safety22.0021.0025.0022.0022.00Code Enforcement32.0032.0031.0024.0024.00Economic Development0.000.007.006.006.00Historic Preservation5.006.006.006.006.00Homeless Outreach ousing Authority5.005.007.008.008.00Housing Grants8.008.006.004.004.00Successor Agency3.003.003.003.003.00Other Funds Total16.0016.0016.0015.0015.00All Fund Total112.00113.00130.00112.75112.75General FundPlanningProperty ServicesGeneral Fund TotalOther Funds144Community and Economic Development Department144
BUDGET OVERVIEWThe Department’s total for FY 2016/17 Budget is 46.7 million and FY 2017/18 is 40.8 million. ThePersonnel Budget in FY 2016/17 is 25.9 percent of the department’s total budget and in FY 2017/18 itcomprises 30.6 percent of the total budget. The Non-Personnel Budget accounts for 5.1 percent and5.8 percent in FY 2016/17 and FY 2017/18, respectively.The Personnel Budget for FY 2016/17 is 12.1 million for 122 FTEs and 12.5 million in FY 2017/18 for 122FTEs. Total FTEs include full-time positions as well as part-time, seasonal, temporary positions. Positiontotals may also reflect workforce charged to or from other departments or funds. The Personnel Budgetincreased by 3.3 percent from FY 2015/16 to FY 2016/17 and increased by 3.5 percent from FY 2016/17to FY 2017/18.KEY CHANGES IN THE DEPARTMENT BUDGETTABLE 43 – COMMUNITY AND ECONOMIC DEVELOPMENT KEY CHANGES IN BUDGETFY 2015/16 versus FY 2016/17 and FY 2016/17 versus FY 2017/18FTE CHANGES(count)FUND AND DIVISIONBUDGET CHANGES(dollars)BUDGET CHANGES(Percent)FY 2015/16vs.FY 2016/17FY 2016/17vs.FY 2017/18FY 2015/16vs.FY 2016/17FY 2016/17vs.FY 2017/18FY 2015/16vs.FY 2016/17FY 2016/17vs.FY 2017/181.00-( 228,046) 27,041-19.0%2.8%Building and Safety-- 94,909 68,3714.0%2.8%Code Enforcement(7.00)-( 364,349) 62,621-10.9%2.1%Economic Development(1.00)- 1,532,499( 1,476,389)136.7%-55.6%Historic Preservation--( 104,249) 23,902-12.1%3.2%Homeless Outreach Services--( 9,527) 11,325-2.2%2.7%Planning(1.00)- 1,434,963( 441,376)57.2%-11.2%Property Services(1.00)- 22,731 25,5843.6%3.9%(9.00)- 2,378,931( 1,698,921)19.0%-11.4%-- 0 0N/AN/A1.00-( 70,384) 62,192-4.7%4.3%Housing Grants-- 159,926-3.2%0.0%Real Property Services-- 3,979,434( 4,237,298)19.3%-17.2%Successor Agency-- 27,550 20,8095.5%3.9%Other Fund Change Total1.00- 4,096,526( 4,154,297)14.8%-13.1%Grand Total(8.00)- 6,475,457( 5,853,218)16.1%-12.5%General FundAdministrationGeneral Fund Change TotalOther FundsAdministrationHousing Authority145Community and Economic Development Department145
Personnel Budget ChangesChanges FY 2015/16 to 2016/17The FY 2016/17 Personnel Budget for the Department is 12.1 million, an increase of 382,144 or 3.3percent from the FY 2015/16 Adopted Budget of 11.7 million for personnel costs. The budget increaseis due to bargaining unit’s negotiated salary increases and cost of living adjustment.Changes FY 2016/17 to 2017/18The FY 2017/18 Personnel Budget for the Department is 12.5 million, an increase of 418,408 or 3.5percent from the FY 2016/17 Adopted Budget of 12.1 million for personnel costs. The budgetincrease/decrease are due to bargaining unit’s negotiated salary increases and cost of livingadjustment.Non-Personnel Budget ChangesChanges FY 2015/16 to 2016/17The Department’s FY 2016/17 Non-Personnel Budget is 2.4 million, a decrease of 195,546 or 7.4percent from the FY 2015/16 Adopted Budget of 2.6 million. The budget decrease is due to managedsaving items the department expects to realize during the budget year.Changes FY 2016/17 to 2017/18The Department’s FY 2017/18 Non-Personnel Budget is 2.4 million, a decrease of 36,514 or 1.5percentfrom the FY 2016/17 Adopted Budget of 2.4 million.DEPARTMENT BUDGET BALANCING MEASURES AND UNFUNDED NEEDSTABLE 44 – COMMUNITY AND ECONOMIC DEVELOPMENT BUDGET REDUCTIONSBudget ReductionsImpacts and how the Department plans to achieve thereductionsVarious managed savings itemsManaged savings will be obtained by a funding reductionof the Northside, Downtown, Marketplace and UniversitySpecific Plans and deferred recruitments for general fundedpositionsManaged Savings TotalReductionAmount 400,000 400,0001. Decrease GrowRiversideFundingGrowRiverside Conference budget may be reduced andmeet objectives. 22,5002. Decrease Board UpAbatementImpact the frequency that building are boarded up. 20,5003. Decrease Dangerous BuildingDemo and AbatementImpact the frequency that dangerous buildings aredemolished. 70,0004. Decrease Green PoolAbatementImpact the frequency pools overrun with algae are abated. 20,0005. Decrease Revenue ExpertsMay impact administrative citation process if citation levelhigh. 10,0006. Decrease Weed AbatementImpact the frequency that weeds are abated. 20,0007. Unfund AdministrativeAssistantAdministrative position recently vacated will not be filled.Will likely have a service impact. 51,7188. Increase efficiencies with GoEnforce SoftwareImplementation of Computronix will allow Go Enforcesoftware to be discontinued resulting in a cost savings.146Community and Economic Development Department 7,000146
Budget ReductionsImpacts and how the Department plans to achieve thereductionsReductionAmount9. Decrease Photography andVideo ServicesMay have an impact on Economic Development's visualimagery products.10. Decrease Overtime BudgetAdministrative staff will be unable to attend neighborhoodmeetings. 20,00011. Decrease NeighborhoodFundingImpact scope of work for Neighborfests, Small Sparks andLeadership Academy. 22,00012. Decrease Professional ServicesFundingEliminate storytelling projects, new division website andreduce scope of work for projects like "Our Riverside andOur Neighborhoods" and "HP Ambassadors". 43,87313. Decrease Funding forScanning Archived FilesDelays in locating archived files and potential customerservice impacts. 50,00014. Eliminate Strategic InitiativesFundingLess nimble response to new initiatives. 50,00015. Decrease Downtown SpecificPlan FundingImpact streamline review process that reduced time toapprove plans downtown improvement projects. 6,596 100,0004 Percent Balancing Measures Total 514,187Grand Total General Fund Budget Reductions 914,187TABLE 45 – COMMUNITY AND ECONOMIC DEVELOMENT - SUMMARY OF SIGNIFICANTUNFUNDED NEEDS (NON-CIP) WITH IMPACTS AND CHALLENGESFY 2016/17 AND 2017/18HIGHESTHighest Unfunded NeedsImpacts and ChallengesFY2016/17FY2017/181. Building ConsultingServicesWill result in service impacts as consulting servicesare needed when fluctuations in constructionlevels and city staff resources occur 150,000 150,0002. Architectural Designsand IllustrationsMay impact visual marketing illustrations andimagining capabilities 65,000 65,0003. Accountant IIMay result in service impacts as position wouldassist with grant managementTotal number of grants to manage is anticipatedto increase 87,100 88,3194. Exchange Admin Internfor Project AssistantPositionMay result in service impacts as position wouldsupport CRIA/EFID establishment and newSeedstock concept along with GrowRiversideand technology initiatives 58,512 62,1875. Change Senior Plannerto Historic PreservationOfficerMay result in service impacts as current HistoricPreservation Officer has been moved into DivisionManagement and current role is unfilled 12,653 13,640147Community and Economic Development Department147
HIGHESTFY2016/17FY2017/18May result in service impacts as videoconferencing is needed and would be supportedby the Tech Fee 3,684-Highest Unfunded Needs Total 376,949 379,146FY2016/17FY2017/18 61,950 40,800 61,950 40,800Highest Unfunded NeedsImpacts and Challenges6. Video ConferencingHIGHHigh Unfunded NeedsImpacts and Challenges1. ComputerReplacementsThis impacts operations and customer service asoutdated equipment is being utilized which slowsdown effortsHigh Unfunded Needs TotalIMPORTANTHighest Unfunded NeedsImpacts and ChallengesFY2016/17FY2017/181. Innovation DistrictWill impact ability to create innovative Districtplans, standards and programs 500,000 500,0002. Exhibit Booth for TradeShowsWill impact the ability to update and enhance theexhibit booth as needed 50,000 5,0003. GrowRiverside InitiativeMay impact ability to expand GrowRiversideopportunities 45,000 45,0004. Scanning BuildingPermitsWill impact processes which are required by law 10,000 10,0005. Scanning BuildingPermitsWill impact processes which are required by law 20,000 20,0006. Arroyo StudyWill impact ability to move forward with afocused study on remapping the boundaries,which is needed 250,000-7. Replace General PlanSubsidy for StaffingChargesWill result in a larger contribution from generalfund when city embarks on new General Plan 355,770 372,476 1,230,770 952,476 373,265 379,146 1,669,669 1,372,422Important Unfunded Needs TotalGrand Total Top Five Highest, High, and Important Unfunded NeedsGrand Total All Unfunded Needs of the Department148Community and Economic Development Department148
DEPARTMENT BUDGET SUMMARY TABLESThe table below reflects the “operating budget” before Charges To, Charges From, or OperatingTransfers. The table provides an overview of the departments spending for administration andrevenue.TABLE 46 – COMMUNITY AND ECONOMIC DEVELOPMENTREVENUE AND EXPENDITURE BUDGET, BY FUND AND DIVISIONREVENUEActualFY 2013/14ActualFY 2014/15AdoptedFY 2015/16AdoptedFY 2016/17AdoptedFY 2017/18----- 31,941,372 36,868,216 31,505,374 34,448,985 30,290,274Other Funds Total 31,941,372 36,868,216 31,505,374 34,448,985 30,290,274All Fund Revenue Total 31,941,372 36,868,216 31,505,374 34,448,985 30,290,274General FundCommunity and EconomicDevelopmentGeneral Fund TotalOther FundsCommunity and EconomicDevelopmentEXPENDITURESGeneral FundActualFY 2013/14ActualFY 2014/15AdoptedFY 2015/16AdoptedFY 2016/17AdoptedFY 2017/18Administration 1,420,851 1,252,102 1,201,884 973,838 1,000,879Building and Safety 1,817,795 1,919,893 2,390,156 2,485,065 2,553,436Code Enforcement 3,020,952 2,934,072 3,337,408 2,973,059 3,035,680-- 1,121,229 2,653,728 1,177,339Historic Preservation 615,449 783,769 860,558 756,309 780,211Homeless Outreach Services 157,895 406,496 428,198 418,671 429,996 1,957,147 1,744,868 2,510,342 3,945,305 3,503,929 651,056 583,546 639,688 662,419 688,003 9,641,145 9,624,746 12,489,463 14,868,394 13,169,473ActualFY 2013/14ActualFY 2014/15AdoptedFY 2015/16AdoptedFY 2016/17AdoptedFY 2017/18 4,532 3,774--- 2,267,584 1,249,632 1,510,925 1,440,541 1,502,733Housing Grants 15,198,121 6,394,717 5,024,812 5,184,738 5,184,738Real Property Services 25,940,944 21,544,029 20,664,279 24,643,713 20,406,415 7,911,649 6,102,633 500,110 527,660 548,469Other Funds Total 51,322,830 35,294,785 27,700,126 31,796,652 27,642,355All Fund Expenditure Total 60,963,975 44,919,531 40,189,589 46,665,046 40,811,828Economic DevelopmentPlanningReal Property ServicesGeneral Fund TotalOther FundsAdministrationHousing AuthoritySuccessor Agency149Community and Economic Development Department149
The table below reflects the expenditure budget summary and includes Charges to, Charges From,and Operating Transfers. The table provides an overview of the department’s spending as well as itsmanaged savings, utilization charges, and transfers. The net expenditures total represents a spendingdeficit or surplus that will be offset by departmental revenue or an impact to fund balance. It shouldbe noted that negative expenditure totals will be adjusted during the year or will increase fundbalanceTABLE 47 – COMMUNITY AND ECONOMIC DEVELOPMENTEXPENDITURE BUDGET SUMMARY, BY FUND AND CATEGORYEXPENDITURESGeneral FundActualFY 2013/14ActualFY 2014/15AdoptedFY 2015/16AdoptedFY 2016/17AdoptedFY 2017/18Personnel 7,840,600 7,558,478 10,139,067 10,555,180 10,895,184Non-Personnel 1,628,686 1,874,800 2,159,396 1,977,214 1,938,289 97,356 137,679 141,000 2,686,000 686,000 9,566,642 9,570,957 12,439,463 15,218,394 13,519,473 39,111 53,789 50,000 50,000 50,000----- 35,392--------- 3,036,133 4,590,438 4,068,056 4,359,528 4,407,399Charges To Others( 2,466,813)( 2,015,301)( 3,453,255)( 3,488,146)( 3,433,961)Managed SavingsSpecial ProjectsOperating Budget TotalEquipment OutlayDebt ServiceOperating GrantsCapital Outlay and GrantsCharges From Others---( 400,000)( 400,000)Equipment, Capital, Debt Service,and Utilization Charges Total 643,823 2,628,926 664,801 521,382 623,438General Fund Total 10,210,465 12,199,883 13,104,264 15,739,776 14,142,911Other FundsActualFY 2013/14ActualFY 2014/15AdoptedFY 2015/16AdoptedFY 2016/17AdoptedFY 2017/18Personnel 1,161,753 1,215,745 1,554,931 1,520,962 1,599,366 703,312 1,106,482 476,771 463,407 465,818 4,210,553 4,173,828 5,024,812 5,184,738 5,184,738 6,075,618 6,496,055 7,056,514 7,169,107 7,249,922 131,976 123,483---Debt Service 21,657,278 19,823,399 20,643,612 24,627,545 20,392,433Operating Grants 23,457,958 8,851,848-------- 2,452,198 2,490,939 4,281,990 4,283,126 4,217,843Charges To Others( 3,751,739)( 2,310,700)( 476,942)( 573,355)( 581,985)Managed Savings-----Equipment, Capital, Debt Service,and Utilization Charges Total 43,947,671 28,978,969 24,448,660 28,337,316 24,028,291Other Funds Total 50,023,289 35,475,024 31,505,174 35,506,423 31,278,213Net Expenditures for All Funds 60,233,754 47,674,907 44,609,438 51,246,199 45,421,124Non-PersonnelSpecial ProjectsOperating Budget TotalEquipment OutlayCapital Outlay and GrantsCharges From Others150Community and Economic Development Department150
BUDGET DETAILCOMMUNITY AND ECONOMIC DEVELOPMENT BUDGET DETAIL151Community and Economic Development Department151
Department Budget DetailDepartment / Section:Community Development / CD-Administration101 - 280000ObjectGL 15/16Budget2016/17Budget %Chnge %Chnge2017/18 2016/17 19,610057,42057,420--1512000--4111002800001 Salaries - Regular4111102800001 Salaries-Temp & Part Time4111302800001 Compensatory Time4112102800001 Vacation61,59438,400000--4112202800001 Holidays & Special Days Off34,38732,787000--4112402800001 Sick Leave17,56915,040000--4112452800001 Family Illness Sick Leave5,9485,361000--4112602800001 Bereavement Leave1,1121,748000--4112802800001 Jury Duty4112922800001 Administrative Leave4114102800001 Vacation Payoffs4114202800001 Sick Leave Payoff4115102800001 Accrued 1 Workers Compensation 01 Health 2800001 Dental 0001 Life 1 Unemployment Insurance1,23651638344945117%%4122502800001 Disability Insurance478218136136136--4123102800001 PERS 4123202800001 Medicare 1 Deferred Compensation4125002800001 Automobile/Expense Allowance4131102800001 Overtime At Straight Rate4131202800001 Overtime At 1.5 RatePersonnel Services 9991,9051,189,3321,216,30319%2%--4210002800001 Professional Services22,2913,2552,5002,5002,5004210009878200 Grow Riverside9880000 Riverside 00062,5000-4210012800001 Prof Services/Internal2464,544000--4221002800001 3,800--046505050--4221202800001 Telephone - Cellular4235002800001 Vehicle Usage Reimb Employee4242202800001 All Other Equip Maint/Repair4252002800001 Periodicals & Dues4254002800001 General Office Expense4255002800001 Postage4256002800001 Central Printing Charges4256102800001 Outside Printing Expense4257002800001 Software Purchase/Licensing4258002800001 Computer Equip Purc Undr 50004268002800001 Special Department Supplies4271002800001 Travel & Meeting Expense4272002800001 Training4284002800001 Liability 6,44916,519Community and Economic Development Department(29)%(14)%%152
Department Budget DetailDepartment / Section:Community Development / CD-Administration101 - 280000ObjectGL KeyDescriptionNon-personnel Expenses Total4500429878200 Grow RiversideSpecial Projects Total4623002800001 Office Furniture & Equipment4633002800001 Off Furn & Equip Cap LeaseEquipment Outlay et2016/17Budget %Chnge %Chnge2017/18 2016/17 --8%8811002800001 General Fund Allocation 012800001 Utilization Chgs from 101 Fund41,85152,64465,56768,05873,9683%8822602800001 Utilization Chgs from 260 Fund69,84355,21549,49700(100)%8841702800001 Interfund Services from 170 Fd0293,414000--8842202800001 Interfund Services from 220 074,921(1)%%Charges From Others Total-8921012800001 Utilization Chgs to 101 %5%8921702800001 Utilization Chgs to 170 00001 Utilization Chgs to 220 001 Utilization Chgs to 225 Fund(28,824)0000--8922802800001 Utilization Chgs to 280 3%5%8941012800001 Interfund Services to 101 Fund(1,777)00008942202800001 Interfund Services to 220 1 Interfund Services to 223 4,102,1643,335,0203,459,9683,570,0223%Charges to Others TotalTotal Budget RequirementsCommunity and Economic Development Department--(7)%3%153
Department Budget DetailDepartment / Section:Community Development / CD-Planning101 - 281000ObjectGL KeyDescriptionBudget %Chnge %Chnge2017/18 2016/17 304%1%18,5670000--2,8611,189000--4111002810000 Salaries - Regular4111102810000 Salaries-Temp & Part Time4111302810000 Compensatory Time4112102810000 Vacation69,04750,455000--4112202810000 Holidays & Special Days Off45,42736,914000--4112402810000 Sick Leave27,78822,706000--4112452810000 Family Illness Sick Leave2,9274,127000--4112602810000 Bereavement Leave5,4521,186000--4112802810000 Jury Duty2,7806,139000--4112922810000 Administrative Leave6,2815,477000--4114102810000 Vacation Payoffs4,92051,759000--4114202810000 Sick Leave Payoff95784000--4114302810000 Compensatory Time Payoff242229000--4115102810000 Accrued Payroll4122102810000 Workers Compensation 530,22536,97628,50229,022(22)%1%2810000 Health 122222810000 Dental 0000 Life 0 Unemployment Insurance1,6418739781,0251,0444%1%4122502810000 Disability Insurance1,0568212,1761,9041,904(12)%4123102810000 PERS 4123202810000 Medicare 000 City Retirement Plan69600004124002810000 Deferred Compensation2502,6828,10012,00015,0004131102810000 Overtime At Straight Rate4131202810000 Overtime At 1.5 Rate4199102810000 Salaries Adjustment FactorPersonnel Services 737,9572,833,89125%(90)%3%4210002810000 Professional 000 Prof 2810000 Outside Legal Services16,8798,1204,0004,0004,000--4221002810000 Telephone2,6712,4514,0004,0004,000--4221202810000 Telephone - Cellular6,7897,6026,0006,0006,000--4234002810000 Motor Pool Equipment Rental630800800800--4242202810000 All Other Equip Maint/Repair00500500500--4251002810000 Advertising Expense18,70065018,700650--2810000 Periodicals & Dues13,908018,70042520012,1930650--4254002810000 General Office 00 Postage6,5034,25810,00010,00010,000--425600281000
The Community and Economic Development Department exists to serve the public and is dedicated . elected and appointed officials, and public agency staff to accomplish investment that contributes to economic development and advances our city’s outstanding quality of life. BUSINESS GOALS . the County