Transcription
Riding theCoronavirusCoaster:AN ECONOMIC OUTLOOK FOR 2021PRESENTED BY
Table ofContents1United States Outlook15California Outlook27Inland Empire Outlook
Supporting Economic Growth inthe Inland Empire and That’s Noblah,blah,blah.Where Business Meets Opportunity Proud Sponsor of the2020 Economic Forecast ConferenceRiverside San Bernardino Redlands Corona Murrieta Palm Springs Palm DesertPPBI.com/InlandEmpireRanked a Forbes Best Bank for 2020 2020, Forbes Media LLC. Used with permission.
Riverside CountyBusiness & Community Servicesriverside county business & community services is ready to helpcompanies participate in the remarkable opportunities availablethrough many resources and programs.PROUD SPONSOR OFTHE 2020 UCR ECONOMIC FORECAST CONFERENCEWWW.RIVCOBIZ.ORG
Grow yourbusiness with ourInternship Program!The UCR School of Business develops leadersas diverse as the challenges they face and theworkforces they lead.Each year our MBA, fnance, and accountinggraduate students participate in internships to gainreal world experience, develop leadership skills, andcreate value for host organizations. Leverage thisunique opportunity for your company. MBAMaster of FinanceMaster of Professional AccountancyTo learn more about the Internship Program,contact the AGSM Career Development c/employersEmbracing diversity and inclusion, championing better business, and empowering innovation and collaboration.
ALTURA IS PROUD TOSPONSOR THE UCRECONOMIC FORECASTCONFERENCE.We are proud to be able to do our part to help our local community and economyduring this diffcult time and through our Small Business Empowerment Grant wehave recently awarded 10,000 each to 10 small businesses in our local communityto help them overcome the challenges they are facing.#alturacaresYou’re an inspiration to us allUniversity of California Riverside School of Business is making a difference in our neighborhood.Helping the local economy thrive is just one of the many positive attributes you bring to our area. Extendingyour abilities and resources to the community through service and other initiatives makes you a true leader.We’re proud to work with University of California Riverside School of Business.Visit us at bankofamerica.com/local. 2020 Bank of America Corporation 2935478 ENT-225-AD
TOP 100 BEST BUSINESS SCHOOLU.S. NEWS & WORLD REPORTMBAPROFESSIONALMBAMASTER OFFINANCEGMAT/GRE Waivedfor 2021 AdmissionsFlexible Start DatesWinter (January) or Fall 2021 Start DateSTEM Designated ProgramsSTEM Designation for MBA, MFin and MPAcMASTER OFPROFESSIONAL ACCOUNTANCYWith nationally-ranked and internationallyrecognized master’s business programs,the AACSB-accredited A. Gary AndersonGraduate School of Management (AGSM)at the UC Riverside School of Businessis one of the fastest-growing graduatebusiness schools in Southern California.Here, the future is being shaped throughGenerous Scholarships AvailableAcademic and Merit-basedthe development of a global community offorward-thinking business leaders.ucr agsm@ucr.edu
Experience the difference.Since 1956All rates, fees, terms, and programs are subject to change without notice except as required by law. 2020 Provident Bank. All rights reserved. REV0920Conference materialsbuilt with pride for theUCR Center for EconomicForecasting & Development.Strategy. Marketing. Creative. Results.holler@thebrandsmith.agency
2020 INLAND EMPIRE ECONOMIC FORECASTUCR Center for Economic Forecasting & DevelopmentUnited StatesOutlookTO “V” OR NOT TO “V”, THAT IS THE QUESTIONChristopher Thornberg PhD1
2020 INLAND EMPIRE ECONOMIC FORECASTUCR Center for Economic Forecasting & DevelopmentThe COVID-19 induced recession of 2020 began with the ferocity of an unexpectedtsunami smashing onto the shore—one month the economy was fine, the next it wasin freefall. Now with the 2nd quarter behind us, we have a better idea of the damagecaused by the pandemic-linked closures of the economy. Consumer spendingcratered in March, at a pace never experienced before, causing U.S. output to dropalmost 12% from the 4th quarter of 2019 to the 2nd quarter of 2020. Unemploymentin the nation surged from 50-year lows to 80-year highs in a matter of weeks.2
2020 INLAND EMPIRE ECONOMIC FORECASTUCR Center for Economic Forecasting & DevelopmentThe good news is that the recession istechnically over. The National Bureau ofEconomic Research (NBER) dates the start andend points for recessions based on peaks andtroughs of economic activity.1 For example, thepeak of economic activity prior to the GreatRecession was in the 4th quarter of 2007, whilethe bottom was hit in the 2nd quarter of 2009.Of course, the economy took another 5 to 6years to fully recover, which is a separate partof the business cycle. The NBER has datedthe peak of the last expansion as February2020. While they haven’t officially dated thetrough yet, it was in April 2020. Since thattime, economic activity from housing sales todurable goods orders to consumer spending topayroll employment, has been bouncing backsharply.In contrast, Beacon Economics has been anadvocate of the “V” scenario from the start. Asdramatically bad as the numbers have beenin the past few months, there is simply noreason to expect the current business cycleto be as bad as during the Great Recession,the worst business cycle since World War II.Then the economy had been badly distortedby the subprime credit bubble that precededit. It took years to repair household balancesheets and to work through excess inventoriesof homes, cars, and other durables. Millions ofjobs that had been created by the bubble werelost permanently, and displaced workers hadto build new careers in other sectors.The shock that set off the current crisis hasnone of these long-term characteristics.The economy was well balanced when thepandemic arrived. A collapse in consumerspending occurred not because peoplecouldn’t spend money (driven by a collapseof wealth), but because fear and cautionsurrounding the disease itself prevented themfrom spending. There is no reason to thinkthere will be a permanent shift in the structureof the economy, outside of the pandemicquickening the pace of retail’s capitulation tothe internet.The debate now is about the path of recovery.While there are all sorts of witty responsesto the forecast letter game, the predictionscan largely be put into two camps—the “V”group and the “U” group. While there is noset definition between the two, roughly, the“U” camp sees the pandemic’s damage to theeconomy as severe enough to suggest a slow,long-term recovery. Most of the economicforecasts that were released immediatelyafter the start of the COVID crisis suggested adownturn worse than what occurred duringthe Great Recession—with many tossingaround the term “depression” as a descriptorof what was to come.1As dramatically bad as the 2nd quarternumbers were, there is also plenty of evidenceindicating that the shocks to the system werelargely transitory. For example, the enormoussurge in unemployment was not driven byhttps://www.nber.org/cycles.html3
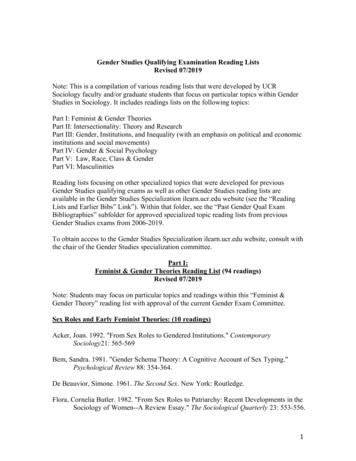
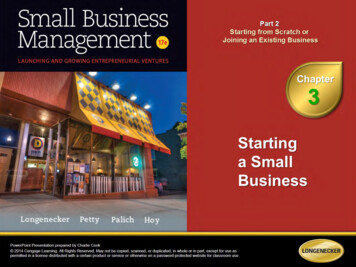
2020 INLAND EMPIRE ECONOMIC FORECASTUCR Center for Economic Forecasting & Developmenttrue job losses but by temporary layoffs,which today, still represent about 3% of theunemployed labor force. The share of the trulyunemployed labor force (either workers wholost their job permanently or have enteredthe labor market and are looking for work)is now about 4.8%—substantially lower thanthe 8% plus rate seen at the peak of the GreatRecession, and not yet as high as during thevery mild tech recession of the late 1990s. Froma long run perspective this is a mild recession.12%10%8%6%4%2%Temporary LayoffJobs LosersJobs LeaversEntrantsUNEMPLOYMED BY REASONUNITED STATESSource: U.S. Bureau of Economic Analysis, Analysis by UCR Center for Economic 80%
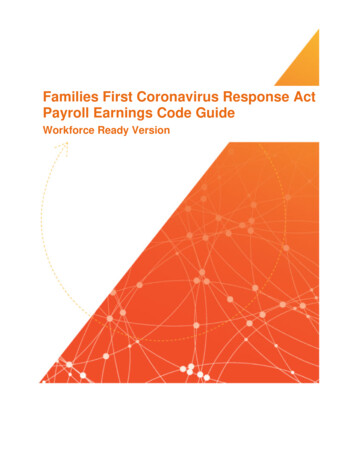
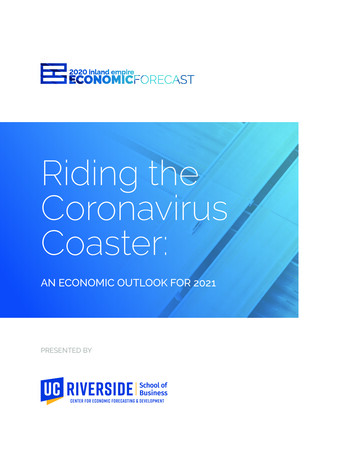
2020 INLAND EMPIRE ECONOMIC FORECASTUCR Center for Economic Forecasting & -17Jul-1615.0MONTHLY REAL GDP, UNITED STATESMACROECONOMIC ADVISORS ESTIMATESource: U.S. Bureau of Economic Analysis, Analysis by UCR Center for Economic ForecastingThe case for the “V” has been vindicated byrecent data. We could run through individualnumbers in various categories, but it’s probablyclearest to assess total economic activity on amonthly basis insofar as it can be estimatedthough the use of certain monthly data. Oneestimate from Macroeconomic Advisors findsthat the economy contracted by 16.5% fromFebruary to April, then bounced back by 12.5%through August, and is now only 4% below theFebruary peak. The 3rd quarter will experiencean astounding 35% growth rate, erasing most ofthe gap generated in the 2nd quarter. The U.S.unemployment rate should be below 7% by theend of this year.These surprisingly good numbers haveled some forecasters to sharply alter theirprojections upwards, but most prognosticatorscontinue to predict a long, painful recovery. Thecurrent outlook from the Congressional BudgetOffice (CBO) is a good example. The CBO’s most5
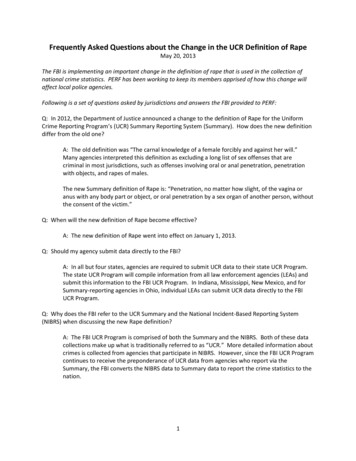
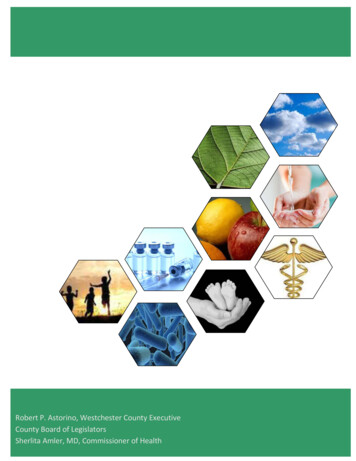
2020 INLAND EMPIRE ECONOMIC FORECASTUCR Center for Economic Forecasting & 500CBO ForecastCBO FORECASTED GAP BETWEEN ACTUAL AND POTENTIAL GDPUNITED STATESSource: Congressional Budget Office, Analysis by UCR Center for Economic Forecastingrecent forecast suggests a full recovery will takeclose to a decade—similar to the time it took torecover from the Great Recession.Texas, Florida, and Arizona. At its peak, theUnited States was experiencing about 200 newcases per million people per day.The only major issue with the more bullish ‘V’outlook has been the unfortunate surge in newCOVID-19 cases that began in June. Increasedeconomic activity, a lack of consistent andforceful public policy, and a decline in youngAmericans’ fear of the virus has driven anescalation of new cases in places such asThe silver lining is that this surge has not led toa huge number of new deaths or overwhelmedhospitals. Moreover, it has begun to subside;as of the end of August, the nation wasrecording 120 new cases per million peopleper day. While this latest surge has shifted thedate of full recovery out modestly relative to6
2020 INLAND EMPIRE ECONOMIC FORECASTUCR Center for Economic Forecasting & Development25New Daily Cases Per 6/27/207/27/20NEW DAILY COVID-19 CASES PER 100,00UNITED STATESSource: Opportunity Insights, Analysis by UCR Center for Economic Forecastingearlier predictions, Beacon Economics remainscertain that a quick recovery will occur oncethe virus is under full control.August, the swell of new cases only slowed therecovering in consumer spending.Additionally, there was an expectationthat July’s labor figures would be flat andunemployment would rise. Instead, anothersurprise: payroll jobs rose and unemploymentfell despite the large number of new cases.Businesses and consumers have adapted—an important factor that is often left out byforecasters. Even if a true second wave ofcases did occur, it is clear that the economicimpact wouldn’t approach what happened thefirst time.Another silver lining has been how wellconsumers and businesses have adapted tothe pandemic. One of the more pessimisticpredictions at the start of the recession wasthe “W” recovery—where economic activitywould again collapse if another surge of thevirus hit. But the economic impact of the firstand second surges couldn’t be more different.In March, there was an unprecedentedcollapse in consumer spending. In July and7
2020 INLAND EMPIRE ECONOMIC FORECASTUCR Center for Economic Forecasting & Development140Indexed at 2012 7May-07Oct-06Mar-06Aug-05Jan-0570REAL PERSONAL CONSUMPTION EXPENDITURESUNITED STATESSource: U.S. Bureau of Economic Analysis, Analysis by UCR Center for Economic ForecastingThe underlying strength of the U.S. economy atthe start of the pandemic has been reinforcedby crazily excessive (yes, that is an appropriatedescription) stimulus spending. The howls ofeconomic collapse and the runup to one ofthe most contentious presidential elections indecades drove Congress to pass a 3 trillionstimulus plan. Putting aside the well-deservedcriticism of how poorly thought out theseprograms were from an operational anddistributional standpoint, the cash that was putinto the economy is vastly more than what waslost or needed. Lost economic activity in thefirst half of 2020 stands at approximately 600billion, 20% of the size of the stimulus package.And remember the economy is alreadybouncing back.From a personal income perspective, earnedincomes (for workers and proprietors) declinedby about 260 billion (seasonally adjusted,not annualized) in the 2nd quarter comparedto the previous three months. The increasein government benefits, unemployment,and direct payments amounted to 600billion, over 2 for every 1 of lost income—albeit it probably has not been distributedproportionately to income losses. This has led8
2020 INLAND EMPIRE ECONOMIC FORECASTUCR Center for Economic Forecasting & DevelopmentUS Personal Income, 273717777981,402555564527Equals: Disposable personal income4,1354,1744,558Less: Personal 3%9.5%25.7%Personal incomeCompensation of employeesProprietors' incomeGovernment social benefitsLess: Personal current taxesPersonal consumption expEquals: Personal savingPersonal saving as a %DPIPERSONAL INCOME 2019-2020UNITED STATESSource: U.S. Bureau of Economic Analysis, Analysis by UCR Center for Economic Forecastingtotal personal income to rise rather than fallduring this recession.the Paycheck Protection Program. All said, it’sunderstandable why the FDIC is reporting oneof the most dramatic surges in commercialbank account deposits ever seen – 2.2 trillionin three months. This is the dry powder thatwill fuel a rapid recovery once the virus iscontrolled.And remember that the pandemic causedspending to drop by 400 billion. Thedifference ended up in consumer savingswhich shot up to almost 1.2 trillion, four timeswhat it was in the 4th quarter of 2019. That 900 billion in excess savings will undoubtedlybe spent once life returns to normal. Unlike theGreat Recession, where there was a collapse innet worth that hurt spending for years, in thecurrent crisis, net worth is increasing.Data from the New York Federal Reserveshow consumer debt delinquencies falling,not rising, in the 2nd quarter. And while therehave been a few big-name bankruptcies,most have been among companies that werealready on the brink due to broader trends inthe economy. The financial Armageddon thatwas predicted by many of the talking headsseems pretty far away.Moreover, these numbers will be accentuatedby additional payments in July and August. Andof course, none of this includes the paymentsthat went to LLCs and corporations through9
2020 INLAND EMPIRE ECONOMIC FORECASTUCR Center for Economic Forecasting & Development10
2020 INLAND EMPIRE ECONOMIC FORECASTUCR Center for Economic Forecasting & Development18,00016,00014,000Billions ( ar-05Apr-04May-03Jun-02Jul-01Aug-000COMMERCIAL BANK CASH DEPOSITSUNITED STATESSource: Federal Reserve Board of Governors, Analysis by UCR Center for Economic Forecasting10.00Percent of 204:Q303:Q403:Q10.00DELINQUENT LOANS (90 DAYS)UNITED STATESSource: Federal Reserve Board of Governors, Analysis by UCR Center for Economic Forecasting11
2020 INLAND EMPIRE ECONOMIC FORECASTUCR Center for Economic Forecasting & DevelopmentThere is little doubt that the nation still hasa ways to go to return to normality, butthese recent trends clearly demonstrate theunderlying strength of the U.S. economy,which is allowing it to weather the COVIDstorm and will allow it to rapidly bounce backto normal levels of activity once the virus isbrought under full control. Beacon Economicscontinues to believe in the V, just a modestlywider one.its expansion into new parts of the world.But it is easy to overstate the aggregateimpact of these stressed sectors. Together,they represent less than 5% of U.S. GDP.Additionally, these sectors have mitigated atsome level. Retail sales at restaurants in Julyare only about 20% below where they were lastyear. And a lack of spending in some sectorsis driving opportunities in other parts of theeconomy—campers and bikes are selling likecrazy, while golf courses and local drive-tohotels are busier than ever.Clearly some sectors will do worse than others.Business hotels, restaurants, airlines, andleisure and recreation firms will all lag therecovery for obvious reasons. Retail is far andaway the biggest flashpoint. That sector hasbeen struggling with oversupply even as theinternet continues to wrestle market shareaway from traditional brick and mortar stores.The non-store share of retail sales went from14.7% in January to 17.4% in July, and it’sunlikely to give much of that back.There will be other stressors in the comingmonths regardless of the strength of therecovery. Undoubtably, a portion of thenine million people who in July still classifiedthemselves as being on temporary layoff,will find themselves in the permanently lostjob category. And while in the aggregatethings look good, we also know that the fiscalstimulus did not adequately protect everyone.The blunt and poorly thought out systems thatwere implemented have guaranteed that a lotof the stimulus money went to places it wasnot actually needed. Global supply chains willalso remain in turmoil as the virus continues2There are two major concerns to pay attentionto as the recovery continues. The first hasto do with the spread of the virus itself. TheUnited States has experienced a second surgein cases, and it’s possible there could be athird. Notably, the second surge is almost overwithout the massive public health regulatorycontrols implemented the first time. In otherwords, completely shutting down restaurants,nail salons, and malls may not be the mosteffective way of controlling the spread ofthe virus. Controlling transmission is betterserved by not gathering in large groups, socialdistancing, wearing masks, and washing hands.That personal behavior may be moreimportant than government regulationin controlling the spread of COVID-19 issupported by a recent NBER report.2 Sweden,for all the criticism that nation faced for itslax regulatory response to the virus, hasseen its rate of new cases drop to the samelevel as the EU overall in recent months –https://www.nber.org/papers/w27432.pdf12
2020 INLAND EMPIRE ECONOMIC FORECASTUCR Center for Economic Forecasting & Developmentand without any closures. Japan has beenthe wonder story. Despite of being the thirdnation in the world to identify the presence ofCOVID-19, it still has fewer than 500 cases permillion people compared to the United States’16,000. Governments need to worry lessabout regulating businesses and more aboutregulating people.aid package and tossing around numbers ashigh as the first – 3 trillion or more. While thiswill supercharge the economy, it also suggeststhat the government will be borrowing 4.5 to 7.5 trillion dollars this year—18% to 33% ofnational GDP. Never has the U.S. governmentborrowed so much in either absolute orrelative terms. To put this in context, theoverall U.S. economy has been adding 3 to 4trillion in total public and private debt per yearover the last few years.The rebound in the economy will continuebut the speed of the recovery is completelycontingent on controlling the spread of thevirus. On the current trajectory, expect U.S.unemployment to fall to 7% or lower by year’send and the nation’s economy to be almostfully recovered in 2021. If there is anothersurge, however, that date may have to bepushed back yet again.In June alone the Federal governmentborrowed more money than it had in all of2019. During the worst year of the GreatRecession, the U.S. government borrowedslightly over 1.3 trillion, and that wasenough to set off the backlash that came tobe known as the Tea Party. Amazingly, theredoesn’t appear to be a single person left inWashington who is worried about the currentpace of borrowing. We seem to have allowedthe ‘miserabilism’ of our times to make usforget that this money will have to be paidThe second concern is the U.S. government’s‘over’ stimulus. Despite clear resilience in theeconomy and pent up demand that is readyto spring once the virus is under control,amazingly, Congress is discussing a second13
2020 INLAND EMPIRE ECONOMIC FORECASTUCR Center for Economic Forecasting & Developmentback by our children and grandchildren—asthey struggle to cope with the ever-rising costof entitlements for Baby Boomers who areretiring in droves.the decline in private sector debt kept moneysupply growth in check. In fact, the FederalReserve had to keep rates near zero just tokeep the money supply growing. This is whyrates were so low in the years following therecession. But not this time.This borrowing will have consequences.Right now, there is little issue with raisingthe funds—between record deposits in thebanking system and aggressive quantitativeeasing by the Federal Reserve, there isplenty of loose cash in the system. But whathappens when the virus is fully controlledand the population rushes to catch up on life?Spending will jump, the money supply willexpand rapidly, and the Federal governmentwill be sucking up liquidity in every direction.This a recipe for accelerating inflation andrising interest rates.If the Federal Reserve fails to aggressively backoff on quantitative easing, the sharp increasein velocity will cause inflation to heat up, whichwill put even more pressure on interest rates.All of this sounds a lot like what happened inthe late 1970’s, the era of stagflation, when thenation’s fundamental economic growth sloweddue to the start of deindustrialization andexcessive monetary growth caused inflationto accelerate to the worst pace ever seen inthe modern U.S. economy. The next (future)hit to the economy could end up lookingvery much like what happened in the early1980s when Paul Volker put the hard stop oninflation, which was good for the long haul butin the short run caused the United States toexperience a deep recession.Moreover, it will be a completely differentcircumstance from what happened after theGreat Recession. The collapse in wealth at thattime kept spending in check as householdsworked to rebuild their balance sheets. And14
2020 INLAND EMPIRE ECONOMIC FORECASTUCR Center for Economic Forecasting & Development15
2020 INLAND EMPIRE ECONOMIC FORECASTUCR Center for Economic Forecasting & DevelopmentCalifornia OutlookTaner Osman PhDOn Friday August 28th, approximately six weeks after the state orderedmany indoor businesses to reclose, Governor Gavin Newsom unveiledCalifornia’s second attempt at a comprehensive plan to reopen. TheGovernor’s framework sorts each of the state’s 58 counties into a tier, whichdetermine the extent to which business activity in each county can resume.The new system is based largely on new daily case numbers per 100,000residents, as well as positivity rates.There are now four color-coded tiers, ranging from most restrictive to least:purple, red, orange and yellow. Each county has been assigned a tier and muststay in that tier for at least three weeks before it can move to another. If acounty’s numbers worsen for two weeks in a row, it will be moved to a morerestrictive tier. For the vast majority of Californians, not much will changeimmediately. The most restrictive tier, purple, applies to 38 counties, includingLos Angeles and Orange, home to more than 80% of the state’s population. Inthese counties, many businesses must remain closed, unless they can operateoutdoors, including restaurants.16
2020 INLAND EMPIRE ECONOMIC FORECASTUCR Center for Economic Forecasting & Development1400012000New Cases by Day10000800060004000200001/27/203/27/205/27/20New Confirmed Cases7/27/20New Cases 7-Day MANEW COVID-19 CASESCALIFORNIASource: Los Angeles Times; Analysis by UCR Center for Economic ForecastingThe Coronavirus in CaliforniaIn August 2020, California hit some unwelcomemilestones. More than 700,000 people havetested positive for COVID-19 in the state, andnearly 13,000 residents have died as a resultof the virus. On a per capita basis, at nearly18,000 cases per million residents, the statehas seen fewer cases than the national averageof nearly 19,000 residents per million. Thenumber of virus-related deaths in the state hasbeen much lower than the national average,with over 300 deaths reported per millionresidents compared to nearly 600 nationally.The number of new cases in the state hasstarted to fall. As of August 27th, the averagenumber of new cases over the previous 7 daysstood at around 6,000, compared to a peakof more than 9,600 cases for the previous 7days on July 25th (the peak). There has beena significant drop in the number of COVID-19related hospitalizations in California, fallingfrom a peak of nearly 9,000 patients at the endof July to just over 4,000 as of the August 27th.17
2020 INLAND EMPIRE ECONOMIC FORECASTUCR Center for Economic Forecasting & 03/24/204/24/205/24/206/24/207/24/208/24/20GOOGLE MOBILITY DATA: TIME SPENT AWAY FROM HOMECALIFORNIASource: Google/Opportunity Insights; Analysis by UCR Center for Economic ForecastingBeyond important public health concerns,containing the spread of virus is critical forthe state since the economic recovery thathas been underway since April has slowedfollowing the resurgence in new cases.Consider mobility data provided by Google.The chart below measures the amount of timepeople spend at home – in other words it’s ameasure of time spent away from workplacesand recreational activities. These data revealthat, as the number of new COVID-19 cases inthe state intensified in the middle of June, therecovery in mobility that occurred followingthe initial outbreak of cases, stalled. From June18th to August 21st, the level of mobility inCalifornia was flat.Given that the most populous counties in thestate will remain under the most restrictive tierof re-opening until the middle of September,the level of activity statewide is likely toremain similarly constrained until this time.This represents three months in which therecovery will have stalled, and that will haveconsequences. For cities that rely heavily on thetransient occupancy tax (TOT) as a source ofincome, the peak travel season has come andgone. In the cities of Anaheim, Avalon, Carmel,Monterey, Pismo Beach, and Palm Springs,more than 25% of their revenue comes fromthe TOT. This loss of revenue will cause realhardship for these, and many other, cities.18
2020 INLAND EMPIRE ECONOMIC FORECASTUCR Center for Economic Forecasting & DevelopmentThe Labor Market RecoveryCalifornia’s labor market continued to recoverfrom the effects of the COVID-19 pandemicin July, with total nonfarm employment in thestate expanding by 140,400 positions. The rateof job growth slowed compared to June, when558,200 total nonfarm positions were addedby the state’s employers. The slowing rate ofjob growth is in large part due to the reactionto the resurging spread of the virus throughoutJune and July, leading the state governmentto reimplement certain business closures andconstraints on business activity in the secondhalf of July. The hope is that job gains willaccelerate later in the year, once the virus isbetter contained, but given that the spread ofthe virus has continued into August, and thatrestraints on business activity have remainedin place, it’s likely August will look more like Julythan June. A strong but not “blow-out” monthof job gains.annual declines on record. In July, there wereover 1.6 million fewer people employed inthe state than in July 2019. California hascontinued to perform slightly worse than thenation, where nonfarm employment declinedby 7.5% over the same period. This is in largemeasure due to the more aggressive stancetaken by state leaders to contain the spread ofthe virus than in other locations.From July 2019 to July 2020, 1.7 million workerswere added to the state’s unemploymentranks. California’s unemployment rate declinedto 13.3% in July, a 1.6-percentage-pointdecline relative to June, but a far cry from the4.0% rate enjoyed one year ago. However, asmall majority of those who have joined theunemployment rolls still report the nature oftheir unemployment as temporary. However,the number of people who identify as beingtemporarily unemployed has been shrinkingin recent months, a worrisome sign that manylayoffs in the state are turning permanent.Despite the nascent labor market recovery,year-over-year employment growth inCalifornia stands at -9.4%, one of largest19
2020 INLAND EMPIRE ECONOMIC FORECASTUCR Center for Economic Forecasting & Development8070Share Reporting Temporary Jan-150SHARE OF UNEMPLOYED WHO REPORT BEING ON TEMPORARY LAYOFFCALIFORNIASou
Riverside County Business & Community Services. PROUD SPONSOR OF THE 2020 UCR ECONOMIC FORECAST CONFERENCE. WWW.RIVCOBIZ.ORG. riverside county business & community services is ready to help companies participate in the remarkable opp