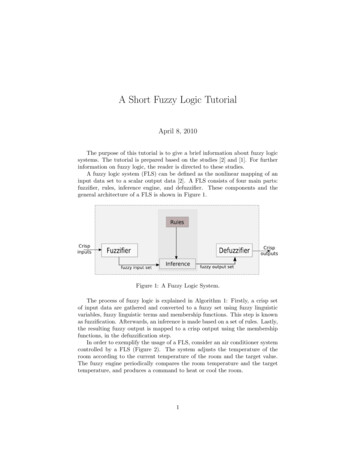
Transcription
International Journal of Computer Applications (0975 – 8887)Volume 103 – No.3, October 2014Sugeno-Type Fuzzy Inference Model forStock Price PredictionUduak A. UmohAlfred A. UdosenDepartment of Computer Science, University ofUyo, Akwa Ibom State, NigeriaDepartment of Computer Science, University ofUyo, Akwa Ibom State, NigeriaABSTRACTThe operations of the prediction of stock price are complexand risky due to fluctuation in the stock market because of thevagueness, incompleteness, and uncertainty of the informationused. However, it is therefore as a matter of necessity to seekto foresee stock prices because traders need to know when toinvest in order to get the maximum return of the investment.This paper proposes a Sugeno-type fuzzy inference system forstock price prediction using technical indicators as its inputvalues. Knowledge Base, Fuzzification, Inference Engine andDefuzzification are the essential components of our model.We explore Sugeno-type fuzzy inference engine to optimizethe estimated result. We evaluate the degree of participationof each input parameter with Trapezoidal membershipfunction. Center of Gravity technique is employed fordefuzzification. We employ object oriented design tool tomodel our database. MATLAB and fuzzy relational databaseare used in the implementation of our study. The developmentof this system is based on the selection of stock data historywhich are studied and used for training the system. Thissystem provides vital support to stock traders, researchers andother financial experts in making decisions as regards stocktrading.General TermsSoft Computing, Artificial Intelligence, Fuzzy Logic Model,Database management System, Stock Market.Key WordsFuzzy Logic, Stock Price, Technical indicators, Trapezoidalmembership function, Object Oriented Tool.1. INTRODUCTIONThe operations of the prediction of stock price are complexand risky due to fluctuation in the stock market because of thevagueness, incompleteness, and uncertainty of the informationused. Stock trading is the process of buying and selling ofstocks based on known signals which can be predicted basedon past stock data. Stock price prediction involves the stepstaken to determine the future value of a company’s stocktraded on a financial exchange; making business moreprofitable as well as making reasonable recommendations asregards stock trading. The accurate predictions of stock priceare important for many reasons, chief among these are theneed for the investors to hedge against potential market riskand to make profit by trading indexes [1]. Stock is therepresentation of the ownership in the share of profit, assets,and losses of a company; it is created when a business carvesitself into pieces of units called shares and sells them toinvestors in exchange for cash and stock price is the cost ofpurchasing or selling a security on an exchange. Predictingstock price has over time been a subject of interest for manyfinancial investors and professional analysts because findingout the appropriate time to sell or buy stock has been a verydifficult task as there are too many unknown factors ofuncertainty and volatility that have direct influence on stockprices [2] [3].The prediction of stock price is a highly complicated and verydifficult task because there are too many factors such asinflation, short term interest rate, political events, traders’expectations, and environmental factors amongst others thatalso affect stock price. In addition, stock price series aregenerally quite noisy, dynamic, nonlinear, complicated,nonparametric, and chaotic by nature [4]. However, theintroduction of technology and digital computerization instock price prediction has paved the way for financial supportsystems to be developed to make prediction easy. Theutilization of intelligent systems such as neural networks,fuzzy logic and genetic algorithms for the purpose ofprediction in the field of finance has extensive applications[5]. Several technical indicators are being used in stock priceprediction with varying results, they include: AccumulationDistribution Line, Force Index, Money Flow Index, AverageTrue Range, Percentage Price Oscillator, Record HighPercentage and Ease of Movement amongst others. Fuzzylogic, artificial neural network, belief calculus, and geneticalgorithms amongst others are part of a branch of ArtificialIntelligence called soft computing that is essentially used toexploit the tolerance for imprecision, uncertainty, and partialtruth in order to achieve tractability, robustness, and lowsolution cost. [6] defines fuzzy logic as a set of mathematicalprinciples based on degrees of membership rather thanclassical binary logic that is used for knowledgerepresentation.This paper proposes Sugeno-type adaptive fuzzy inferencesystem that uses the results of some technical indicators asinputs in combination with the firing strengths of fuzzy rulesto make future predictions that can generate buy (low) and sell(high) signals in order to achieve maximum profit. Wedevelop our model using stock data history which is studiedand the results computed in the range of predefined limit by adomain expert. We employ MATLAB toolbox and Javaprogramming language and fuzzy relational database toimplement our model. The model provides vital support tostock traders, researchers and other financial experts inmaking decisions as regards stock trading.Section II presents literature review of the prediction systemand the inherent concepts. Section III discusses the analysis ofthe proposed system IV discusses the design of the modelwhile section V presents the system implementation. SectionVI gives a brief conclusion.1
International Journal of Computer Applications (0975 – 8887)Volume 103 – No.3, October 20142. LITERATURE REVIEW[7] develop a Takagi–Sugeno–Kang-type fuzzy rule-basedsystem for forecasting Taiwan Stock Exchange pricedeviation. This model successfully forecasts stock pricevariation with accuracy close to 97.6% in TSE index and98.08% in MediaTek. [8] develop a hierarchical fuzzy logicsystem using genetic algorithm to predict the interest rates inAustralia. Using a genetic algorithm as a training method forlearning the fuzzy rules, the number of rules could be reducedsignificantly, resulting in more efficient systems. [9] follows asimilar approach with a fuzzy inference system, but with otherindicators to predict the stock market. The results combiningtechnical analysis and fuzzy logic were very promising. [10]describes a fuzzy based trading system to predict market pricemovements for investing in portfolio of European, Americanand Japanese bonds and currency. The system generates a buyor sell signal, but it can also be combined with portfolioallocation mechanisms for automated trading. [11] investigatethe current trend of stock price of the Iran KhodroCorporation at Tehran Stock Exchange by utilizing anadaptive fuzzy- neural inference system.[12] investigate performance analysis of stock price predictionusing artificial neural network. The models are used to predictthe future stock prices and their performance statisticsevaluated. This helps the investor to analyze better in businessdecisions such as buy or sell a stock. [13], proposes a fuzzyengine model that acts as an expert indicator that can generatebuy and sell signals. The fuzzy engine model combines themost popular technical indicators with their firing strengths toprovide a new fuzzy indicator that achieves good resultscompared to the other traditional indicators. Experiments areconducted to evaluate the performance of the model and theresults prove that the fuzzy engine model gives more reliablebuy and sell positions in different time horizons compared toother technical indicators. [14] examine type-2 fuzzy rulebased expert system for stock price analysis. The proposedtype-2 fuzzy model applies the technical and fundamentalindices as the input variables. The model is tested on stockprice prediction of an automotive manufactory in Asia withencouraging results. [15] introduce an intelligent decisionmaking model, based on the application of Fuzzy Logic andNeurofuzzy system (NFs) technology that decide a tradingstrategy for each day and produce a high profit for each stock.The model is used to capture the knowledge in technicalindicators for making decisions such as buy, hold and sell andthe experimental results shows higher profits. [16] studyfuzzy stock prediction system that integrates the novelcomputer technologies of stepwise regression analysis (SRA),auto-clustering analysis, recursive least-squares (RLS) andparticle swarm optimization (PSO) learning schemes. [17]investigate fuzzy wavelet neural networks for prediction ofstock prices. The paper is constructed on the base of a set ofTSK fuzzy rules that includes a wavelet function in theconsequent part of each rules and train with differentialevaluation (DE) algorithm.[18] Study stock trend prediction system based on ArtificialNeural Network (ANN) and fuzzy logic rules using technicalindicators and Elliott’s wave theory. In this approach theneural network functions as a classifier, where the technicalanalysis indicators are its input features. The multilayerperceptron (MLP), Support Vector Machine (SVM) andRadial Bases Function (RBF) are tested as classification tools.[19] carry out a probe in a sample of the whole population ofthe study involves the data and financial record of SAIPAauto-making company which is a member of Iranian stock, forprediction of stock price. The prediction is done using linearand nonlinear models for one ahead and multi ahead in stockprice by using exogenous variable of stock market cash index,and the results show the preference of nonlinear neural-Fuzzymodel to classic linear model and verify the capabilities ofFuzzy-neural networks in this prediction. [20] investigateanalysis on Stock Market Prediction using Data MiningTechniques for evaluation of past stock prices. [21] examinethe capability of an ANFIS algorithm to accurately predictingstock market return of the Istanbul Stock Exchange (ISE). Thestudy use six macroeconomic variables and three indices asinput variables. The experimental results reveal that the modelsuccessfully forecasts the monthly return of ISE National 100Index with an accuracy rate of 98.3%. ANFIS provides apromising alternative for stock market prediction. [22] studyfuzzy rule-based framework for effective control ofprofitability in a paper recycling plant. [23] present fuzzyneural network model for effective control of profitability in apaper recycling plant. [24] study fuzzy-neural networksapproach to model the prediction of stock price. Theinvestigation of neural networks and AutoregressiveIntegrated Moving Average (ARIMA) models of price data inthis research showed unique properties of high precision,quick convergence, strong ability of function approximation,and in operation criteria they showed noticeable superiority inprediction. A fuzzy-neural system to predict financial timeseries is described by [25]. The prediction of stock and optionprices of the S&P and Dow Jones indices is examined, whichresults in profitable trading strategies.3. ANALYSISThe historical stock data for this project is obtained from theNigerian Stock Exchange, Uyo which is located at UdoUdoma Avenue, Uyo, Akwa Ibom State. Established in 1960as the Lagos Stock Exchange, it became known as TheNigerian Stock Exchange in December 1977 with abouttwelve branches having an electronic trading floor each forreal-time stock trading through a network of computersconnected to a server. The main concern of Nigerian StockExchange is to determine the appropriate time to buy, hold orsell stocks. System analysis involves the systematic study ofthe structure of an adaptive fuzzy neural system model for theprediction of the trends in stock prices. The data collectionmethod, analysis of case study will be explained as well as thearchitecture of the system design. For this project, stock datahistory for one year was gathered from interviews and writtendocuments from the Nigerian Stock Exchange in Uyo, AkwaIbom State. The price lists of daily transactions contains openprices, low prices, high prices, close prices and volume whichare equated into different mathematical models calledtechnical indicators that are used for stock prediction. Thestock data history collected and used in this system was gottenfrom Zenith Bank. Stock price prediction is majorlyconcerned with the use of the history of stock prices gatheredin order to tell of its future. The data could be structured,unstructured, static, dynamic, numerical, symbolic, precise orimprecise, certain or uncertain. The system design involvessetting of standards to be duly observed during systemimplementation like variable naming, modularity, coupling,commenting issues, control issues and cohesion in theanalysis and design of the system for effective profitoptimization.2
International Journal of Computer Applications (0975 – 8887)Volume 103 – No.3, October 20144. DESIGN4.1 SFNISSPP Architecture4.2 SFNISSPP Database ModelThe conceptual architecture of our model is based on [23] andpresents in Figure 1. The conceptual architecture comprisesthe following: The Knowledge Base, Adaptive fuzzy modeland user interface.The knowledge base design of the Sugeno-type fuzzyinference system for stock price prediction comprises ofdatabase model and mathematical model. It stores both staticand dynamic information about the decision variables. Thisknowledge base is made up of facts, rules and stock pricetechnical indicators extracted from both structured andunstructured knowledge of experts in the problem domain.The structured knowledge is qualitative while unstructuredknowledge is acquired by the stock trading experts throughexperience.Figure 2 shows the database model for stock price prediction.SFNISSPP Relationship Diagram is shown in Figure Table 1shows Company Registration Table with their associatedattributes. Table 2 presents Stock Report Table.COMPANY REGISTRATION [Company name collectsCompany’s name, Open price collects stock’s open price,Low price collects stock’s close price, High price collectsstock’s high price, Close price, Volume collects stock’svolume price] where Company name is the primary key.STOCK REPORT [Technical indicators collects themathematical model for the technical indicator used,Recommendation collects the recommended action to takeeither to Buy, Hold or Sell stock, Date collects the dates of therespective transaction, Company name collects company’sname] where Technical indicators is the primary key.User InterfaceKnowledge EngineEnvironmental factors, input variables: openprices, low prices, high prices, close prices andvolume, financial experts, stock traders, bankers,etc.StructuredUnstructuredKnowledge BaseDatabase ModelAdaptive FuzzyModelMathematical ModelFig. 1: Adaptive Sugeno Fuzzy System Architecture for Stock Price PredictionSFNISSPP DatabaseCompany RegistrationCompany nameOpen priceLow priceHigh priceClose priceVolumeStock ReportTechnical indicatorsAccuracyRecommendationCompany nameFig 2 SFNISSPP Database Model for Stock Price Prediction3
International Journal of Computer Applications (0975 – 8887)Volume 103 – No.3, October 2014Table 1: Company Registration TableFieldsDateOpen priceLow priceHigh priceClose priceVolumeData ,2Table 2: Stock Report TableFieldsTechnical indicatorsDateRecommendationCompany nameData typeFloatCharCharCharStock ReportPK Technical indicatorsFK Date1 AccuracyRecommendationCompany name11Company RegistrationPK Company nameFK DateOpen priceLow priceHigh priceClose priceVolumeSize10,21005011Fig. 3: SFNISSPP Relationship Diagram4.3 Mathematical ModelTechnical indicators are used to show price actions (changesin price); they form the input parameters to the developedsystem. Stock data are collected from the Nigerian StockExchange and used for the work as shown in Table 3. Thepast values of open, low, high and close prices and thevolumes of a particular stock are recorded for a sequence ofdays and stored in database to train the system.Table 3: Stock price list from the Nigerian 011231,419,0304
International Journal of Computer Applications (0975 – 8887)Volume 103 – No.3, October 5-Jun10.5210.5110.6710.616,866,91514-Period Ease of Movement 14-Period simple erage of 1-period EMV Wed.13-Jun10.510.510.6510.614,361,4384.3.4 Trend 11.511.511.611.5194,103,055We design Trend Index (TI) model as shown in Figure 5 and(10), after a careful study of the candle sticks used inmonitoring the trends in the prices of stocks in the stockmarket as shown in Figure 5. A number greater than zeroindicates a rise in the (positive) trend and a sell of stock isencouraged, a zero indicates a state of no visible change(stagnation point), where traders are advised to halt tradingand observe the direction in which the market will follow.Finally, a number below zero shows a fall in the market(negative) trend and a buy of stock is The details of the parameters used in stock price predictionbased on [26] are modified and evaluated as follows:4.3.1 Chaikin Money FlowThis measures the amount of money flow volume over aspecific period of time, typically 20 or 21 days. The resultingindicator fluctuates above and below the zero line just like anoscillator to identify changes on money flow. It’s presentedin (1) – (3).Money Flow Multiplier (1)Money Flow Volume(2)20-period Chaikin Money Flow, CMF (3)4.3.2Force IndexForce Index is an indicator that uses price and volume toassess the power behind a move or identity possible turningpoints and is calculated in (4)-(5).FI(4)13-Period FI (5)4.3.3 Ease of Movement (EMV)The ease of movement (EMV) is a technical indicator thatconverts the information of the equivolume chart into anumerical equivalent. The calculation is shown in (6)-(9).Distance Moved(6)Box Ratio1-Period EMV Distance Moved/ Box Ratio(7)(8)(9)5
International Journal of Computer Applications (0975 – 8887)Volume 103 – No.3, October 2014The fuzzy linguistics variables are defined on each inputparameter as follows:HighCloseEase of Movement, EMV {LOW, MEDIUM, HIGH}Force Index, FI {LOW, MEDIUM, HIGH}Chaikin Money Flow, CMF {LOW, MEDIUM, HIGH}Trend Index, TI {LOW, MEDIUM, HIGH}OpenPrice Movement {POSITIVE, NO CHANGE, NEGATIVE}LowSFNISSPP universe of discourse is selected for inputparameters as; [-1, 1] for Chaikin Money Flow, Force Index,Ease of Movement respectively, [-2, 2] for Trend Index and[0, 1] for Output parameter.Fig. 4: Stock market candle stick model14-period TI (10)Layer 1: In this layer, the crisp input values are converted tothe fuzzy values by the input MFs. In this paper, we employTrapezoidal membership functions method in (11) and areevaluated for i (3), j (1, 2, and 3), x (EMV, FI, CMF andTI) respectively in (12) – (24) as follows:Where H High, C Close, O Open, and L Low.This indicator so developed seems to yield the best of resultsin stock price prediction based on its computational analysisas compared to the other technical indicators used.5. SUGENO-FUZZY INFERENCESYSTEM MODEL FOR STOCK PRICEPREDICTIONFuzzy logic model of stock price prediction is presented inFigure 32H33L41LM42H43FuzzyLayerL(L1) 1 α1 2ᾱ1N1 Z1 r1(EMF, FI, CMF, TI)N2Z2 r2(EMF, FI, CMF, TI)ᾱ1Z1ᾱ1Z1ᾱ40 40N40ᾱ40Z40Z40 r40(EMF, FI, CMF, TI)ᾱ80 80ᾱ81Z81Z80 r80(EMF, FI, CMF, TI)N80ᾱ81 81α81Z81 r81(EMF, FI, CMF, icationProductLayerLayerLayer(L3)(L4)(L2)Fig 5: Sugeno Fuzzy Logic Model of stock price predictionFuzzification is the process of changing a real scalar (crisp)value into a fuzzy value through a membership function todetermine an output. In this paper, technical indicators, Easeof Movement (EMV), Force Index (FI), Chaikin Money Flow(CMF) and Trend Index (TI) form the input parameters usedin Fuzzy Logic Model. The fuzzy linguistics terms are definedfor both the inputs and output variables and theircorresponding membership functions are evaluated usingTrapezoidal membership function due to its computationalefficiency.PM ll0,l(x- aij)/ (bij -aij), if aij x bijµTrapijl(x) ll1,if x aijif bij x cij(11)(dij -x)/ (dij -cij), if cij x dij0,if x dijdiction6
International Journal of Computer Applications (0975 – 8887)Volume 103 – No.3, October 2014where aij , bij , cij , and dij are the premise parameters thatcharacterize the shapes of the input MFs.Ease of Movement (EMV)µMedium(x) 0µLow(x) if x -0.3560.096(x 0.356)/0.0693if -0.356 x -0.2871if -0.287 x -0.2180.267(-0.1487-x)/ 0.0693µMedium(x) if x -0.14870if x -0.147(x 0.147)/0.0693if -0.147 x -0.07771if -0.0777 x -0.0084(x-0.0509)/0.0693if 0.0509 x 0.1202if -0.1595 x -0.074if -0.074 x 0.0120if x 0.012(19)if x 0.01µHigh(x) if 0.01 x if 0.096 x 0.1811(20)(0.267-x)/ 0.086 if 0.181 x if x 0.2670Trend Index (TI)(13)0if x -0.47(x 0.47)/0.102if -0.47 x -0.368if -0.368 x -0.2661(-0.266-x)/ 0.102if -0.266 x -0.1640if x -0.164(21)if 0.1202 x 0.18951µHigh(x) 1(x-0.01)/0.086µLow(x) if x 0.0509if -0.2450 x -0.15950if x 0.06090(x 0.2450)/0.086(12)(0.0609-x)/0.0693 if -0.0084 x 0.06090if x -0.2450(-0.074-x)/ 0.086if -0.218 x0 -0.14870(0.2588-x)/0.0693 if 0.1895 x 0.25880(14)if x 0.2588µMedium(x) Force Index (FI)0if x -0.192310if x -0.15(x 0.15)/0.102if -0.15 x -0.0481if -0.048 x 0.054(0.156-x)/ 0.102if 0.054 x 0.1560if x 0.1560if x 0.146(x- 0.146)/0.102if 0.146 x 0.248(22)(x 0.19231)/0.0348 if -0.19231 x -0.1575µLow(x) if -0.1575 x -0.12281(15)(-0.088 x)/ 0.0348 if -0.1228 x -0.088µMedium(x) µHigh(x) if x -0.08800if x -0.08(x 0.08)/0.0348if -0.08 x -0.053231(0.452-x)/ 0.102if -0.05323 x -0.0185(16)if x 0.0163(x-0.015)/0.0348µHigh(x) 1if x 0.015if 0.0498 x 0.11934(17)(0.0154-x)/ 0.0348 if 0.11934 x 0.01540µLow(x) if x 0.01540(x 0.5035)/0.085if x -0.5035if -0.5035 x -0.41811if -0.4181 x -0.3326(-0.2471-x)/ 0.085if -0.0185 x -0.24710if x -0.24710 (Negative)if x -10.5 (No Change)if -1 x 0.51 (Positive)if 0.015 x 0.0498(18)if 0.35 x 0.452Price Movement (PM)µPriceMovement(x) 0(23)if x 0.4520(0.0163-x)/ 0.0348 if -0.0185 x 0.01630if 0.248 x 0.351.24)if 0.5 x 1We obtain our rule base from derivation based on the stockhistory records, expert experience and control engineers. Inthis paper, the number of MFs for the input variables EMF,FI, CMF and TI are determined as 3, 3, 3, and 3, respectively.Each possible combination of inputs and their associated MFsis represented by a rule in the rule base of the Sugeno FISmodels. So, the number of rules for FIS models is 81 (3 3 3 3 81). The application of the Sugeno FIS models to thestock price prediction calculation is given in the followingsections. From our knowledge base, 81 rules are defined forthe rule base for the decision making unit as shown in Figure12.7
International Journal of Computer Applications (0975 – 8887)Volume 103 – No.3, October 2014Fuzzy Rules1.If (EMV isL11) and (FI isL21) and (CMF isL31) and(FI isL41) then Z1 c1 (EMF, FI, CMF, FI)2.If (EMV isL11) and (FI isL21) and (CMF isL31) and(TI isM42) then Z2 c2 EMF, FI, CMF, FI)3. if (EMF isL11)and (FI isL21) and (CMF isL31) and (TI isH43) then Z3 c3EMV, FI, CMF, FI)4.If (EMV isL11) and (FI isL21) and (CMF isM32)and (TI isL41) then Z4 c4 EMF, FI, CMF, FI). . . .80.If (EMV isH13) and (FI isH23) and (CMF isM32)and (TI isM42) then Z80 c53 EMF, FI, CMF, FI)81.If (EMV isH13) and (FI isHM23) and (CMF isM32)and (TI isH43) then Z81 c81 EMV, FI, CMF, FI)6. IMPLEMENTATIONThe paper adopts Matlab /Simulink and its Fuzzy Logictool box functions to develop a computer simulation showingthe user interface and fuzzy inference to assist theexperimental decision for the best control action. From layer1, the crisp input values are converted to the fuzzy values bythe input MFs. For example, when the fuzzy inputs for EMV,FI, CMF and TI are selected at -0.1445, 0.0156, 0.29 and -0.8and their corresponding degree of membership evaluated in(29);FI 0.0156, Low 0.0, Medium 0.02, High 0.02CMF 0.29, Low 0.0, Medium 0.0, High 0.34Zk ck (EMF, FI, CMF, FI) k 1, . . . , 81Fig. 12: Fuzzy Rules for Stock price PredictionTI -0.8, Low 1.0, Medium 0.0, High 0.0Layer 2: In this layer, the weighting factor (firing strength) ofeach rule is computed. The weighting factor of each rule,which is expressed as αk, is determined by evaluating themembership expressions in the antecedent of the rule. This isaccomplished by first converting the input values to fuzzymembership values by using the input MFs in the layer 1 theMAX non-zero minimum value of each of the variables isselected and evaluated using AND function. Only the rulesthat have strength higher than 0, would “fire” the output.Hence, the weighting factors of the rules are computed asfollows:ini1(v0)i2Where ᾱi is a running point in a discrete universe, and is its membership value in the membership function. Theexpression can be interpreted as the weighted average of theelements in the support set (Guney, 2009) (Umoh, et al.,2011).EMV -0.1445, Low 0.06, Medium 0.04, High 2(x00in0(25)0Where λi is the corresponding degree of a given input whichsatisfies the condition of the ath rule and i 1, 2,., 81.(29)The above results indicate that, the degree of membership foran EMV of -0.1445 projects up to the peak function so theresult is “Low” membership 0.06, “Medium” membership 0.04 and “High” membership 0.0 in the fuzzy sets. Onlyrules associated with "Low" and “Medium” are actuallyapplied to the output response.The above resul
domain expert. We employ MATLAB toolbox and Java programming language and fuzzy relational database to implement our model. The model provides vital support to stock traders, researchers and other financial experts in making decisions as regards stock trading. Secti