Transcription
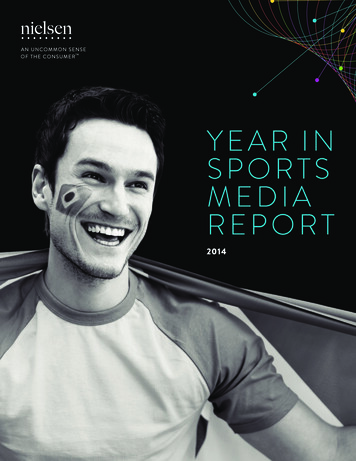
YEAR INSPORTSMEDIAREPORT2014
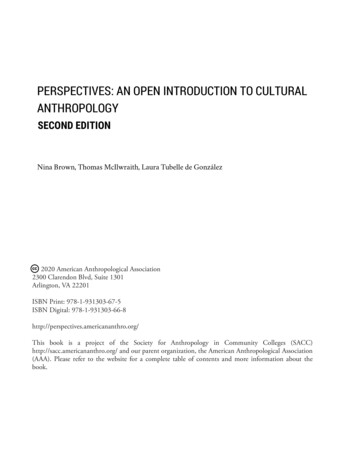
STEPHEN MASTER, SVPSPORTS, NIELSENWelcome to Nielsen’s State of the Media: 2014 Year in Sports Media Report, acompilation of media highlights, advertiser trends and consumer insights acrossleading sports properties. With the Sochi Winter Olympics kicking off the yearand one of the most exciting World Cups ever held in Brazil this summer, 2014offered fans across the world plenty of indelible memories. These big eventsand the ubiquity of mobile apps and devices throughout the world made 2014the year sports consumption on mobile truly went mainstream. The growth indigital video viewing from 2013 to 2014 was nothing short of extraordinary, andnot just among younger consumers. While the 18-34 set posted a 53% increase indigital viewing from Q2 2013 to Q2 2014, viewing grew an even more impressive80% and 60% among Americans 35-49 and 50 – 64, respectively. Fans continueto increase consumption and engage with sports content in a variety of differentways across a multitude of devices.In turn, Nielsen’s “FANALYTICS” platform is evolving alongside the rapidlychanging media consumption landscape, as we continually introduce newsolutions to help our industry understand the total audience.As you’ll see inside these pages, sports fans’ passion for their favorite athletesand teams continues to grow, as fans tuned-in to TV, computers, tablets andmobile screens to follow them.Some of the highlights that transpired in 2014 include: An average of over 112 million viewers tuned in to the first Super Bowlplayed outdoors in a northern climate making it the most watched event inTV history. While the NY weather was warmer than usual, the Seahawks Dnever allowed Peyton Manning to heat up in their romp over the Broncos.2NIELSEN YEAR IN SPORTS REPORT
Winter Olympic fans were treated to an astounding 1,539 hours of contentacross various NBC platforms, almost double the number of hours ofOlympic action they had access to at the 2010 Games in Vancouver. The success of the US and Mexico teams and favorable Brazil time zonesresulted in a record number of Americans following the World Cup thissummer. 119 million Americans tuned into World Cup action on TV acrossABC, ESPN, ESPN2, Univision, Unimás, UDN and Galavision. The Spurs avenged last year’s heartbreaking loss against the Heat by winningthe NBA title. 18 million viewers watched the Spurs’ clinching game, in whatturned out to be King James’ last game in a Heat uniform before he tookhis talents back home to Cleveland. LeBron’s marketability as an endorserhas grown stronger than ever since then; Nielsen Talent Analytics shows hisN-Score at an impressive 91, the highest of any current athlete. NASCAR crowned Kevin Harvick as a new first-time Sprint Cup champion.However, the real champion this year was the new Chase format. The highstakes unpredictability generated a strong amount of social media buzz anddrove ratings at high speed. The final race in Homestead drew 5.2 millionviewers, the most in the last 3 years. The Giants took home their third World Series title in 5 years in a thrillingseven game series over the Royals. But one of the biggest stories in baseballthis season was the farewell tour of Yankee legend, Derek Jeter. Per NielsenTalent Analytics, more than 83% of Americans know of Jeter, making him byfar the most recognizable player in MLB. College football waved goodbye to the BCS and entered a new era in 2014with the first College Football Playoff. It’s safe to say that fans thought thenew playoff format was a touchdown—the two semi-final games played onNew Year’s Day and the final game played on January 12, 2015 were the threemost watched programs in cable television history.I hope you enjoy these highlights from across Nielsen’s wealth of consumerand media insights. 2014 continued to prove that sports content, across allmedia platforms, is among the most popular and engaging genres, and is wellpositioned to thrive in an increasingly fragmented media marketplace and rapidlyevolving multi-screen world.Sincerely,Stephen MasterCopyright 2015 The Nielsen Company3
THE YEAR OFDIGITAL VIEWINGMedia content is no longer synonymous with TV. With the rise of technology, media can be consumed across a variety of devices,anytime, anywhere—at work, while commuting, outside—with just a few screen taps of one’s fingertips. Never before has it been soeasy to tune in in so many different ways. Sports fans, ever hungry for new content, have wholly embraced this newfound on-the-goconvenience.THE RISE OF TECHNOLOGYIn 2008, smartphones were a nascent technology, with only 10% penetration. By the end of 2010, however, that jumped to 30%, andcrossed 50% in Q2 12. Today, it sits at a staggering 75%, complemented by the rapid emergence of smart TVs and tablets.4SMARTPHONE30%46%60%66%75%SMART TVN/A2% (Q1 2012)4%8%13%TABLETSN/A10% (Q1 N YEAR IN SPORTS REPORT
Smartphone penetration is especially high among Asian-Americans, who are 12% more likely to own smartphones compared to theaverage US consumer. Hispanics and African-Americans are both 8% more IANAMERICANSMARTPHONES AND THE SPORTS FANThe on-the-go convenience of a smartphone is a perfect fit for the dynamic, fast-paced world of sports. A collective 72.3 millionAmericans consumed a staggering 7.1 billion minutes of sports content in October 2014 alone, and those numbers will only continueto grow. From October 2012 to 2014, the average user increased their monthly time spent on mobile sports content by 35%.AUDIENCEAVERAGEMINUTES SPENT50.9 million7361 million8372.3 million9942%35.6%TOP APPS BY TOTAL MINUTES1ESPN Sports Center2MLB At Bat3Team Stream4NFLMobile5Yahoo! Fantasy Sports – Fantasy FootballAVERAGE NUMBER OF SPORTS APPSPER PERSON1.811.82Copyright 2015 The Nielsen Company5
STREAMING AND THE SPORTS FANAmericans streaming video on the computer particularly in the sports category continues to explode as the total time the averageperson spent streaming and the number of streams they viewed continued to increase through the year. Time spent streamingpeaked in April and in July, corresponding to the NBA Playoffs, March Madness and the World Cup.# OF STREAMSPER VIEWERTIME SPENTSTREAMINGPER 9.7116.894.6( 473% fromOct 55.354.6( 35% fromOct ‘13)THE COMPUTER IS GIVING WAY TO MOBILE IN SPORTSSimilar to streaming on a computer, the total number of Americans who visit websites on their computer is dipping in favor ofmobile, and sports fans are no different. However, despite this decrease, sports fans who do still visit sports websites are spendingmore time online than ever.TIME O’S LISTENING ON RADIO?Fans’ insatiable appetite for sports spans all forms of media, including radio.Sports radio attracts 23 million weekly listeners, who tune in for an averageof 4 hours a week! Contrary to what one might expect, a full 29% of thatlistening occurs at home. Compared to the U.S. population, sportsradio listeners trend highly educated and wealthy. Over 50% earnmore than 75,000 a year, and 46% have a college degree.6NIELSEN YEAR IN SPORTS REPORT
SMARTPHONES ARE BECOMING ASESSENTIAL TO FANTASY FOOTBALLAS DRAFTING A GOOD QBAlthough traditional fantasy leagues on ESPN and Yahoo are as popular as ever, daily fantasy football sites are an emerging categoryand have seen tremendous growth over the last year. Between just DraftKings and FanDuel, the number of unique users has shotup more than 800% on mobile alone!DAILY FANTASY FOOTBALLINTERNET877,0005,129,000 485%MOBILE319,0003,022,000 847%Note: Audience numbers represent the unduplicated audience for DraftKings and FanDuel only. Mobile numbers include web content and app usage.AVID SPORTS FANS ARE SUPER CONSUMERS OF SPORTSOver 70 million people consumed sports content on either their smartphones or computer, and of that, the top 20% consumedeighty-five percent of the total sports minutes viewed in Q3 2014, and over 8 times as many minutes as the second heaviest quintile!And their appetite for sports is seemingly insatiable, as their time spent on sports continues to rise year over year.COMPOSITE VIEWING (MOBILE)COMPOSITE VIEWING (ONLINE)TIME SPENTTIME SPENTTIME SPENTTIME SPENTQ3 20135:370:43Q3 201321:4802:34Q3 20146:100:45Q3 201425:0302:50YOY GROWTH 9.6% 5.8%YOY GROWTH 14.9% 10.3%% OF TOTALSPORTSVIEWING85%8%% OF TOTALSPORTSVIEWING85%10%Copyright 2015 The Nielsen Company7
WINTER OLYMPICSRegardless of the season, the Olympics is by far one of Americans’ favorite sporting events, and 2014 showed Americans can’t getenough of it. This year, NBC offered an unprecedented amount of coverage of the Winter Olympics—1,500 hours across online,mobile apps, and television. Across all NBCUniversal platforms, the Sochi Games garnered 242.3 million media exposures, 3.5million more than the 2010 Vancouver Winter Olympic Games. Engagement with the games was most palpable after T.J. Oshiehanded the U.S. a hard-fought win against Russia with an unprecedented 4 shoot out goals. The thrilling win set Twitter alight—over18,000 tweets sent in one minute! In the days following his epic performance, Oshie’s Twitter followers almost doubled.TOTAL CROSS-PLATFORM HOURS OF PROGRAMMINGHours ofProgramming416-8351539 269.9%TIMELINE OF OLYMPICS AVERAGE TV VIEWERSHIP TIMELINE FOR 2014AUDIENCE IN MILLIONS25.1 MSAGE KOTSENBURG WINS 1ST GOLD MEDALOF OLYMPICS, MEN’S SLOPESTYLEFeb 8NBCCLOSING CEREMONYFeb 23NBC23.7 MTED LIGETY WINS GOLD MEDAL MERYL DAVIS AND CHARLIE WHITEIN GIANT SLALOMFeb 11OPENING CEREMONYGOLD MEDALNBCFeb 7Feb 17NBCNBCFEB 28FEB 1FIGURE SKATING TEAM EVENTFeb 9NBC8ADELINA SOTNIVOKA BEATS YUNA KIM INFIGURE SKATINGFeb 20NBCNIELSEN YEAR IN SPORTS REPORT
THE OLYMPICS ON TVFrom start to end, the Olympics commanded Americans’ attention on TV, for all 18 nights, it ranked as the No. 1 show of primetime.Overall, the games averaged 21.4 million viewers during primetime, an increase of 5.6% from Torino, the last European WinterGames.REACH AND AVERAGE AUDIENCEReach (P2 )184M190M178M-3.3%Average PrimetimeAudience (P2 )20.2M24.4M21.4M 5.6%THE OLYMPICS ON DIGITAL PLATFORMSIn the age of smartphones and the Internet, viewers consume media however and whenever they want, wherever they go, andSochi demonstrated this growing cross-platform trend more than ever. Per Adobe Analytics, total hours watched on NBC’s digitalplatforms more than tripled from Vancouver. Unique viewers grew from 17 million to 62 million.REACH AND UNIQUE AUDIENCEHours Consumed3.5 million10.8 million 208%Unique Visitors17 million62 million 264.7%A Nielsen study of five national ad campaigns that ran heavilyacross platforms showed that much of this digital growthwas driven by the younger generation. Millennials made up44 percent of the mobile audience for these five campaigns,compared to just 18 percent of the TV audience.% OF AUDIENCE BETWEENAGES 18-3418%44%HOCKEY’S STREAMING HAT TRICKPrior to Sochi, the most streamed Olympic event was the 2012 London Games’ U.S.-Japan women’ssoccer final, with 683,000 unique viewers. Thanks to hockey, Sochi smashed this record not just one,but three times over 3 consecutive days!PRIOR RECORDU.S. Japan women’ssoccer final 2012 LondonMEN’S QUARTERFINALU.S. - CzechFeb 19WOMEN’S SEMIFINALU.S. - CanadaFeb 20MEN’S HOCKEYSEMIFINALU.S. - CanadaFeb 21683,000798,0001.16 M2.12 MviewersCopyright 2015 The Nielsen Companyviewersviewersviewers9
WORLD CUPSoccer—or football, as the rest of the world knows it—is easily the world’s most popular sport, and as such, the World Cup is oneof the most internationally anticipated sports events. If this year is any indication, Americans are (finally) starting to get in on theWorld Cup craze. From June 12th to July 13th a record 119 million Americans, or 40.4% of the US population, watched at least sixminutes of the World Cup this year—an increase of 32.2% from 2006, much of which was driven by women.The semi-final match-up of Germany and Brazil was the third most tweeted sporting event in the US after the Super Bowl andNBA Finals.TIMELINE OF TOURNAMENT HIGHLIGHTSSPANISH LANGUAGE AUDIENCE (In Millions)ENGLISH LANGUAGE AUDIENCE (In Millions)4.9M 11.1M5.1M3.4M 10.8M15.9M16.5M5.4M 6.8M21.6M14.2M12.3MTotal AudienceTotal AudienceTotal AudienceTotal AudienceGROUP MATCHESGhana vs. United StatesJune 16ESPN / UNIVISION / UDNGROUP MATCHES:United States vs. GermanyJune 26ESPN / UNIVISION / UDNROUND OF 16:United States vs. BelgiumJuly 1ESPN / UNIVISION / UDNSEMI-FINAL:Netherlands vs. ArgentinaJuly 9ESPN / UNIVISION / UDNJULY 1JUNE 156.6M 18.2M24.8M10.4M 6.6M17MJULY 155.8M 6.6M12.5M9.2M 17.4M26.6MTotal AudienceTotal AudienceTotal AudienceTotal AudienceGROUP MATCHESUnited States vs. PortugalJune 22ESPN / UNIVISION / UDNROUND OF 16:Mexico vs. NetherlandsJune 29ESPN / UNIVISION / UDNSEMI-FINAL:Germany vs. BrazilJuly 8ESPN / UNIVISION / UDNFINAL:Germany vs. ArgentinaJuly 13ESPN / UNIVISION / UDNTOTAL REACHPersons 2 Reach90.1 million105.2 million119.1 million32.2%Males 2 Reach51.9 million38.2 million60.7 million64.8 million24.9%44.5 million54.3 million42.2%Females 2 Reach10NIELSEN YEAR IN SPORTS REPORT
THE WORLD CUP ON TVWhile some of the World Cup’s growing popularity is due in part to the burgeoning Hispanic population, much of the growth in reachis also coming from non-Hispanics of all races.TOTAL REACHNon-Hispanic White50.2 million57.2 million65.4 million30.3%Hispanic25.1 million8 million30.4 million34.4 million36.9%9.8 million10.3 million29.5%*Asian households werenot measured in 20066.2 million7.8 million24.2% (‘10-’14 growth)Non-Hispanic BlackNon-Hispanic AsianENGAGEMENT OF HISPANIC VS. NON-HISPANIC VIEWERAlthough a record number of nonHispanics tuned into this World Cup,Hispanics still remained the mostengaged viewers. Hispanic women, forinstance, watched even more than nonHispanic males! The Hispanic audiencetrended much more gender equal andmuch younger.Among Hispanicsviewers, 46% were under age 35, and 42%were women; by comparison, amongnon-Hispanic viewers, 39% were under 35and 34% were women.AVERAGE MINUTES WATCHEDTOP 5 ADVERTISERS1,048Hispanic Male502Non-Hispanic MaleHispanic Female814Non-Hispanic chHyundai3T-MobileKia4Coca-ColaPepsiCo5Verizon English SpanishTHE WORLD CUP ON OTHER PLATFORMSMOBILE AND STREAMINGON UNIVISIONMOBILE AND STREAMINGON WATCHESPNWorld Cup live streams73M 316%Hours spentstreaming matches29M 187%Unique live stream viewers10M 241%Unique visitors to the CopaMundial site and app section28MN/ADeportes app downloadsduring World Cup3.5M 295% compared tofull year 2013Copyright 2015 The Nielsen CompanyUnique Devicesstreamed content15 MN/AAverage Uniqueviewers per live game892,000 174%Average Total Minutesper live game41 M 173%Hours spent streaminglive games43.6 M 224%11
NFLNATIONAL FOOTBALL LEAGUEDespite a lot of early season challenges related to off-the-field incidents, viewership in 2014 remained steady particularly amongfemale fans. The resurgence of America’s Team, the Dallas Cowboys, helped drive huge audiences whenever they were featurednationally. Locally, the team’s ratings were up almost 10% from 2013.Russell Wilson not only helped lead the Seahawks to their first Super Bowl title, he has emerged as a rising superstar from amarketing perspective. According to Nielsen Talent Analytics, although his N-Score still trails Tom Brady, Aaron Rodgers andPeyton Manning due to his lower level of awareness, Wilson’s likability is off the charts and is the highest among all active NFLquarterbacks.TIMELINE OF SEASON HIGHLIGHTSAVERAGE # OF TV VIEWERS# OF TWEETS112.2 M27.6 M2.5 MAFC WILDCARDKansas City vs.IndianapolisJan 4NBC47.1 MNFC WILDCARDSan Francisco vs.Green BayJan 5FOXJAN ‘1451.3 M1.4 M1.4MSUPER BOWLDenvervs. SeattleFeb 2FOXFEB25.3 M55.9 M32 M27.1 MTHANKSGIVINGCLASSICPhiladelphiavs. DallasNov 27FOXTHURSDAY NIGHTKICKOFFSeattle vs.Green BaySept 4NBCAFCCHAMPIONSHIPNew Englandvs. DenverJan 19CBSNFC CHAMPIONSHIPSan Franciscovs. SeattleJan 19FOX915,000MARSEPT948,000OCTNOVDECJAN ‘15THANKSGIVINGCLASSIC REACH P2 Nov 27CBS, NBC, FOX92.1 M5MPeople in the U.S. who Tweet about NFL games are 22% more likely to Tweet about the Pharmaceutical brands thanthey are to Tweet about brands in general. (9/5/2013 – 12/29/2013)12NIELSEN YEAR IN SPORTS REPORT
WILL KATY PERRY SCORE A TOUCHDOWNAT THE 2015 SUPER BOWL?The Super Bowl isn’t just a sporting event—it’s a pop culture event as well, with the half-time performance as eagerly anticipatedas the game itself. But does the honor of performing translate to better sales? It’s been hot, then cold, yes and then no for artistsover the years. Beyonce and Bruno Mars saw their most recent album sales skyrocket, but the Who, in their prime a generation ago,did �03ArtistAlbumMonth SalesPost-Month Sales% ChangeBruno Mars"Unorthodox Jukebox"77,000171,000123.0%BeyonceDestiny's Child"4""Destiny "Hard Candy"48855012.7%The Black Eyed Peas"The Beginning"65,00078,00020.1%The Who"Endless Wire"339270-20.4%Bruce Springsteen"Working On A Dream"224,000102,000-54.6%Tom Petty & The Heartbreakers"Highway Companion"2,0005,000110.3%Janet Jackson“All For You”3,0006,000127.6%Note: “Working on a Dream” was released on January 27th, 2009. Therefore, sales numbers reflect the preceding and following week of the Super Bowl.LOCAL MARKET INSIGHTS: Fueled in part by their Super Bowl run in the 2013 season, the Seattle Seahawks’ fan followingin the Seattle market is 71%, increasing by 27% since last year. That’s the largest growth forany local market NFL fan base in ten years. Since 2000, twelve professional sports franchises have cracked 75% or more of their homelocal market. Eight of those twelve franchises play in the National Football League. In themost recent wave of Scarborough data, twenty-four out of 32 NFL franchises (75%) garner atleast 50% of their home local market as fans. In comparison, only 14 out of 29 (48%)MLB franchises, 4 out of 23 (17%) NHL franchises, and 3 out of 29 (10%) NBA franchisesbased in the US can claim 50% of their home local market as fans.TOP NFL ADVERTISERS1Bud Light2Chevy Silverado3Verizon Wireless4McDonald’s5State Farm InsuranceCopyright 2015 The Nielsen CompanyFAN INSIGHTSCompared to the average US adult, avid NFL fans are:27%47%17%more likely to have spent more than 100 on fine jewelryin the past 12 monthsmore likely to have drunk beer in the past 7 daysmore likely to plan on buying furniture in the next 12 months13
NBANATIONAL BASKETBALL ASSOCIATIONAfter a record-long set of playoff games, Miami Heat and the San Antonio Spurs emerged victorious from their respective conferencesfor a rematch at the Finals. Having lost to Miami last year, the Spurs more than avenged themselves. Their win in the final gamegarnered 18 million viewers, roughly 11% more than last year’s fifth game.LeBron James’s second “Decision”—albeit this time not televised—to leave Miami Heat for the Cleveland Cavaliers made majorheadlines in July. Cleveland viewers were happy to welcome their prodigal son back, with local ratings up over 140% throughDecember compared to 2013. The two teams’ first highly-anticipated match-up achieved a 15.2 and 17.2 rating in Cleveland andMiami, respectively.TIMELINE OF SEASON HIGHLIGHTSAVERAGE # OF TV VIEWERS# OF TWEETS7.2 M15.6 MEASTERN CONFERENCE FINALSIndiana /Miami(6 telecasts)May 18-30ABC, ESPN7.5 MNBA FINALSSan Antonio/ MiamiJune 5-15(5 telecasts)ABC6.8 MNBA ALL-STAR GAMENew OrleansFeb 16TNTFEB28 MMARWESTERN CONFERENCE FINALSSan Antonio /Oklahoma City(6 telecasts)May 19-31TNTMAY3.5 MNBA DRAFTJune 26ESPNJUNEJUL3.7 M2.3 M16.6 M5.9 MNBA CHRISTMAS DAYTOTAL REACHDec 25(5 telecasts)ABC, ESPN, TNT2.6 MDECNBA CHRISTMAS DAYMiami/ClevelandDec 25ABC9.3 M462,000People in the U.S. who Tweet about NBA games are 23% more likely to Tweet about the Wireless Networks categorythan they are to Tweet about brands in general. (10/29/2013 – 4/16/2014)14NIELSEN YEAR IN SPORTS REPORT
THE NBA’sMULTICULTURALAUDIENCELOCAL MARKET INSIGHTS:NBA has one of the most culturally and racially diverse followingof all the sports. African-Americans and Asian-Americans fansspend the most time watching, followed by Hispanics. Whileall fans have spent more time watching the NBA over the pastdecade, the jump in African-American viewership has beenastounding — a 63% increase! Despite the NBA’s younger overallaudience, the increase in the amount of time spent watchingwas actually driven most by older age groups for Hispanics andAfrican-Americans.‘03/’04 averageminutes viewed‘13/’14 averageminutes viewedGrowth‘03/’04 averageminutes spanic34139014.4%White25529013.7%Race/Ethnicity(P2 )With 43% of its audience under 35, the NBA has one of theyoungest fanbases of all sports. While white viewers still watchthe least on average in the 18 – 34 demographic, they’re quicklycatching up with Hispanic viewers.‘03/’04 averageminutes viewed‘13/’14 averageminutes viewedGrowth‘03/’04 averageminutes viewedBlacks 18-3456888456%Hispanics 18-3440345613%Whites 18-3427539243%TOP NBA ADVERTISERS1State Farm Insurance2Sprint Wireless3Taco Bell4Kia Motors5Samsung Galaxy S5Copyright 2015 The Nielsen CompanySince 2009, the Clippers’fan following has increased by anASTOUNDING 61%“*2010-2011 viewership. Asian households were not measured prior to 2010.Race/Ethnicity(P2 ) What kind of impact can one player have upon a team’sfan following? Prior to LeBron James’s rookie season inCleveland, the Cavaliers’ fan following was 24% of Ohio’slargest media market. By the time “The King” took histalents to South Beach, the Cavs’ fan following had surgedto 58% of Cleveland, an increase of 142% in seven years.In Miami, the Heat’s fan following stood at 34% priorto LeBron’s arrival, but by the time he departed SouthBeach at the end of the 2013-2014 season, the Heat’s fanfollowing had swelled to 54% of the Miami market – anincrease of 58% in the space of four years. With one of the NBA’s most exciting young rosters, theLos Angeles Clippers have seen thelargest percentage increase in theirhome local market in the past fiveyears. Since 2009, the Clippers’fan following has increased by anastounding 61%, making up21% of the L.A. market. Inthe same time frame, theLos Angeles Lakers’ fanfollowing has declined by23%, bringing them downto 32% of the L.A. market.FAN INSIGHTSCompared to the average US adult, avid NBA fans are:45%30%53%more likely to have eaten at a fast food restaurant 10 times in the past 30 daysmore likely to have rented a car in the past 12 monthsmore likely to have spent more than 100 in athletic shoesin the past 12 months15
MLBMAJOR LEAGUE BASEBALLThe MLB may no longer be the “national” past-time from a TV audience perspective, but it is, however, stronger than everamong local markets. 11 out of the 30 MLB teams claimed title as the highest-rated, most-watched local programming duringprimetime for both broadcast and cable during the 2014 season. Another 6 ranked within the top 3 in local primetime withintheir respective networks.New Yorkers bid Derek Jeter, who announced his retirement in spring, a heartfelt farewell in his last ever game on YESNetwork. A record 1.99 million viewers in the New York DMA (10.8 HH) tuned into his final game, making it YES Network’smost viewed telecast ever.TIMELINE OF SEASON HIGHLIGHTSAVERAGE # OF TV VIEWERS4.5 M# OF TWEETS5.4 M11.4 MWILDCARD GAMESOakland/Kansas CitySan Francisco/PittsburghSept 30, Oct 1(2 telecasts)TBS, ESPN684,000MLB OPENING DAYChicago/PittsburghMar 31ESPNMARJuly 15FOXNLCS PLAYOFFSSan Francisco/St. LouisOct 11-16(5 telecasts)FOX, FS15.1 MALCS PLAYOFFSKansas City/BaltimoreOct 10-15(4 telecasts)TBSAPRAUGJULYSEPT13.8 MWORLD SERIESSan Francisco/Kansas CityOct 21-29(7 telecasts)FOXOCT1.3 M146,0001.1 M1.2 M1.2 M4.5 M* Tweets were added up across all events in the NLCS Playoffs, ALCS Playoffs and World Series.People in the U.S. who Tweet about MLB games are 31% more likely to Tweet about the Insurance brands than they areto Tweet about brands in general. (3/22/2014 – 9/28/2014)16NIELSEN YEAR IN SPORTS REPORT
MLB FAN-BASE FOUND OUTSIDE OFTRADITIONAL MLB MARKETSThe MLB has more outer market viewers in C and D counties than other sports. The MLB out-of-market audiences make up 42% ofMLB games total household viewing. In addition, although more households tune in to national MLB games than those on regionalnetworks, local team affinity drives the majority of viewership. Regional sports networks accounted for 72% of totalhousehold minutes viewed across all (Regional and National) MLB games.TOTAL HOUSEHOLD REACH OF REGIONAL GAMESMLB Market20,651 (57%)18,938 (58%)Non-MLB Market15,318 (43%)13,662 (42%)TOTAL HOUSEHOLD REACH OF NATIONAL GAMESMLB Market21,484 (47%)23,151 (48%)Non-MLB Market24,175 (53%)25,545 (42%)HOUSEHOLD MINUTES SPENT VIEWING: REGIONAL VS. NATIONAL GAMESRegional15,101,183 (74%)13,779,914 (70%)National5,277,102 (26%)5,800,439 (30%)LOCAL MARKET INSIGHTS: St. Louis is often called baseball’s best city. In Scarborough data, they are unrivaled, having ranked #1 in eleven out offifteen years since 2000, and #2 in every year that they have not been #1. They are top again this year, with 76% of St. Louismarket adults as fans, compared to the St. Louis Rams at 48%. St. Louis, however, isn’t the only big baseball town Thereare a handful of markets where the MLB team ranks ahead of the NFL team, including Atlanta, Tampa, Detroit, Boston, andNew York. There are more Yankees fans in the New York market (6.8 million) than there are adults in Philadelphia (6.3 million), America’s#4 media market.TOP MLB ADVERTISERS1Chevrolet Silverado2Budweiser3Taco Bell4Geico5T-MobileCopyright 2015 The Nielsen CompanyFAN INSIGHTSCompared to the average US adult, avid MLB fans are:20%22%70%more likely to have used a car rental company in the past12 monthsmore likely to have gone on a cruise in the past 3 yearsmore likely to have spent more than 100 on sports equipmentin the past 12 months17
NHLNATIONAL HOCKEY LEAGUEAfter last season’s shortened season of only 48 games, 2014 more than made up for the reduced hockey action last year. In additionto the regular full season, NHL fans were treated to an entirely new set of outdoor games, the Stadium Series.The action-packed season finished up with the legendary Montreal Canadiens and the three largest US markets facing off in theConference Finals. The nailbiting Game 7 of the Western Conference Finals between the Chicago Blackhawks and LA Kings seta record as the most-watched non-Stanley Cup Final NHL Playoff game ever. While they may not have made it to the Finals, theChicago Blackhawks had plenty of moral support—their final game at the Western Conference Finals earned a 22.7 HH local rating.TIMELINE OF SEASON HIGHLIGHTSAVERAGE # OF TV VIEWERS1.7 M# OF TWEETSEASTERN CONFERENCE FINALSNY/MontrealMay 19-29(6 telecasts)NBCSN4.4 MWINTER CLASSICToronto/DetroitJan 1NBC5M1.6 M2.4 MSTADIUM SERIESJan 25 - Mar 1(4 telecasts)NBC, NBCSNJANMAR225,000364,000STANLEY CUP FINALSNY/Los AngelesJune 4-13(5 telecasts)NBC, NBCSNWESTERN CONFERENCE FINALSChicago/Los AngelesMay 18 - June 1(7 telecasts)NBCSNAPRMAYJUNE933,000JULY2M1.3 M* Tweets were added up across all events in the Stadium Series, Western Conference Finals, Eastern Conference Finals and Stanley Cup Finals.People in the U.S. who Tweet about NHL games are 58% more likely to Tweet about the Financial Services categorythan they are to Tweet about brands in general. (10/1/2014 – 4/13/2014)18NIELSEN YEAR IN SPORTS REPORT
THE NHL STADIUM SERIESINVITING NEW FANS INTO THE TENTThe NHL gave fans their fill of a record 6 outdoor games this year, including the new 4-game Stadium Series. With more than 23.7million reached, the games were national and local hits not just with hockey fans, but with non-fans as well.For 12.8 million (55%) viewers, the Outdoor Games was theonly nationally-televised regular season hockey they watchedall year.TOTAL REACH OF OUTDOOR GAMES55%45%Watched Other NHL NationalRegular Season GamesOnly Watched NationalOutdoor GamesLOCAL HOUSEHOLD RATINGS RECORDS13.3PITTSBURGHPittsburgh Penguins vs.Chicago BlackhawksNBC3.6NEW YORKNY Islanders vs. NY RangersNBCSN5.1NEW YORKNY Rangers vs. NJ DevilsNBC*tied for highest rating with Game 1 ofStanley Cup Finals2.4LOS ANGELESAnaheim Ducks vs. LA KingsNBCSNThe games made regular season network ratings recordswithin their respective markets.LOCAL MARKET INSIGHTS: With a higher than average N-score among hockey players, prolific goal scorer Sid “The Kid”Crosby has helped make Pittsburgh a big-time hockey market. In the year prior to his arrival,2004, only 33% of the market was fans. Ten years later, Penguins claim 57% of Pittsburgh theirfans, earning the title as the number one hockey market! The Blackhawks have enjoyed an extraordinary resurgence in the Chicago market over the past7 years, no doubt thanks to more local home games on TV and winning several Stanley Cups.In 2007, just 8% of Chicagoans were Blackhawks fans; by 2014 that had number grown to 50%.TOP NHL ADVERTISERS1Discover Credit Card2Geico Auto Insurance3MyCleanPC.com4Verizon Wireless5Bud LightCopyright 2015 The Nielsen CompanyFAN INSIGHTSCompared to the average US adult, avid NHL fans are:15%29%45%more likely to own both a tablet and a smartphonemore likely to have spent 5,000 or more on home improvementsin the past 12 monthsmore likely to have taken a domestic flight 3 times or more inthe past 12 months19
SOCCERThe beautiful game was still fresh on everyone’s minds in mid-August when EPL had its record-setting opening weekend, andEPL’s regular season has since kept up the great start with i
seven game series over the Royals. But one of the biggest stories in baseball this season was the farewell tour of Yankee legend, Derek Jeter. Per Nielsen Talent Analytics, more than 83% of Americans know of Jeter, making him by far the most recognizable player in MLB. College football waved goodbye to the BCS and entered a new era in 2014