Transcription
CERN-ACC-NOTE-2016-00522016-07-28Beam performance and instrumentation studies for the ProtoDUNE-DPexperiment of CENFN. Charitonidis*, 1, Y.Karyotakis2, 1 and I. Efthymiopoulos11 CERN,21211 Geneva 23, SwitzerlandLAPP, Lab. d’Annecy-le-Vieux de Physique de Particules, 74941 Annecy-le-Vieux CEDEX - France* Corresponding author : nikolaos.charitonidis@cern.chKeywords: CENF, ProtoDUNE, Neutrino Platform, Beam Line Simulations, H2, VLEAbstractIn this note, we address the beam performance (particle content, rates) with emphasis on themomentum determination and particle identification methods for the new H2-VLE (Very LowEnergy) beam line that will serve the double phase ProtoDUNE experiment (also known asWA105), in the framework of the CENF project. The proposed instrumentation is configured toachieve an optimal pi/Κ/proton separation over the full spectrum of provided beam energies, from0.4 GeV up to 12 GeV, as well as precise momentum measurement to a percent level, if requiredby the experiment. This note focuses on the H2-VLE beam line for the Double Phase ProtoDUNEexperiment, however the same approach can be implemented for the H4-VLE beam, since thedesign of the two beam lines is very similar.1. Beam LayoutThe new beam line, designated ‘H2-VLE’ (and similarly ‘H4-VLE’) constitutes anextension of approximately 40 meters of the existing infrastructure of H2 (H4) beam line of theNorth Area Complex of SPS, designed to provide low-energy particles in the range of sub-GeVto few GeV to the installed CENF experiments. In each case, the low energy particles areproduced through the interaction of a secondary beam of high-intensity ( ) and momentum ( 6080 GeV/c) with a target material. Typically, for producing a positive low-energy hadron beam, asecondary hadron beam of 80 GeV consisting of 70% pi , 25% p and 5% of K with 1% Δp/pmomentum spread, and with intensity of few 106 particles per pulse is used. Similarly, forproducing low-energy electrons, a secondary, relatively pure electron beam of 50-60 GeV is used.In all cases, the secondary beam is transported through the existing H2 (and H4) beam lines onthe secondary target. The Very Low Energy Extensions emerging from the secondary target ofH2 (and H4) select and transport the tertiary lower energy particles (mixed hadron, or almostpure electron beams within the range of 0.4 – 12 GeV) to the installed double phase in H2 and
single phase ProtoDUNE experiments [2,3]. The beam layout and performance of the VLE beamsare presented in detail in [1].A CATIA drawing of the H2-VLE extension pointing to the 11 11 m2 Double Phase ProtoDUNEexperiment is shown in Fig.1.Figure 1: CATIA drawing of the H2-VLE beam line extension. The total beam line length from thesecondary target at the bottom of the figure to the experiment is 39.644 m. (Courtesy V. Clerc).In the case of H2-VLE beam line, downstream the secondary target the initial quadrupoleacceptance triplet makes the first geometrical selection of the low energy particles, followed bya momentum selection and recombination station including the momentum collimator and thefield-lens quadrupole. Finally, a set of focusing quadrupoles focuses the beam on the experiment,providing a spot size of approximately 10 6 cm2 at the center of the detector. The conceptuallayout of the beam line along with the instrumentation, is shown in Fig. 1. The maximummomentum spread accepted by the beam line is 5%. In order to maximize the acceptance andreduce the overall length of the beamline, the four bending magnets are tilted by 34.9 degreeswith respect to the floor. The optics drawing of the beam line depicting the beam envelope is-2-
shown in Fig.2. Fig.3 shows the spot size of the beam at the focal point at the middle of theProtoDUNE-DP detector.Figure 1: Schematic layout of H2-VLE beam line. Between the elements, several instrumentation devicesare depicted.Figure 2: Optics drawing of the H2-VLE beam line. The red line indicates the envelope of particlesemitted at 10 mrad from the secondary target, the blue the contribution to the beam size from themomentum dispersion, and the green that of the target source of 1mm.-3-
Figure 3: Spot size of the beam at the middle of the protoDUNE-DP detector.2. Beam Composition and RatesIn order to investigate the beam particle composition and the background seen by theexperiment and therefore optimize the particle identification methods and the beaminstrumentation, a detailed model of the upstream secondary H2 beam line as well as the H2VLE extension has been in a GEANT4 based software, G4BeamLine [4]. All the beamelements (magnets, collimators, vacuum elements and beam detectors) have been preciselymodelled, and massive Monte Carlo simulation productions have been performed, in order tominimize the statistical uncertainties. The model takes into account all the physics processesincluded in GEANT4, eg: muon-to-gamma production synchrotron, radiation energy loss,multiple scattering, etc.As first step, simulations were performed to validate the beam line design and exploredifferent simulation options. In this case, the ‘default’ secondary target of a copper cylinder, 30cm long and 3 cm radius was used. Further, to be as realistic as possible in terms of transportedparticles and intensities, the secondary particles were generated at the primary target andtransported for 631 m through the magnetic elements of H2 beam line, interacting with thesecondary target, and subsequently transported to the experiment through the VLE part. Twomain physics lists from GEANT4 were used: the “FTFP BERT” and “QGSP BIC”. Since thetwo lists depend on different parametrizations of the several hadronic cross-sections, thepredicted production rate of particles can be quite different depending on the momentum range.A detailed study, comparing the simulation results with the test beam data should be done inorder to finally assert the best physics list for this momentum range. The transport threshold ofthe particles was set to 10 MeV. A visualization of the model used in those studies can be seenin Fig. 5.-4-
Figure 5: A visualization of the H2-VLE beam line in G4BeamLine. The four tilted bends are depicted inred, the quadrupoles in green, and the ProtoDune-DP detector in gray. All the vacuum elements have beenmodeled, as well as the instrumentation. The blue tracks show the emerging low-energy particles from theinteraction of the beam particles with at the magnets’ apertures and yokes.Two different operational scenarii have been studied: The VLE beam line transports thepositive sign particles or the negative sign particles respectively produced at the secondarytarget. For this analysis, we impose the condition that all particles at the entrance of theProtoDUNE-DP detector, are within the aperture of the beam pipe, assumed rectangular, withhorizontal and vertical dimensions of 200 mm. No additional condition has been imposed andtherefore the beam composition may include low-energy particles generated from showers inthe interaction of the beam particles with apertures along its length that would easily be rejectedin the real experiment with the proper trigger setup.The background to the experiment from particles outside the beam pipe is not discussedin this note, nor the muon background from the secondary beam (H2 or H4) or the neighboringbeam lines or other sources. Also no shielding/dumps/walls or beam windows have beenincluded in these simulations as well as no material from the instrumentation devices.2.1 Hadron rate at the experimentFig.6 shows the full-acceptance useful hadronic rate of particles seen by the experimentas a function of the momentum for 106 particles on the secondary target and the SPS spill lengthof 4.8 seconds. The experiment’s DAQ is limited for a maximum rate of 100 Hz to be providedby the beam, a condition that is satisfied for energies above 3-4 GeV, while for lower energiesa higher secondary beam intensity must be used. The pion, kaon and proton content of the beam,normalized to the total charged particles, for both positive and negative momenta is shown inFigures 7, 8 and 9. Significant differences are observed between the two lists considered as forexample in the pion production, where for the low-energies approx. 20% more pi- are producedcompared to the positive case.-5-
Figure 6: Simulated hadron rate of all charged particles at ProtoDUNE-DP experiment, for 1E6 particleson the secondary target and a spill length of 4.8 s, using the “standard” target of 30 cm copper.Figure 7: Simulated pion content reaching the ProtoDUNE-DP experiment, for an initial intensity of 106particles on the secondary target. The errors are calculated using the binomial error function.-6-
Figure 8: Simulated kaon content at ProtoDUNE-DP experiment, assuming an initial intensity of 106particles on the secondary target. The errors are calculated using the binomial error function.Figure 9: Simulated proton content at ProtoDUNE-DP experiment, assuming an initial intensity of 106particles on target. The errors are calculated using the binomial error function.-7-
In the lower momenta, electrons dominate the spectrum. For the energies lower than 4GeV, the decay length of pions and kaons becomes a significant factor in the population ofthose particles reaching the experiment. The percentage of surviving pions and kaons, as afunction of the beam line length is shown in Figures 10 and 11. For the 0.4 GeV beam,approximately only 20 % of the initially produced pions will reach the entrance of theexperiment, at 39. 644 m from the secondary target. For Kaons, below 4 GeV the expected rateto the experiment becomes negligible, and drops to zero below 2 GeV. Approximately 62% ofthe initially produced kaons with momentum 12 GeV will reach the experiment.Figure 10: Decay rate of pions as a function of the distance from the secondary target. The dashed verticalline indicates the entrance of the ProtoDUNE-DP experiment.Figure 11: Decay rate of kaons as a function of the distance from the secondary target. The dashed verticalline indicates the location of the ProtoDUNE-DP experiment.-8-
2.2 Hadron beam compositionThe simulated beam content at the experiment, within the vacuum beam pipe aperturefor both positive and negative particle beams is summarized in Tables 1 and 2, for the twodifferent physics lists, and using the ‘standard’ Cu target. One million events have beensimulated per energy point, resulting to an error in all cases of less than 3 %. Figures 12 and 13show a graphical view of the same 9%e 0%0.00%0.00%0.00%0.00%K 5%0.05%0.09%mu .10%0.13%pi 2.57%58.42%61.40%62.84%65.64%67.11%67.08%Table 1: VLE beam particle content at the experiment, within the beam pipe and for 1E6 particlesimpinging on the secondary target. The physics list used is FTFP BERT.-9-
Figure 12: Particle content at the ProtoDune-DP experiment, within the beam pipe aperture, for 106particles impinging on the secondary target. The physics list used is FTFP 0%0.58%0.16%0.31%0.38%0.18%e 00%0.06%K - 10 18%mu 00%0.08%0.00%0.06%pi 6.41%
9.78%59.35%58.63%58.90%Table 2: Particle content at the experiment, within the beam pipe aperture, for 106 particles impinging onthe secondary target. The physics list used is QGSP BIC.Figure 13: Particle content at the experiment, within the beam pipe, for 106 particles impinging on thesecondary target. The physics list used is QGSP BIC.From the above tables and plots, is evident that the difference in the predictions of thephysics lists used, becomes more pronounced in the lower energy part of the spectrum, and morespecifically in the anti-proton production. The ratio of the particle counts in the experimentbetween the two lists is shown in Figure 14. The ratio of all the particles species remains withina factor of 2.5, with the exception of the big overestimation by the QGSP BIC list for theantiproton production in the higher energies by a maximum factor of 6.5. Several references (seefor example [5]) recommend the FTFP BERT list for simulating the hadron production in the 1-- 11 -
12 GeV momentum range, and therefore we have chosen this one as baseline for the rest of thestudies.Figure 14: Ratio of hadron counts at ProtoDune-DP of the two physics lists used in the study.2.3 Target optimization for hadron beamsIn order to enhance the pion production in the momentum range lower than 4 GeV/c,different target materials and dimensions have been studied. As shown in Table 1 and Figure 12,using as an example the 2 GeV/c case, the particle content reaching the experiment is 80%electrons, 10% pions and 7% protons, with the standard Cu target. Changing the target materialto tungsten and maintaining the same length of 30 cm and radius of 3 cm, the radiation length isincreased by a factor 5, and therefore the electron production is suppressed due to reabsorption.The pion production on W is slightly less than Cu, but the overall pion content of the beam isincreased by a factor 3, as shown in Figure 15. Figure 16 shows the dependence of the particleproduction of hadrons (pions and protons) on the target parameters: radius and length for the lowenergy points of 1 and 2 GeV.- 12 -
Figure 15: Particle content with W and Cu Target, 30 cm length, for a 2 GeV/c beam.Figure 16: Particle production from a W target of several lengths (15 to 30 cm) and radii (from 3 to 5 cm)for the two low-energy momenta 1 and 2 GeV.A W target of 30 cm length and 3 cm radius gives satisfactory yield for the 1 and 2 GeV/cmomenta, and therefore we propose its use in the lower part of the momentum spectrum. For thehigher energies the “standard” Cu target, of 30 cm length and 3 cm radius yields satisfactoryresults and therefore maintained.- 13 -
2.4 Electron or muon beamsAs discussed above, with the VLE beam set for hadron production and transport, we endup at the experiment with mixed beam containing hadrons, electrons and muons at variableproportions depending on the energy. The beam line will be equipped with specialinstrumentation as explained in Section 4 aimed to tag each particle species, in particular thepions and kaons that are more challenging for the low-energy range. Alternatively, low-energyelectron or muon beams can be easily configured that represent much less of a challenge toachieve at the wanted trigger rate of the experiment of 100 Hz.For the electron (or positron) beams the H2 (or H4) beam line will be tuned to transport amedium-energy secondary electron beam of 50-60 GeV of moderate intensity of approx. 104particles per pulse. For the low-energy production a Pb target of few radiation lengths will beused, tuned to the required energy range. The tertiary VLE beam will be basically pure, with theonly background coming from low-energy electrons/photons from interaction with the beamaperture and material that can be cleared with the experimental trigger setup and the wantedelectrons tagged with installed instrumentation.Low-energy muon beams can be produced in the hadron mode by closing the momentumselection collimator. In this case, the last two dipoles in the line will act as momentumspectrometer to transport the selected beam momenta to the experiment.3. Triggered Beam Composition and Data Taking TimeEstimateBased on the conclusions of Section 2, we finalized the beam line model inside GEANT4 andwe run a high statistics simulation of 6M events per energy point, including all known materialsalong the beam: scintillators, Cherenkov gases, vacuum windows, stainless steel cryostatmembrane. In addition we request that particles satisfy the minimal trigger conditions of theexperiment, namely that they cross all the beam detectors. Table 3 shows the expected beamcomposition. Negative particle contribution is negligible.Momentum[GeV/c]0.41233456789101112e .70%19.36%15.12%12.36%10.46%8.90%K 5.67%6.02%6.95%6.89%mu pi 46%63.24%67.29%68.66%68.20%69.30%Table 3: Beam composition for the hadron beams, including all the material in the beam line. Below andat 3 GeV the W-target was used.- 14 -
Considering the requested number of particles for physics by the ProtoDUNE-DP experiment[6], we compute the number of days required to achieve this statistics with conservativeestimates assuming: 50% useful events, an SPS supercycle of 50 s with two beam pulses to theNorth Area each of 4.8 seconds, and a trigger rate of 100 Hz for the experiment that based onthe discussion in Section 2 can be reached for all energies. The results are shown in Table 4.The total number of run-days needed to achieve the experiment’s goal is .20%69.30%0.4123456789101112Number ofdays326411754333333Number le 4: Number of days needed in order to gather the required statistics for the ProtoDUNE-DPexperiment, for each momentum bin according to the operational scenario as described in the text.The trigger rate, assuming a wide-open collimator and 106 particles on the secondary target isshown in Tables 5 and 6 below.Momentum0.4123e 7211714K 0001mu 0001p04710pi 031230Trigger rate [Hz]7283656pi 4980100133169193227254268292Trigger rate [Hz]213218222247279305337370393422Table 5: Trigger rate for a W targetMomentum3456789101112e 1451179477695951464138K 1359111619222729mu 1122233333p16162025283537455360Table 6: Trigger rate for a Cu target- 15 -
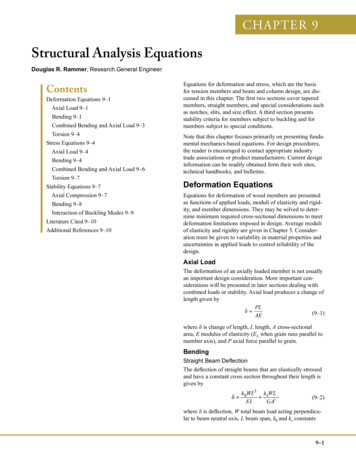
4. Beam InstrumentationThe VLE beam line will be equipped with several types of beam instrumentation deviceswith a goal to: a) provide the beam profiles at various locations to be used for beam tuning, b)provide a trigger to the experiment, c) measure, particle by particle the beam momentum with aprecision lower than 5% over the total operational momentum spectrum (0.4 GeV– 12 GeV) andfinally d) provide particle identification, tagging pions, kaons, protons and electrons whenpossible. The various signals and information from the beam devices will be integrated with theexperiment’s DAQ system for synchronous readout.We propose the following detectors along the beam line:a) 4 “beam profile monitors”, each one consisting of one or two layers of thin scintillatingfibers of 1 mm width, measuring the horizontal and vertical coordinates (only in the front ofthe experiment). They will be used for the beam profile measurements and the event-by-eventmomentum determination. The four profile monitors are located at distances 24.882, 25.246,29. 668 and 39.492 m from the secondary target. They are marked as “BPROFx”, withx 1,2,3,4 in Figure 3.b) Two gas threshold Cherenkov counters, each one with an active length of approx. twometers, located at distances 36.738 and 38.638 m from the secondary target, shown in Figure3 as “XCET1” and “XCET2”. The counters will be filled with Freon 12 and CO2 gases, andtheir pressure is adjustable from 0.5 bar up to 15 bar (for the CO2 only) depending on thebeam momentum.c) One extra fiber layer, which, in coincidence with one layer of BPROF4 will act as Timeof Flight counter. It is located at a distance of 7.304 m from the target (between Q22 andQ23), thus providing a flight distance of approx. 32 m, andd) Three thin scintillator tiles, used to build the experiment’s trigger. Using theaforementioned instrumentation, the momentum measurement method and the particleidentification procedure is described in detail in the following sections.All fiber and scintillator detectors will be installed inside the beam vacuum, thusminimizing the material in the beam. The two Cherenkov counters evidently must be separatedand isolated from the beam vacuum with thin Mylar windows.4.1 Momentum measurementThe theoretical momentum acceptance of H2-VLE (and H4-VLE) beam line is 5%. Thebeam is equipped with a momentum selection station (including the ‘momentum collimator’)able to reduce the momentum byte Δp/p rms of the beam according to the empirical formula validfor this beam line:𝟐𝟐𝟐𝟐Δ𝒑𝒑 𝑪𝑪𝒙𝒙 𝟓𝟓𝟓𝟓. 𝟏𝟏 %𝒑𝒑𝟐𝟐𝟐𝟐. 𝟔𝟔Where Cx is the full opening of the collimator in mm. Figure 17 shows the Δp/p variationas a function of the collimator slit.- 16 -
Figure 17: The beam momentum byte (Δp/p) for few settings of the collimator slit(GEANT4 simulation)To achieve a better momentum resolution without reducing the count rate, the three beamprofile monitors described in the previous section, placed around the fourth bending magnet(B8b) of the line are used as a spectrometer. The technique has been used in the past with success[6]. The layout of the spectrometer is shown in Figure 18. The distances of the three profilemonitors from the center of the last magnet are 2.004 m, 1.718 m and 2.728 m respectively forBPROF1, BPROF2 and BPROF3, from which the distances L1, L2, and L3 relevant for themomentum reconstruction can be deduced. In a simplified approach, the deflection angle θ of abeam particle traversing the magnetic field of the dipole can be determined using the measuredposition in the three monitors P1, P2, P3 and the point Po that is the projection of the outgoingtrace at the origin as shown in Figure 18. Using vector notation, we have:Which after some algebra gives:𝐜𝐜𝐜𝐜𝐜𝐜 𝝑𝝑 𝑎𝑎 ⃗ ⃗𝑷𝑷𝟏𝟏 𝑷𝑷𝒐𝒐 𝑷𝑷𝟑𝟑 𝑷𝑷𝟐𝟐‖𝑷𝑷𝟏𝟏 𝑷𝑷𝒐𝒐 ‖‖𝑷𝑷𝟑𝟑 𝑷𝑷𝟐𝟐 ‖𝑥𝑥2 𝐿𝐿3 𝑥𝑥3 𝐿𝐿2𝐿𝐿3 𝐿𝐿2- 17 -
Figure 18: Layout of the H2-VLE (and similarly H4-VLE) momentum spectrometer around the lastdipole.To validate the performance of the spectrometer, we used the high statistics simulation,which includes all the material in the line, the gas in the Cherenkov detectors at the right pressuresper momentum, as well as the expected special resolution of the profile monitors. For eachparticle, we compute its momentum from the above equation, and therefore the measured Δp/pof the line. Assuming no material in the beam line for a central momentum of 12 GeV/c andposition resolutions of 0.2 mm, 0.5 mm and 0.8 mm we obtain a Δp/p of 1.1%, 2.5% and 3.9%accordingly, as shown on Figure 19. When the material along the beam is included, thereconstructed momentum resolution Δp/p deteriorates, because of the multiple scattering, withthe effect becoming more significant in lower energies, as shown on Figures 20, 21 and 22. Forthe 2 GeV beam, the reconstructed momentum resolution with all material included and with- 18 -
0.2mm position resolution in the detectors increases to 1.5% and gets to about 6% for the lowestenergy point of 0.4 GeV.Figure 19: Reconstructed momentum byte for a beam of 12 GeV, ignoring the material on the beam line.Figure 20: Reconstructed momentum byte for a beam of 0.4 GeV, taking into account the material on thebeam line.- 19 -
Figure 21: Reconstructed momentum byte for a beam of 2 GeV, taking into account the material on thebeam line.Figure 22: Reconstructed momentum byte for a beam of 11 GeV, taking into account the material on thebeam line.Figure 23 summarizes the results on the momentum reconstruction resolution over the fullenergy range of the beam and for three detector resolutions. For the expected resolution of thefiber profile detectors of 0.3 mm, the momentum can be determined to approx. 2% in the rangefrom 1-12 GeV. We therefore conclude that the momentum measurement with the spectrometercan significantly improve the Δp/p of the beam without reducing the counting rate, and therefore- 20 -
can be considered if precision measurements on the beam particles is required by theexperiments.Figure 23: Momentum resolution of the spectrometer for three different position resolutions, namely 0.2,0.5 and 0.8 mmAlthough the beam particle momentum can be precisely determined as demonstrated above, thematerial in the line downstream the spectrometer will also deteriorate the particles’ momentumreaching the active volume of the detectors. Figure 24 shows the ratio between the beammomentum in the middle of the cryostat (the liquid argon inside the detector itself is ignored)and the momentum at the position of the TOF0 detector. At low energies, a significant tail andshift in the mean momentum is observed that should be considered in the data analysis by theexperiment, in particular for the low-energy electron beams.Figure 24: Deterioration of particles’ momenta due to the material present in the line, for the case of 1 and4 GeV. The effect is more pronounced in the lower energies.- 21 -
4.2 Particle Identification (PID) with Cherenkov Counters and TOFThe proposed PID system for the VLE beam, uses a combination of two 2 m longthreshold Cherenkov counters (XCET), and a TOF system with a flight path of 32 m, in orderto tag all particles (in particular pions) cover he overall momentum spectrum provided by thebeam line. The first Cherenkov XCET1 is filled with Freon-12 and the second XCET2 withCO2. They will operate in the range of pressures from 100 mbar 10 bar, depending on thebeam momentum and particle ID tagging requirement. The choice of Freon-12 was necessarydue to the high refractive index providing satisfactory number of Cherenkov photoelectrons, inaddition to its non-flammable properties.In Figures 25 and 27 the pressure threshold as a function of the momentum and theparticle type are shown for Freon-12 and CO2 gases. For the XCET1 (Freon12) counter, pionsemit radiation above 1.8 GeV for a pressure of 3 bar, kaons from 3.5 GeV for a pressure of 10 bar and protons do not emit any radiation for pressures below 3 bar. For the XCET2 (CO2)counter, pions emit radiation above 3.5 GeV for a pressure of 2 bar, kaons from 4.5 GeV for apressure of 15 bar and protons do not emit any radiation for pressures below 7 bar. In Figures26 and 28 the number of photoelectrons for the interesting momentum regions are shown. Forthis calculation we assumed a 50% overall light collection and photoelectron productionefficiency, to preserve a safety margin. It is clear that the Cherenkov system cannot tag pionsand protons below 2GeV/c and a TOF system is needed.Figure 25: Threshold pressure for the Cherenkov Counters filled with Freon 12 gas.- 22 -
Figure 26: Number of photoelectrons for pions for the XCET1 (Freon 12) Cherenkov.Figure 27: Threshold pressure for the Cherenkov Counters filled with CO2 gas.- 23 -
Figure 28: Number of photoelectrons for kaons in the XCET2 (CO2) Cherenkov counterIn Figures 29 and 30, the TOF separation in terms of standard deviations, for pi-p and p-Kseparation are shown. The safe 4σ separation for pi-p tagging, is achieved with 2 ns TOF timingresolution for particles below 3 GeV, where 500 ps are needed for particles with momenta up to5 GeV. For the p-K tagging, the 4 σ separation, is obtained with 500 ps TOF timing resolutionfor particles below 3 GeV, where 100 ps are needed for particles with momenta up to 6 GeV.Figure 29: Pion / proton separation using a time of flight system with the counters placed at 32 metersdistance.- 24 -
Figure 30: Pion / kaon separation usin
2016. CERN-ACC-NOTE-2016-0052 -07 28 . WA105), in the framework of the CENF project. The proposed instrumentation is configured to . the blue the contribution to the beam size from the momentum dispersi