Transcription
epoSampleRAnnualCheckuprtW ellnessScreeningCopyright 2021,DNAHealthMedicalCenterLLC,AllRightsReserved
rtepoRSampleSample ReportAnnual ScreeningWednsday, July 14, 2021
lpedguidemetobetterhealth“DanielTDNAHealthClient
The Growing Im pactofLifestyle on thepopulationsu o30%UAEresidentssu erfromworkrelatedstressRNearlyrt20%19%70% MEN60% W OMENOftheUAEpopulationsu erfrom stagesisthecornerstoneofanye nvariousphysiologicalsystemsinthebodyfrom ndthestrengthofyourimmunesystem .
The m ostcom prehensive,detailed and accurateHealth Screening ReportSampleReportUseTheLatestHealth & W ourplanwilladdressmanyaspectsofyourlife,from ndcommunitylife.CurrentScreening Date14/07/2021.NextScreening Date14 /07/2022.
rtepoRSampleREALISE YOUR POTENTIALHEALTH REPORT
Table of Contents3Practitioner's ReportThis report highlights the notes made about the results of this blood test.4Blood Test Results ReportThis report lists the blood test results and shows whether or not an individualbiomarker is outside of the optimal range and/or outside of the clinical lab range.10Blood Test Results Comparative ReportrtThis report lists the blood test results and shows whether or not an individualbiomarker is outside of the optimal range and/or outside of the clinical lab range.Functional Systems ReportNutrient Status ReportepoThis report presents the 20 systems of Functional Health.1215This report gives you an indication of your client's general nutritional status and thegeneral degree of de iciency for individual nutrients.Health Improvement Plan18RThis report shows customized recommendations based on the blood test results.SampleDisclaimer Page22
Lab Test on Apr 05, 2021Dr. Nasr Al JafariSample Report Annual40 year old Male - Born Dec 31, 1980Dr. Al Jafari's NotesDear Mr.,It has been a pleasure to welcome you to our Clinic. The entire DNA Health team feels privileged to be a part of yourjourney to wellness and longevity.Summary of Findings- Low Magnesium- Improved Liver function testsrt- Lipids much improved but still sub-optimal- Low-normal TestosteroneRecommendationsNutritionalepo- Vitamin D3 improved but not optimalmpleRYour lipid (cholesterol & triglycerides) & Insulin pro ile suggests an underlying Insulin Resistanc e picture. TOMUCH SUGARDo not go heavy on re ined carbohydrates or starches – REDUCE as much as possible8-hr eating window (so 16-hrs fasted)) – this should be achieved on most days (but the idea is not to depriveyourself of the required energy during your eating periods).Doing periods of longer ‘water fasting’ occasionally is therapeutic, particularly for reducing in lammation – (i.e.attempt a 24hr ‘water only’ fast once weekly)An option that you can try once monthly for 2 or 3 cycles would be –https://prolon.ae/(*See guides attached in appendix)ExerciseSaResistanc e training would also be most effectiveScale back the long cardioOccasionally do HIIT sessions BUT (see below) – depends on recoveryTrain intuitively; i.e. if your body is tried then it needs the break.To help with Bio-feedback, obtain anOur a ring - https://ouraring.com/ ORWhoop - https://www.whoop.com/This will help track your sleep and recoveryStress Contr olMeditation, breathing, yoga, reading etc .whatever suits you – make this part of your daily routine (at least 2 xper day)Useful apps – I would suggest using for at least 5-to-10 minutes morning (immediately after waking) and eveningbefore Cold therapy (showers) in the ke-you-stronger-Page 3
Lab Test on Apr 05, 2021Dr. Nasr Al JafariSample Report Annual40 year old Male - Born Dec 31, 1980Sleep9e583448274bSet circadian rhythm in the morning; sun exposure for 15-to-30minsYou should aim to be in bed early – 10 pm latest if you can.Reduce any screen time exposure 60 minutes before bed.Aim for 7 to 8 hours of uninterrupted sleep at night.Reduce caffeineConsider Blue Blockers in the evening - https://www.blublox.com/Note previous suggestion of Oura & Whoop.epoMagnesium Phospholipid complex – three capsules at nightMeth yl-B-Comple x – take two capsules daily in the morningIncr ease your Synjar dy to two times daily (12.5/1000 twice daily)Important LinksRAttachmentsGuide to anti-in lammatory foodsGuide to Carbs & ProteinGuide to Intermittent FastingGuide to SleepGuide to MeditationrtSupplements & MedicationsmpleWeight Loss: https://www.weightlossclinic.ae/blog/Hormonal mechanisms - ing-weight/METABOLISM : SOL : ress-hurt-your-itness-pr ogress/Further Investig ationsSaNot currentlyFollo w-up3-to-6 months to re-check sub-optimal parametersKind regardsDr Nasr Al JafariPage 4
Sample Report Annual40 year old Male - Born Dec 31, 1980Lab Test on Jul 14, 2021Dr. Nasr Al JafariBlood Test Results ReportThe Blood Test Results Summary Report lists the results of the patient’s Chemistry Screen and CBC and shows youwhether or not an individual biomarker is outside of the optimal range and/or outside of the clinical lab range. Thebiomarkers appear in the order in which they appear on the lab test form.Above Optimal RangeAbove Standard RangeAlarm HighBelow Optimal RangeBelow Standard RangeAlarm Low10 Current0 CurrentBlood GlucoseHemoglobin A1C5.80 %eAG119.76 mg/dlInsulin - Fasting7.91 µIU/mlbelow optimaloptimalabove optimalabove standard50.00 - 65.0065.00 - 75.0075.00 - 86.0086.00 - 99.0099.00 - 300.00below standardbelow optimalabove optimalabove standard0-00 - 4.605.50 - 5.705.70 - 8.10above optimalabove standard82.60 %HOMA2-%S95.40 %HOMA2-IR1.04 IndexQUICKI0.35 Indexoptimal4.60 - 5.50below standardbelow optimaloptimal50.00 - 82.0082.00 - 82.0082.00 - 111.00below standardbelow optimal0 - 2.002.00 - 2.00optimalabove optimalabove standard5.00 - 19.0019.00 - 28.00above optimalabove standardbelow standardbelow optimaloptimal70.00 - 90.0090.00 - 110.00below standardbelow optimaloptimal30.00 - 75.0075.00 - 85.0085.00 - 200.00below standardbelow optimal0 - 0.500.50 - 0.75below standardbelow optimal0.10 - 0.340.34 - 0.35111.00 - 154.00 154.00 - 155.002.00 - 5.0030.00 - 70.00SaHOMA2-%Bbelow standardR97.60 mg/dLmpleGlucose - Fasting0 Currentepo12 Current0 Currentrt14 Currentoptimal0.75 - 1.25optimal0.35 - 5.00110.00 - 120.00 120.00 - 300.00above optimalabove standard200.00 - 250.00 250.00 - 500.00above optimalabove standard1.25 - 1.751.75 - 2.50above optimalabove standard5.00 - 5.005.00 - 10.00Page 4
Sample Report Annual40 year old Male - Born Dec 31, 1980Lab Test on Jul 14, 2021Dr. Nasr Al JafariMetabolicUric Acid - Male6.00 mg/dLbelow standardbelow optimal2.00 - 3.453.45 - 3.50optimal3.50 - 5.90above optimalabove standard5.90 - 8.008.00 - 9.00above optimalabove standard5.00 - 5.105.10 - 15.00Proteins4.80 g/dLbelow standardbelow optimal1.50 - 3.603.60 - 4.00optimal4.00 - 5.00rtAlbuminMagnesium - Serum2.14 mg/dlZinc - Serumbelow standardbelow optimal1.20 - 1.501.50 - 2.20optimal2.20 - 2.50below standardbelow optimaloptimal10.00 - 50.0050.00 - 80.0080.00 - 100.00above optimalabove standard2.50 - 2.502.50 - 6.00above optimalabove standard100.00 - 130.00 130.00 - 300.00Liver and GBAST35.00 IU/LALT32.00 IU/L1.09 RatioGGTbelow standardbelow optimaloptimalabove optimalabove standard0 - 10.0010.00 - 10.0010.00 - 26.0026.00 - 35.0035.00 - 100.00below standardbelow optimaloptimalabove optimalabove standard0 - 6.006.00 - 10.0010.00 - 26.0026.00 - 29.0029.00 - 100.00SaAST : ALTmpleR87.00 ug/dLepoMinerals40.00 IU/Lbelow standardbelow optimaloptimalabove optimalabove standard0-00-00 - 1.001.00 - 1.001.00 - 4.00below standardbelow optimaloptimalabove optimalabove standard0 - 3.003.00 - 10.0010.00 - 17.0017.00 - 85.0085.00 - 100.00above optimalabove standardIron MarkersIron - Serum74.66 µg/dLbelow standardbelow optimaloptimal15.00 - 40.0040.00 - 85.0085.00 - 130.00130.00 - 190.00 190.00 - 250.00Page 5
Sample Report Annual40 year old Male - Born Dec 31, 1980Lab Test on Jul 14, 2021Dr. Nasr Al JafariLipidsCholesterol - Totalbelow standard204.00 mg/dL140.20 mg/dLHDL Cholesterol48.40 mg/dLLDL : HDL - Male2.90 Ratio4.20 RatioTriglyceride:HDLbelow optimal0 - 70.00below standardbelow optimal0-00 - 80.00Apolipoprotein A-1141.10 mg/dloptimalabove optimal70.00 - 80.00optimalabove standard80.00 - 150.00 150.00 - 250.00above optimal80.00 - 100.00below standardbelow optimaloptimal35.00 - 46.0046.00 - 55.0055.00 - 70.00above standard100.00 - 100.00 100.00 - 156.00above optimalabove standard70.00 - 100.00 100.00 - 120.00below standardbelow optimaloptimalabove optimalabove standard0-00-00 - 2.282.28 - 4.904.90 - 8.00above optimalabove standardbelow standardbelow optimal0-00-0below standardbelow optimal0-00-0optimal0 - 130.00below standard130.00 - 130.00 130.00 - 220.00optimalabove optimalabove standard0 - 10.0010.00 - 29.0029.00 - 32.00below optimaloptimalabove optimalabove standard0-00-00 - 3.003.00 - 5.005.00 - 5.50below standardbelow optimaloptimalabove optimalabove standard0-00 - 0.501.90 - 2.002.00 - 3.50above optimalabove standardSa1.60 ratiobelow standard0-0mpleNon-HDL CholesterolCholesterol : HDLabove standardrtLDL Cholesterol15.60 mg/dlabove optimalepo78.00 mg/dLVLDL CholesteroloptimalRTriglycerides155.60 mg/dlbelow optimal110.00 - 125.00 125.00 - 160.00 160.00 - 180.00 180.00 - 200.00 200.00 - 300.00below standardbelow optimal30.00 - 94.0094.00 - 115.000.50 - 1.90optimal115.00 - 176.00 176.00 - 176.00 176.00 - 200.00LipoproteinsApolipoprotein B114.40 mg/dlApo B : Apo A-10.81 Ratiobelow standardbelow optimaloptimal25.00 - 52.0052.00 - 52.0052.00 - 80.00above optimalabove standardbelow standardbelow optimaloptimalabove optimalabove standard0-00-00 - 0.250.25 - 0.290.29 - 4.0080.00 - 119.00 119.00 - 175.00Page 6
Sample Report Annual40 year old Male - Born Dec 31, 1980Lab Test on Jul 14, 2021Dr. Nasr Al JafariThyroid1.40 ng/dLT3 - Free3.80 pg/mlFree T3 : Free T42.71 Ratio12.50 IU/mlThyroglobulin Abs1.00 IU/mlIn lammationHs CRP - Male0.50 mg/LHomocysteinebelow optimal0.80 - 1.00below standardbelow optimal1.60 - 2.302.30 - 3.00below standardbelow optimal1.00 - 2.202.20 - 2.40optimal1.30 - 3.00optimal1.00 - 1.50optimal3.00 - 3.50optimalabove optimalabove standard3.00 - 4.504.50 - 20.00above optimalabove standard1.50 - 1.801.80 - 2.34above optimalabove standard3.50 - 4.204.20 - 6.00above optimalabove standard2.40 - 2.702.70 - 2.902.90 - 6.00below standardbelow optimaloptimalabove optimalabove standard0-00-00 - 6.806.80 - 9.009.00 - 18.00below standardbelow optimaloptimalabove optimalabove standard0-00-00 - 1.001.00 - 1.001.00 - 2.00below standardbelow optimaloptimalabove optimalabove standard0-00-00 - 0.550.55 - 2.902.90 - 6.00below standardbelow optimaloptimalabove optimalabove standard0-00 - 5.005.00 - 7.207.20 - 10.3010.30 - 15.00above optimalabove standardSa13.23 µmol/Lbelow standard0.57 - 0.80mpleThyroid Peroxidase (TPO) Absbelow optimal0.40 - 1.30rtT4 - Freebelow standard0.30 - 0.40epo1.60 µU/mLRTSHVitaminsVitamin D (25-OH)48.60 ng/mlVitamin B12603.60 pg/mlFolate - Serum10.60 ng/mlbelow standardbelow optimaloptimal20.00 - 30.0030.00 - 50.0050.00 - 90.00below standardbelow optimaloptimal200.00 - 200.00 200.00 - 450.00 450.00 - 800.0090.00 - 100.00 100.00 - 130.00above optimalabove standard800.00 1100.001100.00 1500.00below standardbelow optimaloptimalabove optimalabove standard3.40 - 5.505.50 - 15.0015.00 - 25.0025.00 - 27.0027.00 - 30.00Page 7
Sample Report Annual40 year old Male - Born Dec 31, 1980Lab Test on Jul 14, 2021Dr. Nasr Al JafariHormonesDHEA-S - Male289.60 mcg/dlTestosterone Total - Male652.00 ng/dl1.79 %Testosterone Bioavailable - Male306.00 ng/dlbelow optimal46.00 - 150.00below standardbelow optimal0.25 - 1.001.00 - 1.60Sex Hormone Binding Globulin Maleabove standardoptimaloptimalabove optimalabove standard900.00 1100.001100.00 1275.00rtbelow standard33.00 - 46.00above optimalabove standard150.00 - 224.00 224.00 - 224.00 224.00 - 300.00optimal1.60 - 2.20optimalabove optimalabove standard2.20 - 2.902.90 - 5.00above optimalabove standardbelow standardbelow optimal50.00 - 110.00110.00 - 375.00 375.00 - 575.00 575.00 - 575.00 575.00 - 750.00below standardbelow optimaloptimalabove optimalabove standard3.00 - 35.0035.00 - 53.0053.00 - 65.0065.00 - 65.0065.00 - 75.00mple% Testosterone Bioavailable Malebelow standardbelow optimaloptimalabove optimalabove standard5.00 - 10.0010.00 - 30.0030.00 - 40.0040.00 - 50.0050.00 - 65.00below standardSa15.50 µg/dLbelow optimalabove optimalepo% Testosterone Free - MaleCortisol - AMbelow standardoptimal350.00 - 690.00 690.00 - 690.00 690.00 - 850.00R117.00 pg/ml42.00 nmol/Lbelow optimal50.00 - 350.00170.00 - 250.00 250.00 - 700.00 700.00 - 900.00Testosterone Free - Male46.93 %below standard20.00 - 50.002.90 - 4.00below optimaloptimalabove optimalabove standard4.00 - 10.0010.00 - 15.0015.00 - 22.0022.00 - 28.50CBC/HematologyHemoglobin - Male14.90 g/dlHematocrit - Male46.30 %MCV85.30 fLbelow standardbelow optimaloptimalabove optimalabove standard10.00 - 13.2013.20 - 14.0014.00 - 15.0015.00 - 17.1017.10 - 18.00below standardbelow optimaloptimalabove optimalabove standard32.00 - 38.5038.50 - 40.0040.00 - 48.0048.00 - 50.0050.00 - 52.00below standardbelow optimaloptimalabove optimalabove standard76.00 - 80.0080.00 - 82.0082.00 - 89.9089.90 - 100.00 100.00 - 110.00Page 8
Sample Report Annual40 year old Male - Born Dec 31, 1980MCH27.40 pgPlatelets235.00 10E3/µLLab Test on Jul 14, 2021Dr. Nasr Al Jafaribelow standardbelow optimaloptimalabove optimalabove standard24.00 - 27.0027.00 - 28.0028.00 - 31.9031.90 - 33.0033.00 - 34.00below standardbelow optimaloptimalabove optimalabove standard140.00 - 140.00 140.00 - 155.00 155.00 - 385.00 385.00 - 400.00 400.00 - 500.00White Blood Cells50.51 %Eosinophils - %2.03 %Basophils - %Neutrophils - Absolute2.98 k/cummEosinophils - Absolute0.12 k/cumm0.07 k/cummabove optimalabove standard7.50 - 10.8010.80 - 15.00below standardbelow optimaloptimalabove optimalabove standard38.00 - 40.0040.00 - 60.0060.00 - 74.0074.00 - 80.00below standardbelow optimaloptimalabove optimalabove standard0-00-00 - 3.003.00 - 3.003.00 - 15.00below standardbelow optimaloptimalabove optimalabove standard0-00-00 - 1.001.00 - 1.001.00 - 5.00optimalabove optimalabove standard4.20 - 7.807.80 - 10.00below standardbelow optimal0.25 - 1.501.50 - 1.90below standardbelow optimaloptimalabove optimalabove standard0-00-00 - 0.300.30 - 0.500.50 - 1.00SaBasophils - Absoluteoptimal5.50 - 7.5015.00 - 38.00mple1.19 %below optimal3.80 - 5.50rtNeutrophils - %below standard2.50 - 3.80epo5.90 k/cummRTotal WBCs1.90 - 4.20below standardbelow optimaloptimalabove optimalabove standard0-00-00 - 0.100.10 - 0.200.20 - 0.80Page 9
Sample Report Annual40 year old Male - Born Dec 31, 1980Lab Test on Jul 14, 2021Dr. Nasr Al JafariBlood Test Results Comparative ReportThe Blood Test Results Comparative Report lists the results of your latest and previous Blood Chemistry Screen and CBCTest and shows you whether or not an individual biomarker is outside of the optimal range and/or outside of the clinicallab range.Above Optimal RangeAbove Standard RangeAlarm HighBelow Optimal RangeBelow Standard RangeAlarm Low5 Previous10 Current0 CurrentPreviousBiomarker7 Previous0 Current4 PreviousCurrent0 CurrentImpr Apr 05 2021 Jul 14 20212 Previous0 Previousrt12 Current6 Previousepo14 CurrentOptimal RangeStandard RangeUnits97.6075.00 - 86.0065.00 - 99.00mg/dL5.804.60 - 5.500 - 5.70%82.00 - 111.0082.00 - 154.00mg/dl7.912.00 - 5.002.00 - 19.00µIU/ml82.6090.00 - 110.0070.00 - 120.00%Glucose - Fasting97.10Hemoglobin A1C5.30eAG105.41Insulin - Fasting11.00HOMA2-%B104.40HOMA2-%S69.1095.4085.00 - 200.0075.00 - 250.00%HOMA2-IR1.441.040.75 - 1.250.50 - 1.75Index0.350.35 - 5.000.34 - 5.00Index6.003.50 - 5.903.45 - 8.00mg/dL4.804.00 - 5.003.60 - 5.10g/dL2.272.142.20 - 2.501.50 - 2.50mg/dl98.0087.0080.00 - 100.0050.00 - 130.00ug/dL19.0035.0010.00 - 26.0010.00 - 35.00IU/L19.0032.0010.00 - 26.006.00 - 29.00IU/LAST : ALT1.001.090 - 1.000 - 1.00RatioGGT20.0040.0010.00 - 17.003.00 - 85.00IU/LIron - Serum59.3974.6685.00 - 130.0040.00 - 190.00µg/dLCholesterol - Total211.00204.00160.00 - 180.00125.00 - 200.00mg/dLTriglycerides205.0078.0070.00 - 80.000 - 150.00mg/dLLDL Cholesterol148.00140.2080.00 - 100.000 - 100.00mg/dLHDL Cholesterol39.8048.4055.00 - 70.0046.00 - 100.00mg/dLLDL : HDL - Male3.722.900 - 2.280 - 4.90RatioNon-HDL Cholesterol171.20155.600 - 130.000 - 130.00mg/dlVLDL Cholesterol41.0015.600 - 10.000 - 29.00mg/dlCholesterol : HDL5.304.200 - 3.000 - 5.00RatioTriglyceride:HDL5.201.600.50 - 1.900 - 2.00ratioUric Acid - MaleAlbuminMagnesium - SerumZinc - SerumASTRSaALTmpleQUICKI119.760.33Page 10
Sample Report Annual40 year old Male - Born Dec 31, 1980Lab Test on Jul 14, 2021Dr. Nasr Al JafariPreviousCurrent143.40Apolipoprotein BApo B : Apo A-1BiomarkerApolipoprotein A-1Impr Apr 05 2021 Jul 14 2021Optimal RangeStandard RangeUnits141.10115.00 - 176.0094.00 - 176.00mg/dl140.90114.4052.00 - 80.0052.00 - 119.00mg/dl0.980.810 - 0.250 - 0.29Ratio1.881.601.30 - 3.000.40 - 4.50µU/mLT4 - Free1.101.401.00 - 1.500.80 - 1.80ng/dLT3 - Free2.903.803.00 - 3.502.30 - 4.20pg/mlFree T3 : Free T42.642.712.40 - 2.702.20 - 2.90RatioThyroid Peroxidase (TPO) Abs9.0012.500 - 6.800 - 9.00IU/mlThyroglobulin Abs1.001.000 - 1.000 - 1.00IU/mlHs CRP - Male0.200.500 - 0.550 - 2.90mg/L13.235.00 - 7.200 - 10.30µmol/L48.6050.00 - 90.0030.00 - 100.00ng/mlVitamin D (25-OH)27.90Vitamin B12442.40Folate - Serum12.70epoHomocysteinertTSH603.60450.00 - 800.00 200.00 - 1100.00pg/ml10.6015.00 - 25.005.50 - 27.00ng/ml289.60350.00 - 690.0050.00 - 690.00mcg/dl652.00700.00 - 900.00 250.00 - 1100.00ng/dl117.00150.00 - 224.0046.00 - 224.00pg/ml1.60 - 2.201.00 - 2.90%306.00375.00 - 575.00110.00 - 575.00ng/dl46.9353.00 - 65.0035.00 - 65.00%42.0030.00 - 40.0010.00 - 50.00nmol/L15.5010.00 - 15.004.00 - 22.00µg/dL14.9014.00 - 15.0013.20 - 17.10g/dl46.3040.00 - 48.0038.50 - 50.00%89.0085.3082.00 - 89.9080.00 - 100.00fL30.3027.4028.00 - 31.9027.00 - 33.00pg363.00235.00155.00 - 385.00140.00 - 400.0010E3/µL5.205.905.50 - 7.503.80 - 10.80k/cummNeutrophils - %Eosinophils - %53.0850.5140.00 - 60.0038.00 - 74.00%1.352.030 - 3.000 - 3.00%Basophils - %0.961.190 - 1.000 - 1.00%Neutrophils - AbsoluteEosinophils - AbsoluteBasophils - Absolute2.762.981.90 - 4.201.50 - 7.80k/cumm0.070.120 - 0.300 - 0.50k/cumm0.050.070 - 0.100 - 0.20k/cummDHEA-S - MaleTestosterone Total - MaleTestosterone Free - MaleHematocrit - MaleMCVMCHPlateletsSaTotal WBCsR1.79mple% Testosterone Free - MaleTestosterone Bioavailable - Male% Testosterone Bioavailable - MaleSex Hormone Binding Globulin - MaleCortisol - AMHemoglobin - MalePage 11
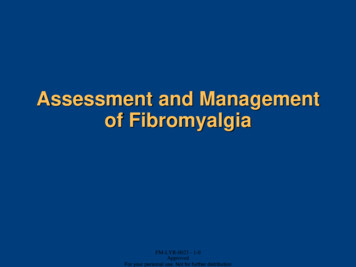
Sample Report Annual40 year old Male - Born Dec 31, 1980Lab Test on Jul 14, 2021Dr. Nasr Al JafariFunctional Systems ReportThe results shown below represent an analysis of this blood test. The results have been converted into your individualFunctional Systems Report based on our latest research. This report gives you an indication of the level of dysfunctionthat exists in the various physiological systems in your body from the digestion of the food you eat to the health of yourliver and the strength of your immune system – which are all key factors in maintaining optimal health. We can use thisinformation to put together a unique treatment plan designed to bring your body back into a state of functional health,wellness and energy.DysfunctionLess Likely 50%Possible50% - 70%Blood Sugar RegulationLikely70% - 90%HighlyLikely 90%rt100%Cardiovascular Function94%Lipid Panelepo85%Liver Function67%Sex Hormone Function - Male62%Gallbladder Function50%In lammation40%ToxicityR33%Thyroid Function29%Oxidative Stress28%25%Bone Health25%mpleAdrenal FunctionKidney Function15%GI Function12%Allergy12%Red Blood Cell Function8%0%Immune Function0%pH Balance0%SaProstate FunctionBlood Sugar RegulationThe Blood Sugar Regulation score tells us how well your body is regulating blood glucose. Blood sugar dysregulation isvery common. It doesn’t suddenly emerge but rather develops slowly, so we can look for clues in your blood test that canhelp us determine if there’s dysregulation and if so what it is. Some conditions associated with blood sugardysregulation include hypoglycemia (periods of low blood sugar), metabolic syndrome, hyperinsulinemia and diabetes.[ 100% ] - Dysfunction Highly Likely. Much improvement required.Rationale:Glucose - Fasting , Hemoglobin A1C , Insulin - Fasting , Cholesterol - Total , LDL Cholesterol , HDL Cholesterol , DHEA-S MalePage 12
Sample Report Annual40 year old Male - Born Dec 31, 1980Lab Test on Jul 14, 2021Dr. Nasr Al JafariCardiovascular FunctionThe Cardiovascular Function score looks at biomarkers on a blood test to assess your risk of cardiovascular dysfunction.A high Cardiovascular Function score indicates that you may be at an increased risk of developing cardiovasculardisease. The Cardiovascular Function score will be used along with information from an examination of your diet,lifestyle, exercise, body mass index, and family history to give us a more complete picture of what is going on.[ 94% ] - Dysfunction Highly Likely. Much improvement required.Rationale:Glucose - Fasting , AST , Cholesterol - Total , LDL Cholesterol , HDL Cholesterol , Homocysteine , Hemoglobin A1C ,Testosterone Total - Male , Insulin - Fasting , Vitamin D (25-OH) , Testosterone Free - MalertLipid Panel[ 85% ] - Dysfunction Likely. Improvement required.epoThe Lipid Panel score gives us an indication of the levels of cholesterol and fat in your blood. An increased Lipid Panelscore indicates that you have higher than optimal levels of cholesterol and fat in your blood (a condition calledhyperlipidemia). Hyperlipidemia is associated with an increased risk of cardiovascular disease and may be genetic or bedue to dietary factors, hormonal imbalances, blood sugar dysregulation and/or other metabolic imbalances.RRationale:Cholesterol - Total , LDL Cholesterol , Cholesterol : HDL , HDL CholesterolLiver FunctionmpleThe Liver Function score re lects the degree of function in your liver. The liver has over 500 known functions. It isinvolved in detoxi ication, digestion, the hormonal system, the immune system, controlling blood sugar, storingnutrients, and protein and fat metabolism. The liver also produces a substance called bile that is stored in thegallbladder. Bile is essential for proper fat digestion and is also a major route of elimination for the body. Factorsaffecting liver function include the accumulation of fat within the liver (a condition called fatty liver), in lammation ofthe liver cells from infections, toxins, etc. (a condition called hepatitis), actual damage to the liver cells themselves (acondition called cirrhosis) or a decrease in the ability of the liver to detoxify, which leads to detoxi ication issues. Thereare biomarkers in the blood that we can measure that can indicate the relative function of the liver.Sa[ 67% ] - Dysfunction Possible. There may be improvement needed in certain areas.Rationale:ALT , AST , Cholesterol - Total , GGTSex Hormone Function - MaleThe Male Sex Hormone Function score helps us assess levels of important hormones in your body: testosterone, DHEA,progesterone, and estradiol. Blood levels of these crucial hormones diminish with age, contributing to age-relateddysfunctions such as low libido, blood sugar problems, excess weight, heart disease, etc. We can measure sex hormonelevels in your blood and determine from the Sex Hormone Function score whether the levels are optimal for yourcontinued optimal health and wellness.[ 62% ] - Dysfunction Possible. There may be improvement needed in certain areas.Rationale:Testosterone Free - Male , Testosterone Total - MalePage 13
Sample Report Annual40 year old Male - Born Dec 31, 1980Lab Test on Jul 14, 2021Dr. Nasr Al JafariGallbladder FunctionThe Gallbladder Function Index re lects the degree of function in your gallbladder. The gallbladder plays an essentialrole in helping your body digest the fat in the diet. It does this through the release of a substance called bile. Bile is notonly essential for fat digestion but it also helps the body get rid of certain toxins and also excess cholesterol from thebody. Factors affecting gallbladder function include the inability of the liver to produce bile (a condition called biliaryinsuf iciency), the progressive thickening of the bile in the gallbladder (a condition called biliary stasis), or the presenceof obstructions in the gallbladder itself (a condition called biliary obstruction).[ 50% ] - Dysfunction Possible. There may be improvement needed in certain areas.SampleReportRationale:GGT , AST : ALT , Cholesterol - Total , ALTPage 14
Sample Report Annual40 year old Male - Born Dec 31, 1980Lab Test on Jul 14, 2021Dr. Nasr Al JafariNutrient Status ReportThe results shown below represent an analysis of your blood test results. These results have been converted into theirindividual Nutrient Status Report based on our latest research. This report gives you an indication of your generalnutritional status. Nutritional status is in luenced by actual dietary intake, digestion, absorption, assimilation andcellular uptake of the nutrients themselves. We can use this information to put together a unique treatment plandesigned to bring your body back into a state of functional health, wellness and energy.Nutrient Index StatusOptimum 50%Moderate50% - 70%Vitamin StatusLow70% - 90%Poor 90%60%Carbohydrate StatusMineral Statusrt50%27%Protein StatusFat Status12%Hydration Status0%Electrolyte Status0%RVitamin Statusepo17%mpleThe Vitamin Status score gives us a general indication of the balance of certain vitamins in your body. Vitamin levels areconstantly luctuating based on a number of factors, such as the amount in your diet, your ability to digest and breakdown individual vitamins from the food or supplements you consume, the ability of those vitamins to be absorbed,transported and ultimately taken up into the cells themselves.[ 60% ] - Moderate Nutrient Status. There may be improvement needed in certain areas.Rationale:Homocysteine , Vitamin D (25-OH) , Folate - SerumCarbohydrate StatusSaThe Carbohydrate Status score gives us an assessment of how your body copes with your dietary intake ofcarbohydrates, especially re ined carbohydrates (white lour, white rice, white pasta, etc.) and sugars. A diet high inre ined carbohydrates and sugars will deplete important nutrients that are used by the body to handle carbohydratesand may also increase blood glucose and blood fat levels, all of which can be measured in your blood.[ 50% ] - Moderate Nutrient Status. There may be improvement needed in certain areas.Rationale:Glucose - Fasting , Cholesterol - Total , LDL Cholesterol , HDL CholesterolIndividual Nutrient ValuesThe values below represent the degree of de iciency for individual nutrients based on your blood results. The status ofan individual nutrient is based on a number of factors such as actual dietary intake, digestion, absorption, assimilationand cellular uptake of the nutrients themselves. All of these factors must be taken into consideration before determiningPage 15
Sample Report Annual40 year old Male - Born Dec 31, 1980Lab Test on Jul 14, 2021Dr. Nasr Al Jafarigwhether or not you actually need an individual nutrient. I will use the information in this section of your NutrientAssessment Report to put together an individualized treatment plan to bring your body back into a state of optimalnutritional function.De iciencyLess Likely 50%Possible50% - 70%Likely70% - 90%Glutathione Need100%Vitamin D Need90%DHEA Need80%Magnesium Need70%Vitamin B12/Folate Need33%Iodine NeedIron Need21%Calcium Need14%Vitamin C NeedZinc Need0%Molybdenum Need0%Selenium Need0%R10%mpleGlutathione Need11%epo27%rt53%Vitamin B6 NeedThiamine NeedHighlyLikely 90%The results of your blood test indicate that your glutathione levels might be lower than optimal. Glutathione is one of themost powerful antioxidants in your body.[ 100% ] - Dysfunction Highly Likely. Much improvement required.SaRationale:GGTVitamin D NeedThe results of your blood test indicate that your Vitamin D levels might be lower than o
warning signs in the earliest stages is the cornerstone of any e 3ective screening programme. Unlike other health screenings, the DNA Health’s screening uses powerful software based on the latest medical research, desig