Transcription
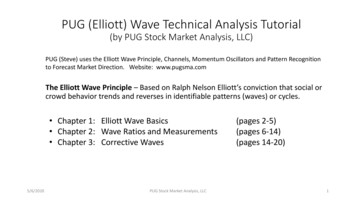
PUG (Elliott) Wave Technical Analysis Tutorial(by PUG Stock Market Analysis, LLC)PUG (Steve) uses the Elliott Wave Principle, Channels, Momentum Oscillators and Pattern Recognitionto Forecast Market Direction. Website: www.pugsma.comThe Elliott Wave Principle – Based on Ralph Nelson Elliott’s conviction that social orcrowd behavior trends and reverses in identifiable patterns (waves) or cycles. Chapter 1: Elliott Wave Basics Chapter 2: Wave Ratios and Measurements Chapter 3: Corrective Waves5/6/2020PUG Stock Market Analysis, LLC(pages 2-5)(pages 6-14)(pages 14-20)1
Chapter 1: Elliott Wave Basics The basic pattern of the market is the motive wave that unfolds in a 5 wave pattern. Waves 1, 3 and 5 move in the direction of the trend or impulse. Waves 2 and 4 are counter trend retracements of the motive wave.5/6/2020PUG Stock Market Analysis, LLC2
Chapter 1: Elliott Wave Basics Motive Wave Rules (5 Waves - Numbered 1, 2, 3, 4, 5) Wave 2 can’t retrace more than 100% of Wave 1. Wave 3, often represents the strongest part of the market cycle, can’t be the shortest by price, compared with Wave 1 or Wave 5. Wave 4 cannot overlap the highest price of Wave 1 (Unless for the special case of a Leading or Ending Diagonal). Corrective Wave Rules (3 Waves - Lettered A, B, C) Wave B can’t retrace more than 100% of Wave A (Unless for special case of an Expanded Flat). A complete wave cycle is 8 waves, 5 motive wave followed by 3 corrective waves.5/6/2020PUG Stock Market Analysis, LLC3
Chapter 1: Elliott Wave Basics Motive (Impulse) Wave Structure (5 Waves - Numbered 1, 2, 3, 4, 5) Waves 1, 3 and 5 are 5-wave structures Waves 2 and 4 are 3-wave structures Corrective (Zig-Zag) Wave Structure (3 Waves - Lettered A, B, C) Wave A and C are 5-wave structures. Wave B is a 3-wave structure.5/6/2020PUG Stock Market Analysis, LLC4
Chapter 1: Elliott Wave Basics One of the keys to interpreting wave counts is to determine what degree the wave in question represents. Each wave could be part of another wave of a higher degree, which in turn could be part of another wave of an evenhigher degree. In Elliott’s original work, he identified nine degrees of waves, that could range from decades to intraday movements. Elliott’s labels read a little like the classification of living things: 1) Grand Supercycle2) Supercycle3) Cycle4) Primary5) Intermediate6) Minor7) Minute8) Minuette9) Subminuette PUG Wave Labeling: (Using only 7 of Elliott’s original 9 wave classification) Super Cycle:Cycle:Primary:Major (Interm):Minor:Minute:Minuette:SCI-SCV, SCA-SCCC1-C5, CA-CCP1-P5, PA-PC[1]-[5], [A]-[C]1-5, A-C(1)-(5), (a)-(c)i-v, a-bDecades2 to 10 years1 to 2 yearsSeveral Months1 to 2 WeeksSeveral DaysSeveral Hours Primary Count: White/Green Labels (Bull Market)White/Red Labels (Bear Market) Alternate Count: Blue Labels5/6/2020PUG Stock Market Analysis, LLC5
Chapter 2: Wave Ratios and Measurements This spiral, which takes the form of a Nautilus seashell, is commonly used to describe themathematical ratio that Elliott Wave theorists lean on to explain why the stock market follows similarpatterns to those found in natural systems, including living creatures on earth and galaxies in space.5/6/2020PUG Stock Market Analysis, LLC6
Chapter 2: Wave Ratios and Measurements The Fibonacci ratio of 0.618, made famous bya 13th-century mathematician namedLeonardo Fibonacci of Pisa, is based on anumber sequence, in which the sum of twoadjacent numbers forms the next highernumber (1, 1, 2, 3, 5, 8, 13 .). It is often referred to as the golden, or divineratio, because it has been found throughoutnature, such as in the DNA double helix, howpetals on a flower are arranged, proportions ofthe human body, a galaxy spiral, and so on adinfinitum. In Elliott Wave, the five waves of a motivephase have a Fibonacci relationship with theeight waves of a complete cycle and eachwave or phase tends to have a Fibonaccirelationship with other waves or phases; thusa retracement phase is often close to 0.382 (1minus 0.618), or up to 0.618, the length of themotive phase.5/6/2020PUG Stock Market Analysis, LLC7
Chapter 2: Wave Ratios and Measurements The price distance of each wave is measured as a vertical distance from the beginning of the wave tothe end of the wave. The length is measured in price points or units. The first wave in a Motive (Impulse) is Wave 1. The measurement of Wave 1 is used to find ratios ofother waves. These ratios are not rules, but guidelines in estimating the lengths of different waves. Ratios for Wave 2 Fibonacci Rule for Wave 2: Wave 2 is always related to Wave 1. Common Ratios for Wave 2: Wave 2 typically is 50% of Wave 1 or 62% of Wave 1 However there are times of 38% in strong markets or 78% to 88% retracements in weak markets.5/6/2020PUG Stock Market Analysis, LLC8
Chapter 2: Wave Ratios and Measurements Ratios for Wave 3Wave 3 is typically related to Wave 1 by one of the following: 5/6/2020Wave 3 1.62 x length of Wave 1or 2.62 x length of Wave 1 (extended Wave 3)or 4.25 x length of Wave 1 (extended Wave 3)However there are times of Wave 3 Wave 1 or less in weak prices.PUG Stock Market Analysis, LLC9
Chapter 2: Wave Ratios and Measurements Ratios for Wave 4Wave 4 is related to Wave 3 by one of the following: Wave 4 23% of Wave 3 or 38% of Wave 3 or 50% of Wave 3 The 23% and 38% are the most common ratios for Wave 4.5/6/2020PUG Stock Market Analysis, LLC10
Chapter 2: Wave Ratios and Measurements Ratios for Wave 5Wave 5 is related to Wave 1 by one of the following: Wave 5 Wave 1 or 1.38 x length of Wave 1 or 1.62 x length of Wave 1 The Wave 5 Wave 1 is the most common ratio. If Wave 3 is extended to 2.62 to 4.25 x Wave 1, then Wave 5 could be truncated at 0.62 x Wave 1.5/6/2020PUG Stock Market Analysis, LLC11
Chapter 2: Wave Ratios and Measurements The first wave of a Simple A-B-C Corrective (Zig-Zag) is a Wave A. Ratios for Wave BWave B is related to Wave A by one of the following: Wave B 38% of Wave Aor 50% of Wave A (most common)or 62% of Wave Aor 78% of Wave A Ratios for Wave CWave C is related to Wave A by one of the following: Wave C Wave A (most common) Wave C 1.62 x the length of Wave A Wave C 2.62 x the length of Wave A5/6/2020PUG Stock Market Analysis, LLC12
Chapter 2: Wave Ratios and Measurements Once the 5th Wave starts, the Elliott Channel Technique can be used to projectthe end of the 5th Wave. Once Wave 4 has been completed, draw a straightline between Waves 2 and 4 forming the lower channel line.5/6/2020PUG Stock Market Analysis, LLC13
Chapter 2: Wave Ratios and Measurements Now draw two lines parallel to the lower channel line connecting the tops of Waves 1 and 3. Expect Wave 5 to end on one of the two upper channel lines. Usually, if Wave 3 was a normal wave,Wave 5 tends to end on the channel drawn from the Wave 3 top. If Wave 3 was extended and arunaway type of wave, Wave 5 tends to end on the channel drawn from the top of Wave 1.5/6/2020PUG Stock Market Analysis, LLC14
Chapter 3: Corrective Waves Corrections are very hard to master. Most Elliott Wave tradersmake money during motive (impulse) waves and lose duringcorrective waves. A motive (impulse) pattern consists of five waves. Thecorrective pattern consists of 3 waves, with the exception of atriangle. An Impulse pattern is always followed by a Corrective pattern. Corrective patterns can be grouped into two differentcategories:1) Simple Correction (Zig-Zag)2) Complex Correction (Flat, Irregular Exapanded Flat or Triangle)5/6/2020PUG Stock Market Analysis, LLC15
Chapter 3: Corrective Waves Simple Corrections (Zig-Zag): A simple correction has one patternonly. This pattern is called a Zig-Zagcorrection. A Zig-Zag correction is a 3-wavepattern(A-B-C) where the Wave B doesnot retrace more than 78% of Wave A. Wave C will make new lows below theend of Wave A. The Wave A of a Zig-Zag correctionalways has a 5-wave pattern. Wave B is3 waves and Wave C is 5 waves (5-3-5). In the other two types of corrections(Flat and Irregular Flat), the Wave A hasa 3-wave pattern. Thus, if you can identify a 5-wavepattern inside Wave A of any correction,you can then expect the correction toturn out as a Zig-Zag formation.5/6/2020PUG Stock Market Analysis, LLC16
Chapter 3: Corrective Waves Flat Corrections: In a Flat correction, thelength of each wave isidentical (A B C). The waves A & B are 3-waves.Wave C is 5-waves. 3-3-5 Wave Pattern. After a 5-wave impulsepattern, the market drops inWave A. It then rallies in a Wave B tothe previous high. Finally, the market drops onelast time in Wave C to theprevious Wave A low.5/6/2020PUG Stock Market Analysis, LLC17
Chapter 3: Corrective Waves Irregular (Expanded) FlatCorrections: In an Irregular Flat correction,the B Wave makes a new high. Wave C may drop to end of WaveA or below (more common). The waves A & B are 3-waves.Wave C is 5-waves. 3-3-5 Wave Pattern. After a 5-wave impulse pattern,the market drops in Wave A. It then rallies in a Wave B beyondthe previous high. Finally, the market drops one lasttime in Wave C to the previousWave A low or below.5/6/2020PUG Stock Market Analysis, LLC18
Chapter 3: Corrective Waves Triangle Wave Corrections: The Elliott Triangle is a 5-wave patternwhere all the waves cross each other. The five sub-waves of a triangle aredesignated A, B, C, D, and E in sequence. Each sub-wave is a 3-wave move. Prices tend to shoot out of the triangleformation in a swift “thrust.”. Triangles are by far most common asfourth waves. One can sometimes see atriangle as the Wave B of a 3-wavecorrection. When triangles occur in Wave 4, themarket thrusts out of the triangle in thesame direction as Wave 3. When triangles occur in Wave B, themarket thrusts out of the triangle in thesame directions as the Wave A.5/6/2020PUG Stock Market Analysis, LLC19
Chapter 3: Corrective Waves Alteration Rule: For an impulse if Wave 2 is a simple correction, expect Wave 4 to be acomplex correction. For an impulse if Wave 2 is a complex correction, expect Wave 4 to be asimple correction. 1) Simple Correction (Zig-Zag) 2) Complex Correction (Flat, Irregular Expanded Flat or Triangle)5/6/2020PUG Stock Market Analysis, LLC20
PUG (Steve) uses the Elliott Wave Principle, Channels, Momentum Oscillators and Pattern Recognition to Forecast Market Direction. Website: www.pugsma.com 5/6/2020 PUG Stock Market Analysis, LLC 1. Chapter 1: Elliott Wave Basics The basic pattern of the market is the motive wave