Transcription
Excerpts, Contents & PricesVolume 4of a Four-Book SeriesElliott Wave Trading -a nuts-and-bolts professional approachby Dr Mircea Dologa, MD, CTADISCOUNT Prices – refer to last pagePrices include Bonuses & DeliveryEmail: mircdologa@yahoo.comwww.pitchforktrader.com
4 Elliott Waves MANUALS with 12 months FREE COACHINGDr Mircea Dologa’s Educational BINOMIAL of Professional TradingMost of the professional traders claim they have improved their profitability by more than 40%since using the Elliott waves techniques.Our objective is to offer the average trader an original system of training based on a BINOMIAL: 4MANUALS and FREE COACHING over a period of 12 months.It took us about four years of hard work to conceive and write these four volumes (2102 pages,2334 charts and 116 Excel tables.Over this period of time the author's ambition was to come up with a method to take the traderfrom the starting blocks to the summit of his or her career as a professional trader!These volumes are based on the author's experience and research spanning more than two decades. Theknowledge acquired over this period has allowed him to always be one step ahead of the crowd. Therefore,the four volumes are written from the point of view of the active trader whose main concerns are risk andcapital management. The author is convinced that this principle makes a real difference when it comes toprofessional trading. His trading framework has the roots from more than 80 years of trading researchdone by illustrious traders and mentors such as Nelson R. Elliott, A.J. Frost, R. Prechter, Glenn Neely andZoran Gayer.Being the entrepreneurial person that you are - otherwise you wouldn't be reading these lines your mind is set on studying and mastering the Elliott Wave techniques! Don't hesitate Thesevolumes come with Free Coaching over a period of 12 months provided by the author!The road to success is long, winding and full of pitfalls. But if you're really determined and willingto put a lot of time and effort into reaching this goal, you'll be handsomely rewarded eventually.Don't forget that a trader is forever a student of the market!Email: mircdologa@yahoo.comDr Mircea Dologa, MD, CTA, Paris
Elliott Wave TradingA nuts-and-bolts professional approachExercises in REAL TIME CASES4Advanced Level---------------------------------------Dr Mircea Dologa
----------------------Elliott Wave TradingA Nuts-and-Bolts Professional ApproachExercises in REAL TIME CASESAdvanced LevelVolume -----------------------Copyright 2018 by Dr Mircea DologaDate of Publishing – January 10th, 2018Printed in FranceCopyrights NoticeALL RIGHTS RESERVED: No part of this material may be reproduced withoutwritten permission from the publisher and the author. No part of this book may bereproduced, stored in a retrieval system, or transmitted in any form or by any means,photocopying, electronic, mechanical, or otherwise, without the prior permission of thepublisher and the author.Library of Congress Cataloguing-in-PublicationProtected by United States Copyright LawCertificate of Registration issued under the seal of Copyright Office in accordancewith title 17, United States Code.ISBN (13) er.comParis – FRANCE
Elliott Wave Trading - A Nuts-and-Bolts Professional Approach - Volume 4Volume 4Advanced Level480 pages – 533 charts – 43 Excel files & TablesbyDr Mircea Dologa, MD, CTAContents – Volume 4-------------------------IntroductionChapter 1 – The Nuts-and-Bolts of a Profitable Elliott Wave Trader. 8. 10Write the trading plan, stick to it and trade the trading plan1. Micro Trading - Return to Basics:Structure, Behaviour and Projections of the Current Swing & Last Bars across the Time Frames1.1 Behaviour of the bars1.21.31.41.51.61.780/20 Bar RuleBody Size of the BarsBar TailsBig BarsSmall BarsColour of Bars1.8 Closing and Opening of the Current Bar with Regard to the Next Bar1.9 Opening Level of the Next Bar1.10 Bars of Double Tops and Double Bottoms1.11 Inside Bar – Clearing Out the Doubt of the Next Bar Occurrence1.12 ID / NR4 Pattern (Narrowest Range Bar Out of the 4 Bars)1.13 NR7 Pattern (Narrow Range Bar out of the 7 Bars)1.14 Opening Range Breakout [ORB or ORBP] Trade1.15 Contrary Market Move Exceeding the Proximal Extremity of Last Bar1.16 Contrary Market Move Exceeding the Proximal Extremity of Last Swing [Count Back Line (CBL)]1.17 Candlestick Bars1.18 Daily Bars1.19 Weekly and Monthly Bars1.20 Bar Count Technique2.3.4.5.GMMA- Guppy Multiple Moving AveragesForecast the Most Probable Scenario of the Market FlowPlan a Second Scenario and Specify when the First is InvalidatedEstablishing the Key-Levels & Limits of the End-Run Phenomenon5.1 Price Key Level Locations5.2 Combined Gann Angles and Fibonacci Levels as Trend Delimitation Factors - Confluence Build-Up5.3 Combined Gann Angles, Floor Pivots and Jenkins Circles as Trend Delimitation Factors – ConfluenceBuild-Up5.4 Curvilinear Limit Techniques – Confluence and Resistance/Support Build-Up5.5 Long-Term Curvilinear Limit Techniques – Circles, Geometric Angles and Fibonacci Ratios Build-Upsacross the Years5.6 Drawing of Orthodox and Unorthodox Trend Lines5.7 Directional, Retrograde and Schiff Drawn Pitchforks5.8 Gann Box5.9 Diamond Pattern – Richard Schabacker’s Forgotten Trading Tool5.10 Jenkins True Trend LinesCopyright 2018 by Dr. Mircea Dologa - ALL RIGHTS RESERVED -www.pitchforktrader.com
Elliott Wave Trading - A Nuts-and-Bolts Professional Approach – Volume 426. Applying the Top-Down Technical Analysis6.1 Why this Analysis is Indispensable for Trading?6.2 Understanding the Dominant Trend on Each Time Frame6.3 Internal Structure of an Ascending (A)-(B)-(C) Pattern across Time Frames7. Daily ATR(14) used as a Tool on Operational Time Frame (15-min chart)8. Opening Range, Gap Extensions and Daily ATR(14) as Combined Tools9. Detecting the Most Lucrative Time-Zone for Intraday Trading10. Detecting the Correction Ending (Wave C for Zigzag) in Trade Preparation Process11. Detecting the Correction Ending (Wave E for Corrective Triangle) in Trade Preparation Process12. What is the Most Lucrative Time Frame for Intraday Trading?12.112.212.312.412.512.6Track a 15-min chartTrack a 60-min chartTrack a 240-min chartTrack a daily chartTrack a weekly chartConclusion13. What is the Most Profitable Financial Instrument for Intra-Day Trading?14. Continuous Quote Monitoring of Entire Index Stock Array to Determine the Market Flow Behaviour14.1 Composition of a Stock Index – Identifying the Tier 1 Stocks14.2 Percentages of Stocks - A Real-Time Watch for Trending Stocks14.3 Tier 1 Stocks Act as a Proxy for Stock Index Fluctuations15. Trader’s Journal – Keep Notes on Thoughts15.1 Momentum Status – Kinetic Energy Sources Influencing Tomorrow‘s Trades15.1.1 External Energy Source - The Impact of Nikkei 225 & S&P 50015.1.2 Internal Energy Source - The Impact of Previous Daily Chart Pattern15.1.3 Internal Energy Source - The Impact of Previous 60-min Chart Pattern15.1.4 Internal Energy Source – Strength/Weakness of Dax 30 Stock Index Components(Hans Indicator)15.1.5 Evaluation of the Internal and External Momentum15.2 Trend Status15.2.1 Elliott Wave Identification15.2.2 Pitchfork as an Efficient Directional Tool15.2.3 Volatility Measure through Bollinger Bands, ATR (14) and MAs15.2.4 Quantifying the Trend Momentum15.3 Version 1 Short Trade Practiced by One of Our Students – OBV Not Used15.4 Version 2 Short Trade Advised by Us15.5 Optimal Choices of Entry Tools15.6 Could We Have Improved the Trade Profitability?15.7 Optimization of the Locations of the Trailing Stop Losses15.8 Which Exit is Optimal, the Manual Mode or the Pre-arranged Stop Loss?16. Study of George Soros’s British Pound Transaction – September 16th - 199216.1 Revisiting George Soros’ Trade16.1.1 Fundamental Analysis: Economic Climate as a Prevailing Trade Influence16.1.2 Technical Analysis: Trade Entry Timing16.2 George Soros’ Trade: Multiple Time Frames - Weekly and Daily GBP-USD Chart17. Key Points to RememberChapter 2 – Trading Wave W1. 101Early ending detection of the ABC pattern of prior cycle guides the W1 trade profitability1. Description of Wave W1 - Focus on Terminal Subwave w5 of Wave C of the Previous Pattern2. Specific Vital Space of Wave W1: Time & Price Trading Scene3. Errors to be Avoided in Wave W1 Trading3.1 Getting Confused when Wave W1 is Zigzagging Building Up a Leading Diagonal Triangle3.2 Consider Subwave (i): W1: W(1) as a Corrective Subwave of Wave (C)3.3 Missed the Confirm the First Volatile Bar as a Signature of Wave W1 Inception4. Beginner’s Trading Techniques4.1 Breakout Technique – Micro Trading using 3-min Chart [Bollinger Bands, OBV & RSI]4.2 Breakout Technique through Bollinger Bands using 15-min Chart [OBV & RSI]Copyright 2018 by Dr. Mircea Dologa - ALL RIGHTS RESERVED - www.pitchforktrader.com
Elliott Wave Trading - A Nuts-and-Bolts Professional Approach – Volume 434.3 Breakout Technique through Double Bollinger Bands using 15-min Chart [OBV & RSI]4.4 Breakout Technique through Bollinger Bands & Keltner Bands using 15-min Chart [OBV & RSI]4.5 Breakout Technique through Triple 34-ema Moving Averages (Snake’s Trade) using 15-min Chart [OBV &RSI]4.6 Price Failure Technique using 15-min Chart [OBV & RSI]4.7 Wedge Technique using 15-min Chart [ATR (14)]4.8 Trend Line Technique Associated with RSI using 15-min Chart [ATR (14)]4.9 A-B-C Swing Technique Associated with Pitchfork and Fibonacci Price Ratios using 15-min Chart4.10 Geometric Angles (45 and 22.5 ) Technique using 15-min Chart5. Concrete Professional Trades: Wave W1 & its Subwaves - Short & Long Examples6. Trading Approach of Elliott Wave W16.1 Elliott Wave Theory6.2 Description of the Impulsive Pattern6.3 General Knowledge about Impulsive Wave W16.3.1 Description of Wave W16.3.1.1 Origin of Wave W16.3.1.2 Characteristics of Wave W16.3.1.3 Advanced Market Indicators6.3.1.4 Pinpoint the End of Wave W16.3.1.5 Characteristics of the Corrective Subwaves: w2 and w4 of poly-wave W16.3.1.6 Relationships with Other Chart Formations and Key Levels6.3.1.7 Differential Diagnosis6.4 Trading Wave W17. Key Points to RememberChapter 3 - Can Wave W(2) be Traded through Subwaves A and C?. 174Only a professional approach can succeed in W2 trading1.2.3.4.5.6.Description of Wave W(2)Specific Vital Space of Wave W(2): Time & Price Trading SceneErrors to be Avoided in Wave W(2) TradingFocus on Wave W(1) and Its Terminal SubwaveConcrete Professional Wave W(2) Trade ExamplesConcrete Professional Primary W(2) Trades: Short Intermediate Waves (A) and (C) Examples6.1 Brief Description of the Corrective Wave W(2)6.2 Trading Wave W(2) Plan6.2.1 Related to Precedent Wave W(1)6.2.2 Related to Nascent Subwave A of Wave W(2)6.2.3 Related to Nascent Subwave C of Wave W(2)7. Key Points to RememberChapter 4 – Trading Wave W3. 222Depth degree of W2 guides the W3 trade profitability1. Crowd Behaviour and Elliott Waves (Part I)1.1 Fractal Nature of Waves1.1.1 Impulsive Pattern1.1.2 Classic Development of Wave W31.1.3 Macro Observation of Waves1.1.4 Extended Wave W3 Development1.2 How High is High?2. Trading the Trend in Wave W3 (Part II)2.12.22.32.4Pitchforks and ChannelsMultiple Time FramesTools of TrendGaps within Trends3. Trading Wave W3 (Part III)3.1 Getting Ready: Be Alert to the Possibility of an Extended W3 Trade3.2 Typical Trade EntryCopyright 2018 by Dr. Mircea Dologa - ALL RIGHTS RESERVED - www.pitchforktrader.com
Elliott Wave Trading - A Nuts-and-Bolts Professional Approach – Volume 443.3 Initial Stop-Loss3.4 Break-even and Trailing Stops3.5 Anatomy of a Trade – Stop-Loss Methodology4. Knowledge and Confidence5. Specific Vital Space of Wave (3): Time and Price Trading Scene5.15.25.35.45.5Wave W(3) Vital Space Measured by Gann Box Ratios 1.618x1.0Wave W(3) Vital Space Measured by Gann Box 360x18Wave W(3) Vital Space Measured by Gann AnglesWave W(3) Vital Space Measured by Gann Angles and Jenkins CirclesWave W(3) Vital Space Measured by Geometric Angles6. Errors to be Avoided in Wave W(3) Trading6.1 Misunderstanding the Proportionality Principle6.2 Mislabelling of an Impulsive Wave – Lack of Using a Consolidation Extension6.3 Mislabelling of a Terminal Impulsive Wave – Lack of Using OSC (5, 35)7. Focus on Precedent Wave W(2) and its Terminal Subwave C: W(2)8. Concrete Professional Wave W3 Trade: Long Examples9. Trading Approach of the Most Profitable Elliott Wave [W(3)]10. Trading Elliott Waves from the Low to the High10.1 Weight of Evidence Vouching for the New Trend10.2 Systematized Visualization Tool10.2.1 Swing Distribution Technique10.2.2 Territorial Distribution Technique10.3 Cartesian Space, the Ideal Way to Set the Trading Arena10.4 Which is the Optimal Level to Enter a Wave W(3) Trade?10.5 Which is the Optimal Level to Exit a Wave W(3) Trade11. Key Points to RememberChapter 5 - Can Wave W(4) be Traded through Subwaves A and C?. 298Only a professional approach can succeed in W4 trading!1.2.3.4.5.Description of Wave W(4)Specific Vital Space of Wave W(4): Time and Price Trading SceneErrors to be Avoided in Wave W(4) TradingFocus on Wave W(3) and Its Terminal SubwaveConcrete Professional Wave W(4) Trades: Short A: W(4) and Short C: W(4) Examples5.1 Short Trade of Wave A of an A-B-C Pattern of Wave W(4)5.2 Short Trade of Wave C of an A-B-C Pattern of Wave W(4)6.7.8.9.10.11.12.Trading Approach of the Depthless Corrective Elliott wave [W(4)]Where Time Meets Price - A Possible Missing Link between Elliott Waves and Gann?Gann Tools Revealing an Organized Structure within the Apparent Market ChaosTime and Price Relationship in Structuring the Elliott Waves – A Golden Trading ApproachRole of Time and Price Relationship in Gann’s MethodologyDr Michael Dologa’s Price and Time Technique – A Trend Line Taken as Box DiagonalKey Points to RememberChapter 6 – Trading Wave W5. 381Width & depth degree of W4 dictates the profitability of a W5 trade1. Description of Wave W52. Specific Vital Space of Wave 5: Time & Price Trading Scene2.1 Pitchfork as the Main Tool for Identifying the Directional Development2.2 Gann Box and Angles Draw the Optimal Pathway of Wave W5 Vital Space3. Errors to be Avoided in W(5)Trading3.1 Is wave W(5) terminated or not?3.2 Are there Two Scenarios Forecasted: Up- or Down-Sloping?3.3 Differential Diagnosis between subwave X: W(4) and w1: W(5)4. Focus on Wave W(4) and Its Terminal Subwave4.1 Price Extensions of Wave W(4) as a Target for W(5)Copyright 2018 by Dr. Mircea Dologa - ALL RIGHTS RESERVED - www.pitchforktrader.com
Elliott Wave Trading - A Nuts-and-Bolts Professional Approach – Volume 454.2 Pitchfork Using the Wave W(4) Extremities [P1 & P2] as W(5) Development Guide4.3 Elliott Wave w2-4: W(5) TLs & W(4) Radius Circle Used as W(5) Development Guides4.4 Elliott Wave w2-4: W(5) TLs & W(0-3) Radius Circle Used as W(5) Development Guide5. Concrete Professional Wave W(5) Trade: Long Example6. Key Points to RememberChapter 7 - Annexes: Excel Spreadsheets, Tables and CalculationsThe reader can obtain any annexe file from the author at:mircdologa@yahoo.com. 424Plate no. 1 – Circles and Market Symmetry(for more details see Chapter n 1 – Fig. 30 & Fig. 36)Plate no. 2 – Locations of Open and Close Levels, a Mirror of Market Behaviour(for more details see Chapter n 1 – Fig. 1A)Plate no. 3 – Daily ATR(14) used as a Tool on Operational Time Frame(for more details see Chapter n 1 – Fig. 71 & Fig. 72)Plate no. 4 – Drawing the 45 Degree Angle on Screen(for more details see Chapter n 2 - Fig. 185 & Fig. 186 )Plate no. 5 – Candlestick Continuation PatternsPlate no. 6 – Candlestick Neutral PatternsPlate no. 7 – Candlestick Reversal PatternsPlate no. 8 – Pullback and Correction Identification(for more details see Chapter n 3 – Fig. 247)Plate no. 9 – Count Back Line (CBL) Description(for more details see Chapter n 1 – Fig. 5)Plate no. 10 – Global Entry Table – to be Filled in before Every Entry(more details - see Chapter n 6 – Fig. 481)Plate no. 11 – Questions to be Answered before Entering the Trade(more details - see Chapter n 6 – Page 414)Plate no. 12 – Trade Entry Specific Factors(for more details see Chapter n 1 – Fig. 125)Plate no. 13 – Multiple Time Frame Floor Pivots(for more details see Chapter n 2– Fig. 210)Plate no. 14 – Square of Gann Levels – Downwards & Upwards Cycles(for more details see Chapter n 2 – Fig. 211)Plate no. 15 – Square of Gann Levels – Multiple Downwards Cycles(for more details see Chapter n 5 – Fig. 384)Plate no. 16 – Gann Cardinal Price Square of Nine in an Up-Trend(for more details see Chapter n 6 – Fig. 466)Plate no. 17 – Jenkins Circles Applying the Alternate Radius Technique –Curvilinear Confluence which Halted Wave W(2)(for more details see Chapter n 3 – Fig. 276)Copyright 2018 by Dr. Mircea Dologa - ALL RIGHTS RESERVED - www.pitchforktrader.com
Elliott Wave Trading - A Nuts-and-Bolts Professional Approach – Volume 4Plate no. 18 – Jenkins Circles using two Radii – Wave W(3) Development Monitoring(for more details see Chapter n 4 – Fig. 320 & 322)Plate no. 19 – Gann Box and Jenkins Circles(for more details see Chapter n 5 – Fig. 399)Plate no. 20 – Calculation of Subwave w5: W(1) Terminal Level using W(1) Subwaves(for more details see Chapter n 2 – Fig. 225)Plate no. 21 – Calculation of Wave W(1) Terminal Level using Waves (A), (B) & (C)(for more details see Chapter n 2 – Fig. 222)Plate no. 22 – SHORT Wave W(2) - Calculation of Wave C Target using A-B-C&Wave A(for more details see Chapter n 3)Plate no. 23 – LONG Wave W(2) - Calculation of Wave C Target using A-B-C & Wave A(for more details see Chapter n 3)Plate no. 24 – Wave W(4) Trading – Calculation of a Single R/R Ratio(for more details see Chapter n 5 – Fig. 380)Plate no. 25 – Wave W(4) Trading – Calculation of Multiple R/R Ratios(for more details see Chapter n 5 – Fig. 379)Plate no. 26 – Vital Space of Wave W(2) using Gann Box & Gann Angles(for more details see Chapter n 3 – Fig. 242 & 243)Plate no. 27 – Wave W3 Terminal Level through Miner Calculations(for more details see Chapter n 4 – Fig. 282)Plate no. 28 – Wave W3 Terminal Level through Fisher & Miner Calculations(for more details see Chapter n 4 – Fig. 283)Plate no. 29 – Calculation of Wave W(3) Termination using W(1), W(2) & Subwaves of W(3)(for more details see Chapter n 4 – Fig. 328)Plate no. 30 – LONG W(4) Trade - Calculation of C: W(4) Termination using W(3) and A(for more details see Chapter n 5)Plate no. 31 – SHORT W(4) Trade - Calculation of C: W(4) Termination using W(3) and A(for more details see Chapter n 5 – Fig. 381)Plate no. 32 – LONG W5 Trade - Calculation of Target Level using W1, W0-3 & W4(for more details see Chapter n 6)Plate no. 33 – SHORT W5 Trade - Calculation of Target Level using W1, W0-3 & W4(for more details see Chapter n 6)Plate no. 34 – SHORT W5 Trade - Calculation of Target Level using W1, W0-3, W4 andSubwaves w1, w0-3 & w4 of wave W5(for more details see Chapter n 6)Plate no. 35 – LONG W5 Trade - Calculation of Target Level using W1, W0-3, W4 andSubwaves w1, w0-3 & w4 of wave W5(for more details see Chapter n 6)Plate no. 36 – Trader’s Journal – to be filled in (for more details see Chapter n 6, Fig. 481)Copyright 2018 by Dr. Mircea Dologa - ALL RIGHTS RESERVED - www.pitchforktrader.com6
Elliott Wave Trading - A Nuts-and-Bolts Professional Approach – Volume 47Plate no. 37 – Trader’s Journal – LONG Trade (more details - see Chapter n 6 – Fig. 481)Plate no. 38 – Trader’s Journal – A Few Positive and Negative Attitudes(more details - see Chapter n 1 – Page 78)Plate no. 39 – Profit and Risk Optimization on Multiple Time Frames(more details - see Chapter n 1 – Fig. 95)Plate no. 40 – Profit and Risk Optimization on Multiple Time Frames(more details - see Chapter n 1 – Fig. 99-101)Plate no. 41 – Trading Potential of Dax Index Futures during an Eight-Day Period(more details - see Chapter n 1 – Fig. 98)Plate no. 42 – Trend Identification – Characteristics and use of Multiple Time Frames(for more details see Chapter n 4 – Fig. 286)Plate no. 43 – HANS Indicator – An Inside Evaluation of Dax Market Fluctuation(more details - see Chapter n 1 – Fig. 108-109)Plate no. 44 – George SOROS Trade – September 16th, 1992(more details - see Chapter n 1 – Fig. 132-142)Plate no. 45 – Harmonic Moving Averages – 5-sma, 15-sma & 30-smaPlate no. 46 – Tools Synopsis used in LONG / SHORT Dax 30 Trading(more details - see Chapter n 6 – Fig. 478)Plate no. 47 – Cluster Search through Floor Pivots, Daily ATR(14), Opening Range & Gap(more details - see Chapter n 1 – Fig. 74)Plate no. 48 – Market Mapping – Quest for End-Run PhenomenonPlate no. 49 – Three Pawn Technique – A Risk and Management Methodology(more details - see Chapter n 6 – Page 410)Plate no. 50– Three Pawn Technique Table for a SHORT Trade with an Add-On & Trail SL(more details - see Chapter n 3 – Fig. 272)Plate no. 51 – Three Pawn Technique Table for a SHORT Trade exited by a Trail Stop Loss(more details - see Chapter n 2 – Fig. 203)Plate no. 52 – Three Pawn Technique Table for a LONG Trade with an Add-On & Trail SL(more details - see Chapter n 6 – Fig. 420)I. Bibliography of Dr Mircea DologaA. Trading Books and VideosB. Trading Articles. 476. 476. 477II. Bibliography – Other Suggested Reading. 479Copyright 2018 by Dr. Mircea Dologa - ALL RIGHTS RESERVED - www.pitchforktrader.com
Elliott Wave Trading - A Nuts-and-Bolts Professional Approach – Volume 48Introduction“If you don’t try to be the best, it means that you ceased to be good.We are the masters of our own fate!”In one of his presentations, Zoran Gayer, a faithful follower and developer of ElliottPrinciple, has embraced Elliott thinking and has extended it with the application of chaostheory. The trader must look for the moment of maximum uncertainty, the edge of chaos,after which markets coalesce around a direction. That’s where the trader comes in He/shemust observe the end of these coalescent zones and then, and only then, must enter themarket in the dominant direction. This well assimilated behaviour is the warranty of asuccessful trader. But this will not come without “sweat and tears”; the wisdom fromsagacious China says: “What first brings pleasure, in the end gives only pain, but what at firstcauses pain, ends up in great pleasure”.Common sense compels us to acquire a consistent trading technique that gives us theconfidence to learn how to trade successfully. We must stack the odds in our favour. Elliottwave principle is one of the profitable choices.Volume 4 is uniquely specialized in presenting real time trading cases, thus showing theapprentice trader how to apply the assimilated knowledge to an ongoing market.Like the sniper, the trader will have the patience to wait for the well-assessed and waited fortrading set-up and only then, he/she will take action. The volume is composed of 7 chapters(480 pages, 533 charts and 43 Excel & Table files). The successful outcome is simple Onetarget, one hit.The main purpose of writing this manual was dictated by the author’s desire to help thetraders in their process of applying the trading rules for each of the impulsive Elliott waves:W1, W3, and W5. Even if it is not advisable for the beginner or for the experienced trader totrade the corrective waves, the author emphasizes here the high caution of doing just that,but only once the trader has acquired the necessary experience. Thus, the W2 and W4trading will not have any secrets for the astute trader. The trading approach of theimpulsive waves, A and C, of the corrective A-B-C patterns are not neglected either.Numerous and efficient little known topics are described and illustrated here by means ofmany charts: Conceiving the most probable scenario, always having an alternate one with theirinvalidation/reinitiating conditions; Detecting the end-run phenomenon and the source of building the kinetic energyindispensable to the momentum strength of Elliott waves; The top-down technical analysis; The identification of the dominant trend; The role of the last bar and also the last swing to forecast the identification of theincoming swing/trend; The most optimal trading time frame to be used.All these are scrupulously and methodically written in trader’s journal. The module of riskand money management is considered here as one of the most important elements, a truthfulgearwheel indispensable to the well oiled mechanism of getting a highly profitable trade.Copyright 2018 by Dr. Mircea Dologa - ALL RIGHTS RESERVED - www.pitchforktrader.com
Elliott Wave Trading - A Nuts-and-Bolts Professional Approach – Volume 49In practicing these real time cases presented in this manual, we have conceived and leanedon a strategic analysis composed of six tactical precursory trade parameters.1. Pre-Market Momentum Evaluation :o External: Nikkei 225, US News at 14:30hrs (CET),o Internal: Energy sourced out of previous day.2. Quantifying the Internal Strength / Weakness of the Ongoing Market3. Evaluation of the most Current Deploying Momentum (Vertical & Horizontal Axis)4. End-Run Limits forming Resistances, Supports, Clusters and Confluences5. Strict Monitoring for Reversals / Continuation6. Money and Risk Management.The Annex chapter, at the end of this volume, will efficiently serve the trader with its Excelspreadsheet and tables. They were conceived not only to enhance the assimilation of theentire material, but also to give the trader a better chance to be ahead of the crowd. Alwaysremember that “The Elephants don’t like to be accompanied!” The loneliness of theaccomplished trader is the same as that of the marathoner’s who is trying to win every race.Dr Mircea Dologa, MD,Commodity Trading AdviserJune 21th – 2018Paris – FranceEmail: mircdologa@yahoo.comCopyright 2018 by Dr. Mircea Dologa - ALL RIGHTS RESERVED - www.pitchforktrader.com
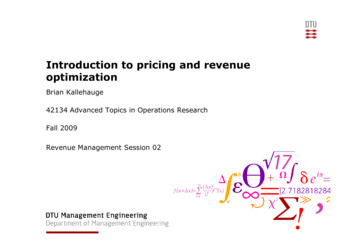
Elliott Wave Trading - A Nuts-and-Bolts Professional Approach – Volume 430Fig. 25 - The above floor pivot table calculates the values of daily, week and monthly time frames.As we already know, the best landmarks to halt or reverse the market are the clusters and theconfluences. We can classify the pivotal cluster as one of the best stopping landmarks. Its halting poweris dramatically enhanced when it is formed of multiple time frame components. We observe in the abovepivotal table corresponding to the chart in Fig. 24, several possible clusters: Cluster Zone 12956-12948 marked as n 1 on the table, corresponding to the monthly mid pivot P/S1and daily mid pivot S4/S5,Cluster Zone 12997-13003 marked as n 2 on the table, corresponding to the weekly pivot S2 anddaily mid pivot S3/S4,The daily pivot S5 at 12916 key level is the optimal floor pivot susceptible to reverse the market if thecluster zone 12956-12948 (n 1) will be broken down.Copyright 2018 by Dr. Mircea Dologa - ALL RIGHTS RESERVED - www.pitchforktrader.com
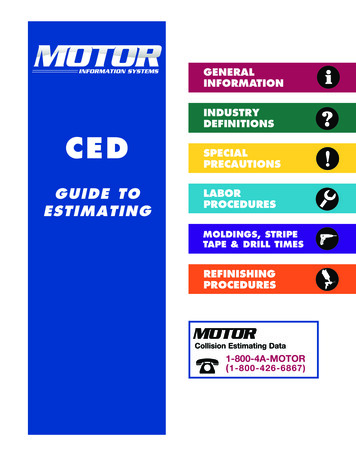
Elliott Wave Trading - A Nuts-and-Bolts Professional Approach – Volume 442Fig. 48 – The above weekly Dax chart is the same as the previous chart but one week later. The bigvolatile bar broke up the upper right side of the diamond moving hastily towards the 0.75 Fibonacciprice ratio at the 5701 key level of the relation C of A. The magnet-like effect of the median line of thepitchfork exerts a strong attracting action upwards. The presence of the pitchfork signals the trendcontinuation and we could forecast the terminal level of the ongoing trend by using the expansions ofthe height of the diamond.Fig. 49 – The above weekly Dax chart is the same as the previous chart but one week later. Theoccurrence of a second big volatile bar raised the market towards the median line at the level of thecluster zone 5748-5758. Another cluster is waiting to halt or reverse the market at 6094-6097 level.Copyright 2018 by Dr. Mircea Dologa - ALL RIGHTS RESERVED - www.pitchforktrader.com
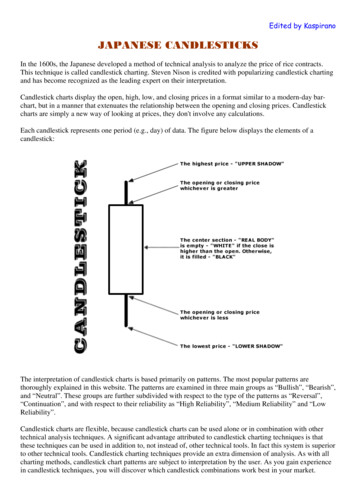
Elliott Wave Trading - A Nuts-and-Bolts Professional Approach – Volume 469Fig. 98 - The above table shows the trading parameters of a 15-min Dax Futures chart (see Fig. 96)during the period of March 19 to 28, 2018. The optimal trading specificity of Dax Futures consists in itsconstant behaviour: the greatest intra-day ATR value amount around, 2-5 swings daily, 193 to 651points intra-day and a predictable morning and after-noon behaviour. Even if we deduct 30% from theintraday amount (entry & exit losses), we still get 4812 to 16275 euros, a comfortable profit for theexperienced trader.Going even further in our comparative study we observe below (Fig. 99 to Fig. 103) the hugeopportunity of trading Dax Futures with regard to S&P500 and currency pairs.Fig. 99 - The above table illustrates the comparative parameters expressed in Euro amount ratios andpercentages compared with the Dax Futures. In spite of the common beliefs, Dax Futures is the optimaltrading financial support choice, followed by JPY/USD, EUR/USD and lastly S&P 500. The GBP/USDamount is placed the last in this comparative list representing only 11% of Dax amount.Copyright 2018 by Dr. Mircea Dologa - ALL RIGHTS RESERVED - www.pitchforktrader.com
Elliott Wave Trading - A Nuts-and-Bolts Professional Approach – Volume 49116. Study of George Soros’s British Pound Transaction – September 16th - 199216.1 Revisiting George Soros’ TradeThis transaction remains one of the most profitable trading work, which was ever done,using the Fundamental Analysis combined with Technical Analysis.Fig. 131: Mixing the two analyses makes a good outcome16.1.1Fundamental Analysis:Economic Climate as a Prevailing Trade InfluenceAs they say, Black Wednesday of September 16th, 1992 was baptized “the day when thespeculators broke the British Pound.”In the race to keep the pace with the German economy, the British economy triggered lowerinterest rates provoking a
5. Concrete Professional Trades: Wave W1 & its Subwaves - Short & Long Examples 6. Trading Approach of Elliott Wave W1 6.1 Elliott Wave Theory 6.2 Description of the Impulsive Pattern 6.3 General Knowledge about Impulsive Wave W1 6.3.1 Description of Wave W1 6.3.1.1 Origin of Wave