Transcription
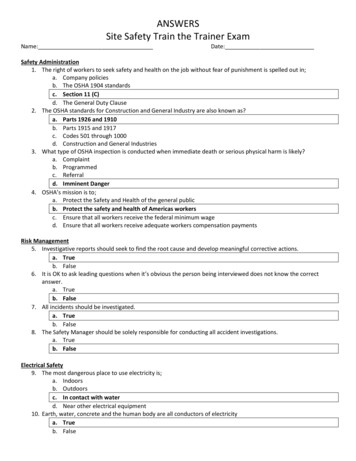
1Truck Safety Considerations for Geometric Designand Traffic OperationsEric T. Donnell, Michelle L. Adolini, Darren J. Torbic,John M. Mason, Jr., Ph.D., P.E., and Lily Elefteriadou, Ph.D.INTRODUCTIONTruck dimensions and operating characteristics affect the physical roadway infrastructureand their impacts should be appropriately considered in the geometric design and trafficoperations of roads and streets. Characteristics such as vehicle size and weight, sightdistance, horizontal and vertical curve design, cross-section design, intersection design,and traffic operational quality is critical to assess highway performance, particularlywhen trucks constitute a significant portion of the vehicle mix. This paper summarizesrecent literature useful in evaluating truck characteristics that impact highway design andoperations.TRUCK DIMENSIONS AND OPERATING CHARACTERISTICSThe following section describes both existing and proposed truck dimensions, truckacceleration and deceleration characteristics, and truck swept path widths and turningradii. Each of these characteristics is related to the operational quality of trucks.Physical DimensionsThe American Association of State Highway and Transportation Officials (AASHTO)document, A Policy on Geometric Design of Highways and Streets (herein referred to asthe Greenbook), currently outlines 15 design vehicles that are used in highway design (1).Included are one passenger car, eight trucks, two buses, and four recreational vehicles.Figure 1 shows typical design vehicle dimensions for three of the AASHTO trucks, onepassenger car, and one large bus. The vehicles shown in Figure 1 are those that are mostprevalently used as the design vehicle.Figure 1. Design Vehicle Dimensions (2).
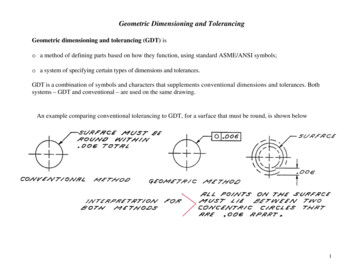
2The physical dimensions that most affect the minimum turning paths of design vehiclesare the minimum turning radius, the wheelbase, and the inner path of the rear tire. Trucksare wider, and have greater turning radii than do buses and passenger cars. Therefore, thegeometric design requirements for trucks are more severe than for other design vehicles,especially at intersections and when considering horizontal alignment.Elefteriadou et al. (3) evaluated truck combinations that have greater offtracking andswept-path widths than single 48 foot trailers. Rocky Mountain doubles, B-train doubles,turnpike doubles, triples, and larger tractor-semitrailers were considered. The evaluationconsidered four specific roadway geometric elements that may not adequatelyaccommodate large trucks (3): Horizontal curves on mainline roadways;Curb return radii for right turns at surface intersections;Curb return radii and ramp terminal right-turn radii on arterialcrossroads; and,Horizontal curves on freeway on- and off-ramps.The findings suggest that there may be a substantial cost to accommodate some of thesepotential truck configurations on the existing roadway network. For instance, to upgradethe entire U. S. freeway and nonfreeway highway network to accommodate the baselinetruck (48-ft trailer), it would cost an estimated 653 million (3). This reconstructionwould include upgrades to horizontal curves on mainline roadways to accommodateofftracking, curb return radii and right-turn roadways for at-grade intersections, curbreturn radii and right-turn radii for ramp terminals on the arterial crossroad at freewayarterial interchanges, and horizontal curves on freeway on- and off-ramps.Acceleration and Deceleration CharacteristicsTrucks exhibit very different operating characteristics as those displayed by passengercars when accelerating from a stopped position and on both upgrades and downgrades.Both the weight/horsepower ratio and the steepness and length of vertical grades greatlyinfluence acceleration capabilities. For high speed acceleration on level highways, trucksmay display similar acceleration characteristics to those of passenger cars. Trucks candisplay a five percent increase in speed on downgrades and a seven percent or moredecrease in speed on upgrades when compared to operations on level terrain (1).From a stopped position, trucks exhibit significantly different acceleration characteristicsthan those of passenger cars. Figure 2 shows design time and distance relationships fortrucks from a stopped position as per the Greenbook (1). Long (4) found that observedaccelerations for WB-50 trucks are 40 to 75 percent slower than those shown in Figure 2.
3Figure 2. Time-Distance Curves for Acceleration from Stopped Position (1).Truck deceleration rates are dependent upon the tire-pavement friction, pavementproperties, braking efficiency, and tire properties. AASHTO policy (1) explicitlyconsiders deceleration and braking distances for use in design based on passenger cars,but suggests that trucks may display additional braking lengths because of their largersize and vehicle weight. Fambro et al. (5) reported that antilock braking systemsprovided improved stopping capability and that loaded stopping distances weresignificantly shorter than the empty truck stopping distances. Harwood et al. (6)developed truck deceleration rates for empty tractor-trailers on a wet pavement for theworst- and best-performance drivers, as well as for an antilock braking system. Theresults of these tests are presented in Table 1.Table 1. Truck Deceleration Rates for Use in Highway Design (6).Vehicle Speed(mph)2030405060701 mph 1.61 km/hAASHTO Policy(passenger cars)0.400.350.320.300.290.28Deceleration Rate est-PerformanceDriverAntilock .310.320.32The values in Table 1 are based on an assumed driver control efficiency of 0.62(conservative, worst case scenario) and a driver control efficiency of 1.00 (best-case
4performance scenario). The antilock braking system is shown to have very similardeceleration rates as that for passenger cars.Swept-Path WidthsLarger turning vehicles exhibit offtracking characteristics. Offtracking is a function of atruck’s spacing between tire axles. The maximum distance between a truck’s front (lead)axle and its rear (trailer) axle determines offtracking. It is measured from the center ofthe rear trailer axle with respect to the center of the lead axle. Offtracking can occur inlow-speed operating environments (intersections), or in high-speed operatingenvironments (highway horizontal curves). Of interest in the low-speed environment areintersection curb return radii. Horizontal curve widening is of interest in the high-speedoperating environment.Table 2 shows typical minimum turning radii of various truck design vehicles as noted inthe Greenbook. The table shows that the semi-trailer, full trailer combination has thelargest minimum inside turning radius (22.2 feet) as measured by the inside wheel path.The turnpike double semi-trailer has the largest minimum design turning radius (60 feet)as measured from the outside wheel path.Table 2. Minimum Turning Radii of Truck Design Vehicles ius(ft)MinimumInsideRadius(ft)1 m 3.28 rgeSemi-TrailerFull 6018.919.222.29.10020.717Elefteriadou et al. (3) examined the impacts of current and proposed truck configurationson the geometric and traffic operational elements on the current U. S. roadway network.Based on 90-degree, right-turn maneuvers at intersections, it was found that a 45-footsemi-trailer and western twin trucks can successfully negotiate the turn at intersectionswith a 30 foot curb return radii; all other trucks would encroach on the opposing travellanes (3). When expanding the curb return radii to 60 feet, only the 57.5 foot semi-trailertrucks, Rocky Mountain doubles, and Turnpike doubles would encroach the opposingtravel lanes while completing the right-turning maneuver. Lastly, for curb return radii of100 feet, all but the Turnpike double with 53 foot trailers can negotiate the turn withoutencroaching the opposing travel lanes (3).
5Pavement widening on curves is used in high-speed areas so that trucks can negotiatecurves under conditions that are similar to tangent sections. The Greenbook (1) suggestscurve widening values on two-lane pavements (one- or two-way) for open highways.These values are a function of the degree of curve, the pavement width, and the designspeed of the roadway. Table 3 presents the curve widening values for cases where thewidening is 2.0 feet or greater.Table 3. Design Values for Pavement Widening on Highway Curves (1).Degree24 FeetofDesign Speed 2.019-212.522-253.026-26.53.51 mph 1.61 km/h70302.02.02.02.53.03.54.04.522 FeetDesign Speed 2.5702.02.020 FeetDesign Speed 4.03.03.53.54.04.04.55.05.5Elefteriadou et al. (3) found that all combination trucks, traveling at the roadway designspeed, would not encroach on adjacent lanes or shoulders of roadways or ramps designedin accordance with the Greenbook’s high-speed design criteria. On the other hand, iftrucks were traveling at very low speeds on the sharpest horizontal curves (30 mph designspeed with 73-ft radius) suggested by the Greenbook, only the turnpike double truckswould require curve widening on ramps from 15 to 16 feet.SIGHT DISTANCEThe following section describes sight distance considerations for trucks. Included isrecent literature pertaining to stopping sight distance (SSD), intersection sight distance(ISD), and passing sight distance (PSD).Stopping Sight DistanceSSD is determined by the reaction time and braking distance required for an alert driver,traveling at or near the design speed, to react and stop before hitting a stationary objecton a wet roadway (1). The recommended minimum SSD calculated according to theGreenbook procedures are based on passenger car operation; yet, large trucks requirelonger braking distances than passenger cars. The current policy is based on the distance
6traveled during perception and reaction, and the distance traveled during braking. Thecurrent Greenbook SSD equation takes the following form (1):SSD 147. Vt V230( f G )where: V design speed (mph);t perception/reaction time (assumed 2.5 sec);f coefficient of friction between tires and roadway; and,G grade (decimal).The above equation assumes a driver eye height of 3.5 feet and an object height of 6inches.Research has shown that most large trucks are capable of stopping within AASHTOdesign braking distances on dry pavements. With anti-lock braking systems, they arealso capable of stopping within AASHTO design braking distances on wet pavements.The additional stopping distance is balanced by the fact that the truck operator is able tosee vertical features of obstruction farther ahead than passenger cars because of thehigher position of the seat in the vehicle. When horizontal sight restrictions occur ondowngrades, particularly at the ends of long downgrades, there is little advantage to thegreater eye height of the truck operator. In this situation, the SSD provided should bemore than the minimum (5).The SSD model that is being incorporated into the 2000 edition of the Greenbook is anexplicit model that takes the following form (5):V2SSD Vt 30[(a / g ) G )where: V initial speed (mph);t brake reaction time (assumed 2.5 sec);a driver deceleration (assumed 11.2 ft/sec2); and,g gravitational constant (32.2 ft/sec2).The underlying assumptions of the model are that the driver eye height is 3.5 feet, and theobject height is 2.0 feet. Where heavy vehicles are the design vehicle, an eye heightbetween 7.5 feet and 8.5 feet is appropriate. Table 4 compares the braking distances forpassenger cars and trucks (5). Truck braking performance is based on both the best andworst-case drivers, and on anti-lock brake systems. For both the best and worst-caseperforming drivers, it can be concluded from Table 4 that truck braking distances aregreater than those for passenger cars. When trucks are equipped with anti-lock brakes,the braking distance for trucks decreases considerably.
7Table 4. Truck Braking Distance on Wet Pavement (5).Design Speed(mph)AASHTO Criteriafor Passenger Cars(ft)2030405060703386167278414583Braking Distances for Trucks (ft)WorstBest-performanceAnti-lock 42131725383332677444623751013628510Intersection Sight DistanceThere are five cases for determining intersection sight distance (ISD): Case I: Intersection with no control Case II: Intersection with yield control Case III: Intersection with stop controlo IIIA: Crossing maneuvero IIIB: Left-turn onto a major highwayo IIIC: Right turn onto a major highway Case IV: Intersection with signal control Case V: Stopped vehicle turning left from a major road.The ISD for stop-controlled intersections is a conservative estimate for all five types ofintersection control. There are three subcases to consider when determining the ISD for astop-controlled intersection. The left and right turning subcases (IIIB and IIIC) require alonger ISD and therefore, generally govern design. The AASHTO policy for determiningISD only considers truck requirements explicitly in case IIIA. The current policysuggests the following equation to calculate the ISD for Case IIIA (1):ISD 147. V ( J ta )where: ISD sight distance to left (d1) or right (d2) along the major road from theintersection required for the minor road vehicle to cross the major road(ft);V design speed of major road (mph);J sum of perception time and time required to actuate the clutch or andautomatic shift (assume J 2.0 sec);ta time required to accelerate and traverse the distance to clear the majorroad (sec);S D W L, the distance that the crossing vehicle must travel to clearthe major road (ft);D distances from the near edge of pavement to the front of a stoppedvehicle (ft)—assume D 10 ft;W intersection width along path of crossing vehicle (ft); and,L overall length of minor road vehicle (ft).
8Trucks are not considered in the current AASHTO policy for the controlling subcases,IIIB and IIIC. It is recommended that criteria be developed for consideration in thedesign of stop-controlled intersections with a substantial number of trucks either crossingor entering the major road. Harwood et al. (7) recommended travel times (critical gaps)to determine sight distances for turning left or right, and for crossing two-lane highways.Table 5 compares left and right turn travel times that can be used to determine the leg ofthe departure sight triangle along the major road for passenger cars, single-unit trucks,and combination vehicles. Table 6 compares crossing maneuver travel times used todetermine the leg of the departure sight triangle along the major road.Table 5. Recommended Travel Times for Determining Sight Distance for Crossing theMajor Road at a Stop-Controlled Intersection (7).Vehicle TypeTravel Time (sec) at Design Speed of Major RoadPassenger Car7.5Single-unit Truck9.5Combination Truck11.5Note: Add 0.5 sec for passenger cars and 0.7 sec for trucks for each additional lane to be crossedTable 6. Recommended Travel Times for Determining Sight Distance for Crossing theMajor Road at a Stop-Controlled Intersection (7).Vehicle TypeTravel Time (sec) at Design Speed of Major RoadPassenger Car6.5Single-unit Truck8.5Combination Truck10.5Note: Add 0.5 sec for passenger cars and 0.7 sec for trucks for each additional lane to be crossedSpecial consideration should be given to the ISD required for trucks at intersectionapproaches with steep grades on which the stopped vehicle is waiting, and also on thedeparting roadway on the opposite leg. Here, if the grade is sufficiently steep, trucks mayneed additional time to clear the intersection due to higher weight-to-horsepower ratios.This may result in ISD values greater than those shown in Tables 5 and 6 (7).Passing Sight DistanceWhen passing zones are needed on two-lane rural highways, PSD is necessary to ensurethat the passing vehicle has a clear view ahead to safely execute the maneuver. Harwoodet al. (6) developed minimum passing zone lengths required to complete a pass forvarious passing scenarios for trucks and passenger cars. Included in the analysis were thefollowing assumptions (6): The distance required to complete the pass is the sum of the initialmaneuver distance and the distance traveled in the left lane (d1 and d2 inAASHTO policy).The initial maneuver distance (d1) can be computed as follows:
9d 1 1.47t1V m at12where: t1 time required for initial maneuver (sec);a average acceleration (mi/hour/sec);V average speed of passing vehicle (mph); and,m difference in speed between passed and passingvehicle (mph). The acceleration rates used by trucks are half that of passenger cars.The distance traveled while in the passing lane (d2) can be computed asfollows:d2 V (2.93(V m) L p L I m0.73m 2a )where: Lp length of passing vehicle (ft);LI length of passed vehicle (ft); and,m speed difference between vehicles (mph). The passing vehicle trails the passed vehicle by 1-second prior to passing,and leads the passed vehicle by 1-second after passing.Trucks maintain only half of the speed difference of passenger cars.Passenger cars are 19 feet in length, and trucks are 75 feet in length.Table 7 shows the passing zone length required to complete a pass for various truckrelated passing scenarios. Using the previously stated assumptions, trucks requirepassing zones at least 2,000 feet in length for passing speed greater than 60 miles perhour.Table 7. Truck Passing Distances (6).Design Speed(mph)PassingVehicle Speed(mph)SpeedDifference (m)used byPassingVehicleTruck2030405060701 m 3.28 ft2030405060706.56.05.55.04.54.0Minimum Length of Passing Zone (ft)PC passingtruck225475825125018502650Truck passingPC275600975145020252900Truck passingtruck3507251175175024503400
10HORIZONTAL AND VERTICAL CURVE DESIGNThe primary controlling element in vertical curve design is stopping sight distance. Sincetruck headlights are likely not capable of illuminating the roadway for the stoppingdistances required in sag vertical curves, minimum sag vertical curve lengths wereproposed by Harwood et al. (6). The design values are shown in Table 8, as are valuesfor minimum crest vertical curve lengths. The implicit assumption used is that truckdriver eye heights are 93 inches, and object heights are 6 inches.In addition to the vertical curve lengths found in Table 7, Harwood et al. (8) also foundthat grades significantly slow truck operations ( 6.4 percent) only make up a very smallproportion ( 1 percent) of the roadway network on high functional class roadways (ruraltwo-lane highways, arterials, and freeways).Horizontal curve design is also a primary truck consideration. The unbalanced portion oflateral acceleration that may cause vehicles to skid off of the road or even overturn isexpressed as:f V2 e15 Rwhere: f side friction demand;V vehicle speed (mph);R radius of curve (ft); and,e rate of superelevation (ft/ft).The major concern regarding horizontal curve design is truck rollover thresholds. Sometrucks may have rollover thresholds as low as 0.30 g, thus there is little margin of safetyon high speed roadways since AASHTO policy permits lateral acceleration as high as0.17 g (6). As such, the design speed on highway ramps should be chosen with caution.Using the lower range of values presented by AASHTO (1) may not be appropriate onroadways that carry substantial truck traffic volumes.
11Table 8. Minimum Crest and Sag Vertical Curve Lengths (6).AlgebraicDifferencein Grades(%)Design Speed (mph)2030405060Conventional Brake System with 70% Driver Control Efficiency (Crest Curves, 50670143025509031084017903180Antilock Brake System (Crest Curves, 20370740127010601804609201590Conventional Brake System with 70% Driver Control Efficiency (Sag Curves, 140350740116016501017043092014502060Antilock Brake System (Sag Curves, 022044074010001013027055092012501 m 3.28 701130169022602820340690103013801720MEDIAN INTERSECTION DESIGN CONSIDERATIONSMedians at intersections on highways with partial or no access control present significantoperational and safety concerns. Selection of the appropriate design vehicle for crossingand turning movements, including U-turn demand, is one of the key factors in selectingthe median width and length of the opening at a divided highway intersection.The Greenbook states that medians should be wide enough to allow the selected designvehicle to safely make a given maneuver. However, there are no specific criteria formedian widths to accomplish this. The minimum median width permitted by theGreenbook for most highways is 4 feet. At an intersection, a left-turn lane is consideredto be part of the median width; in this case, a median width of 12 to 30 feet isrecommended. On roadways other than freeways, a median width that is wide enough tostore the design vehicle as it crosses the divided highway should be considered. TheGreenbook cautions that median widths of 30 to 50 feet do not provide storage space forlarger vehicles crossing the median. Yet wider medians, from 50 to 80 feet, may be adisadvantage at intersections because they may confuse drivers and develop accidentproblems (1).
12The design of the median opening length in the Greenbook is based on the path of thedesign vehicle turning left at a speed of 10 to 15 mph. Table 9 shows the minimumopenings based on control radii provided in the Greenbook.Table 9. Design Controls for Minimum Median Openings (1).Design VehiclePredominantOccasional1 m 3.28 ft40PSUControl Radius (ft)50SUWB-4075WB-40WB-50Harwood et al. (9) conducted research on median widths of multilane facilities havingpartial or no access control to obtain better guidance in the use of median widths. Itshould be noted that preliminary field observations during this study found no significantproblems related to truck operations at field study intersections. The following ranges ofvalues for raised or depressed medians were determined to be appropriate for specificvehicle types (9): 4 to 12 feet is not wide enough to provide a left-turn lane;14 to 24 feet is wide enough to provide a left-turn lane, but not wideenough to store a crossing or turning passenger car with adequateclearance to through traffic;26 to 44 feet is wide enough to store a crossing or turning passenger car,but not wide enough to store a school bus with adequate clearance tothrough traffic;46 to 80 feet is wide enough to store a school bus or several passenger carsbut not wide enough to store a large semi-trailer truck with adequateclearance to through traffic; and,More than 80 feet is wide enough to store all current AASHTO designvehicles other than longer combination vehicles (LCVs), but potentiallyconfusing to some motorists.TRAFFIC OPERATIONAL CONSIDERATIONSPassenger car equivalents (PCEs) are used in the Highway Capacity Manual (10) toevaluate the impact of trucks, buses, and recreational vehicles on traffic operations.These equivalency factors are given specific consideration in the analysis of freeways,multi-lane highways, two-lane highways, and signalized intersections. In general, PCEshave been given consideration for specific length and steepness of grades, but have notconsidered various truck types with variable size and performance characteristics.Several studies have indicated that freeway truck populations have average weight-tohorsepower ratios between 125 and 150 lb/hp. The HCM has adopted PCEs calibratedfor a mix of trucks and busses within this range. For example, Table 10 shows PCEs forfreeways and multi-lane highways based on the type of terrain (10):
13Table 10. Passenger Car Equivalents for Freeways and Multi-lane Highways (10).CategoryET for trucks and busesER for recreationalvehiclesLevel1.5Type of TerrainRolling2.5Mountainous4.51.22.04.0In addition the values shown in Table 10, PCEs have been developed for large vehiclesfor specific upgrades and downgrades. When determining the service flow for a sectionof roadway, the adjustment factor for heavy vehicles takes the following form (10):f HV 11 PT ( ET 1) PR ( E R 1)where: PT percentage of trucks and buses in the traffic stream (decimal);ET PCE for trucks and buses;PR percentage of recreational vehicles in traffic stream (decimal); and,ER PCE for recreational vehicles.Elefteriadou, et al. (11) developed a methodology for calculating PCE values forfreeways, two-lane highways, and arterials to provide for various truck types whileexamining the impact of grade, length of grade, truck percentage, and level of trafficflow. Using FRESIM, PCEs for freeways with two lanes per direction, low traffic flow,and 15 percent trucks were developed. Table 11 shows the simulation results. TWOPASand NETSIM were used to develop PCEs for two-lane highways and arterials,respectively.Table 11. PCEs for Freeways with Two Lanes, Low Traffic Volume, and 15 PercentTrucks (11).Grade andLength 5km1 m 3.28 ft0%Vehicle TypeDoubleSemi-TrailerTrailerL 19.8mL 22.9mWt/hp 50Wt/hp 244TripleTrailerL 30.5mWt/hp 89TripleTrailerL 30.5mWt/hp 244212142410162611519292111838255137629Single UnitTruckL 12.2mWt/hp 50Single UnitTruckL 12.2mWt/hp 300121161
14In addition to the PCEs presented above, Elefteriadou and Webster (12) performed asimulation study of truck PCEs on basic freeway segments. The results of the study arereferenced in the HCM 2000 (10). The PCEs were developed based on FRESIM modeloutput and flow-density curves. A series of traffic and design variables were consideredwith PCE values for the typical truck shown in Table 12.Table 12. PCE Values for Typical Truck (12).Grade(%)Level 3 6LengthofGrade(ft)2640132026403960132026403960Flow Rate (vphpl) and Percent A1.52.5N/A2.0N/AN/AN/A2.03.01.5N/AN/AN/AN/AAll1.0 1.0 1.0 1.0 1.0 1.0 1.0 1.0 1.01.01.0downgradesN/A Values not obtained because specified flow exceeds capacity for at least one subject vehicle.1 m 3.28 ft1.0CONCLUSIONThis paper describes both the current and, where applicable, recommended geometricdesign and operational considerations for trucks. Truck swept-path widths, accelerationand deceleration characteristics, curb-return radii at intersections, and horizontal curvewidening on horizontal curves are all impacted by the physical dimensions and operatingcharacteristics of trucks. In addition, stopping sight distance, intersection sight distance,and passing sight distance are all impacted by the presence of heavy vehicles in the trafficstream. Trucks have significantly different performance characteristics than passengercars both on vertical curves and at median intersections. Lastly, the presence of trucksreduces roadway capacity on freeways, arterials, and at-grade intersections as evidencedby the use of passenger car equivalents.The impacts of the presence of heavy vehicles on passenger car operations shouldcontinue to be investigated. Relationships such as minimum headways, speeds selectedby passenger cars when traveling next to trucks, available sight distance for passengercars when traveling behind trucks, and other vehicle mix characteristics should beconsidered.
15REFERENCES1.A Policy on Geometric Design of Highways and Streets. American Association ofState Highway and Transportation Officials, Washington, D. C., 1990.2.Traffic Engineering Handbook. Institute of Transportation Engineers,Washington, D. C., 1994.3.Elefteriadou, L, D. W. Harwood, W. D. Glauz, J. Hawkins, J. McFadden, D. J.Torbic, and N. A. Webster. Evaluation of Limitations in Roadway Geometry andImpacts on Traffic Operations for Proposed Changes in Truck Size and WeightPolicy. The Pennsylvania State University, July 1997.4.Long, G. Acceleration Characteristics of Starting Vehicles. In TransportationResearch Record 1737, TRB, National Research Council, Washington, D. C.,2000, pp. 58-70.5.Fambro, D. B., K. Fitzpatrick, and R. J. Koppa. NCHRP Report 400:Determination of Stopping Sight Distances. TRB, National Research Council,Washington, D. C., 1997.6.Harwood, D. W., J. M. Mason, W. D. Glauz, B. T. Kulakowski, and K.Fitzpatrick. Truck Characteristics for Use in Highway Design and Operation.Reports FHWA-RD-89-226 and FHWA-RD-89-227. FHWA, U. S. Departmentof Transportation, 1990.7.Harwood, D. W., J. M. Mason, R. E. Brydia, M. T. Pietrucha, and G. L. Gittings.NCHRP Report 383: Intersection Sight Distance. TRB, National ResearchCouncil, Washington, D. C., 1996.8.Harwood, D. W., W. D. Glauz, L. Elefteriadou, D. J. Torbic, and J. McFadden.Distribution of Roadway Geometric Design Features Critical to Accommodationof Large Trucks. In Transportation Research Record 1658, TRB, NationalResearch Council, Washington, D. C., 1999, pp. 77-88.9.Harwood, D. W., M. T. Pietrucha, M. D. Wooldridge, R. E. Brydia, and K.Fitzpatrick. NCHRP Report 375: Median Intersection Design. TRB, NationalResearch Council, Washington, D. C., 1995.10.Highway Capacity Manual. Special Report 209, Transportation Research Board,National Research Council, Washington, D. C., 2000.11.Elefte
design braking distances on dry pavements. With anti-lock braking systems, they are also capable of stopping within AASHTO design braking distances on wet pavements. The additional stopping distance is balanced by the fact that the truck operator is able to see vertical features of obs


![Bosch ESI[truck] Heavy Duty Truck Software Update – Q2 .](/img/22/bosch-esitruck-heavy-duty-truck-release-notes-details-2019-2-0-0-0.jpg)