Transcription
Shukla et al. Cancer & Metabolism 2014, /18Cancer &MetabolismRESEARCHOpen AccessMetabolic reprogramming induced by ketonebodies diminishes pancreatic cancer cachexiaSurendra K Shukla1, Teklab Gebregiworgis2, Vinee Purohit1,3, Nina V Chaika1, Venugopal Gunda1,Prakash Radhakrishnan1, Kamiya Mehla1, Iraklis I Pipinos4,5, Robert Powers2, Fang Yu6 and Pankaj K Singh1,3,7,8*A correction to this article has been published: actBackground: Aberrant energy metabolism is a hallmark of cancer. To fulfill the increased energy requirements, tumorcells secrete cytokines/factors inducing muscle and fat degradation in cancer patients, a condition known as cancercachexia. It accounts for nearly 20% of all cancer-related deaths. However, the mechanistic basis of cancer cachexia andtherapies targeting cancer cachexia thus far remain elusive. A ketogenic diet, a high-fat and low-carbohydrate diet thatelevates circulating levels of ketone bodies (i.e., acetoacetate, β-hydroxybutyrate, and acetone), serves as an alternativeenergy source. It has also been proposed that a ketogenic diet leads to systemic metabolic changes. Keeping in viewthe significant role of metabolic alterations in cancer, we hypothesized that a ketogenic diet may diminish glycolyticflux in tumor cells to alleviate cachexia syndrome and, hence, may provide an efficient therapeutic strategy.Results: We observed reduced glycolytic flux in tumor cells upon treatment with ketone bodies. Ketone bodies alsodiminished glutamine uptake, overall ATP content, and survival in multiple pancreatic cancer cell lines, while inducingapoptosis. A decrease in levels of c-Myc, a metabolic master regulator, and its recruitment on glycolytic gene promoters,was in part responsible for the metabolic phenotype in tumor cells. Ketone body-induced intracellular metabolomicreprogramming in pancreatic cancer cells also leads to a significantly diminished cachexia in cell line models. Our mouseorthotopic xenograft models further confirmed the effect of a ketogenic diet in diminishing tumor growth and cachexia.Conclusions: Thus, our studies demonstrate that the cachectic phenotype is in part due to metabolic alterations intumor cells, which can be reverted by a ketogenic diet, causing reduced tumor growth and inhibition of muscle andbody weight loss.Keywords: Pancreatic cancer, Cancer cachexia, Cancer metabolism, Ketone bodiesBackgroundPancreatic cancer is the fourth leading cause of cancerrelated deaths in the USA [1]. Pancreatic ductal adenocarcinoma (PDAC) accounts for 95% of all pancreaticcancer cases [2]. Despite advances in the understandingof pancreatic cancer biology, effective chemotherapeuticmodalities for the treatment of patients remain to be developed. In addition to the aggressive pathogenesis,around 83% of pancreatic cancer patients demonstratecancer-induced cachexia, which significantly contributesto cancer-related deaths [3]. Thus, inhibition of cachexia* Correspondence: pankaj.singh@unmc.edu1The Eppley Institute for Research in Cancer and Allied Diseases, University ofNebraska Medical Center, Omaha, NE 68198, USA3Department of Pathology and Microbiology, University of Nebraska MedicalCenter, Omaha, NE 68198, USAFull list of author information is available at the end of the articlealong with cancer cell growth may be an effective strategy for the management of pancreatic cancer.Cachexia, a metabolic syndrome, leads to a loss ofmuscle weight and the depletion of fat deposits. Although an association of cachexia with various types ofcancers has been known for a long time, the molecularmechanism of cancer-induced cachexia is poorly understood [4]. Cachexia is triggered by a large number oftumor and host-derived catabolic factors and proinflammatory cytokines such as IL-6, TNFα, and IFN-γ,which lead to changes in host metabolism and energyexpenditure [4]. It has been proposed that excessive consumption of glucose by a growing tumor first leads to adepletion of glucose in the blood. At later stages oftumor growth, a depletion of glycogen stores in the liveroccurs. Glycogen depletion is followed by muscle degradation and depletion of adipose deposits. All these 2014 Shukla et al.; licensee BioMed Central Ltd. This is an Open Access article distributed under the terms of the CreativeCommons Attribution License (http://creativecommons.org/licenses/by/2.0), which permits unrestricted use, distribution, andreproduction in any medium, provided the original work is properly credited. The Creative Commons Public DomainDedication waiver ) applies to the data made available in this article,unless otherwise stated.
Shukla et al. Cancer & Metabolism 2014, /18account for the cachexia syndrome and result in a poorresponse to chemotherapy, fatigue, and a reduced qualityof life for cancer patients [5].Cancer cells exhibit reprogramming of several metabolicpathways along with multiple genetic, epigenetic, andgrowth signaling alterations [6,7]. Most cancer cells demonstrate an increase in glucose uptake, a higher rate ofglycolysis, and an increase in lactate secretion despite thepresence of oxygen, a phenomenon known as the Warburg effect [8]. Aerobic glycolysis plays an important rolein rapid cellular growth as it provides several intermediates required for biomass synthesis by routing the carbonflux through the pentose phosphate pathway [9]. The increased conversion of pyruvate into lactate by aerobic glycolysis leads to acidosis in tumor microenvironments thatfacilitates invasion and metastasis of cancer cells [10]. Aerobic glycolysis is also an energy-inefficient process requiring large amounts of glucose. Correspondingly, tumorcells serve as a glucose sink [11]. Additionally, lactate produced from tumor cells passes to the liver and gets converted to glucose by means of the Cori cycle, anotherenergy-inefficient process [9]. Along with glucose uptakeand enhanced aerobic glycolysis, cancer patients alsopresent glucose intolerance and increased hepatic glucoseproduction [12]. An increased requirement for glucosemight be the critical stimulus needed for enhanced hepaticglucose production. Tumor cells also have alterations inthe metabolism of glutamine, a nitrogen source and arguably the most significant metabolite precursor for tumorcells after glucose [13].A ketogenic diet is a high-fat and low-carbohydratediet that leads to elevated circulating levels of ketonebodies (i.e., acetoacetate, β-hydroxybutyrate, and acetone) and an alternative energy source [14]. Ketogenicdiets possess anticonvulsant and antiinflammatory activities [15,16]. It has also been proposed that a ketogenic diet treatment results in systemic metabolicchanges like increased glucose tolerance, reduced fattyacid synthesis, and weight loss [17]. Keeping in view thesignificant role of inflammation and metabolic alterations in cancer, a ketogenic diet may provide an efficient therapeutic strategy. Furthermore, most cancercells lack key mitochondrial enzymes to metabolize ketone bodies and generate ATP, while myocytes andother tissues, including the brain, still retain this ability[18]. Hence, a ketogenic diet may act against thecancer-induced cachexia while causing minimal side effects as previously it has been shown that a 2–7-mM ketone body concentration can be achieved safely withoutgiving rise to clinical acidosis [19,20]. In the presentstudy, we have evaluated anticancerous and anticachectic properties of ketone bodies in cell culture conditions,as well as the effect of a ketogenic diet on tumor burdenand cachexia in animal models. Furthermore, ourPage 2 of 19studies establish a ketone body-induced metabolomicreprogramming as the mechanism of action of a ketogenic diet against cancer and cancer-induced cachexia.MethodsCells and reagentsThe human pancreatic cancer cell line Capan1, mousemyoblast C2C12, and mouse embryo fibroblast (preadipocyte) 3T3L1 were obtained from American Type Culture Collection (Manassas, VA, USA). S2-013 is a clonedsubline of a human pancreatic tumor cell line (SUIT-2)derived from a liver metastasis [21]. All the cell lineswere cultured in Dulbecco’s modified Eagle’s medium(DMEM) supplemented with 10% fetal bovine serum,penicillin (100 mg/mL), and streptomycin (100 mg/mL)and incubated at 37 C in a humidified chamber with 5%CO2. Sodium-3-hydroxybutyrate, lithium acetoacetate,dihydroethidium (DHE), m bromide (MTT), BCPCF, and Shydroxy butyric acid were purchased from Sigma Chemicals (Sigma-Aldrich, St. Louis, MO, USA).Cell viability and caspase 3/7 activity assayCell viability was determined by performing MTT assay.Capan1 and S2-013 cells (5 103 cells per well) wereseeded in 96-well plates for 12 h and then treated withdifferent concentrations of sodium-3-hydroxybutyrate orlithium acetoacetate for 72 h. After treatment, cells wereincubated with MTT reagent for 2 h; the resultant formazan crystals were dissolved in dimethyl sulfoxide andthe absorbance was recorded at 590 nm. Untreated cellswere utilized as a control for the viability assays. Caspase3/7 activity was determined by utilizing a PromegaCaspase-Glo kit (Madison, WI, USA). Capan1 and S2013 cells (0.6 106 cells per well) were seeded in 6-wellplates for 12 h and then treated with different concentrations of sodium-3-hydroxybutyrate and lithium acetoacetate for 48 h. Caspase 3/7 activity was thendetermined as per the manufacturer’s protocol.Glucose and glutamine uptake assayTo determine glucose uptake, Capan1 and S2-013 cells(5 104 cells per well) were seeded in 24-well plates. After12 h, cells were treated with multiple concentrations ofsodium-3-hydroxybutyrate and lithium acetoacetate for24 h. After treatment, cells were starved for glucose for2 h and then incubated for 20 min with 1 μCi [3H]-2deoxyglucose (DG) for a glucose uptake assay. Cells werewashed with phosphate-buffered saline (PBS) and lysedwith 1% sodium dodecyl sulfate (SDS). The lysates werethen subjected to [3H] counting by utilizing a scintillationcounter. Scintillation counts from cells treated withlabeled and excess unlabeled 2-DG were utilized as controls for baseline correction. The results were normalized
Shukla et al. Cancer & Metabolism 2014, /18Page 3 of 19to the cell counts. For determining glutamine uptake,Capan1 and S2-013 cells (5 104 cells per well) wereseeded in 24-well plates. After 12 h, cells were treated withsolvent control, multiple concentrations of sodium-3hydroxybutyrate, or lithium acetoacetate for 24 h. Posttreatment, cells were starved for glutamine for 2 h and thenincubated for 3 min with 1 μCi tritiated Glutamine, L-[3,43H(N)]. Cells were washed with PBS and lysed in 1% SDS.The lysates were used for [3H] counting by utilizing a scintillation counter. Scintillation counts from cells treated withlabeled and excess unlabeled glutamine were utilized ascontrols for baseline correction. The results were normalized to the cell counts.protocol. Total RNA (5 μg) was reverse transcribed byutilizing Verso-cDNA synthesis kit (Thermo Scientific,Pittsburgh, PA, USA) according to the manufacturer’sguidelines. Quantitative reverse transcription polymerase chain reaction (qRT-PCR) was performed withgene-specific primers at 95 C for 10 s and 60 C for 60 s(40 cycles) in 10 μL reaction mix containing 3 μLcDNA, 2 μL primers, and 5 μL SYBR Green Master Mix(Applied Biosystems, Grand Island, NY, USA) using anABI 7500 thermocycler. Beta-actin was utilized as an internal control. The sequence of different sets of primersused in the study is given in Additional file 1. Quantification was performed with the ΔΔCt method [22].Lactate release assayImmunoblottingCapan1 and S2-013 cells (5 104 cells per well) wereseeded in 24-well plates. After 12 h, cells were treated withindicated concentrations of sodium-3-hydroxybutyrate orlithium acetoacetate for 24 h. The culture supernatantswere then utilized for determining lactate release. Theassay was performed by utilizing a Lactate Assay Kit (EtonBioscience Inc., San Diego, CA, USA), as per the manufacturer’s protocol.For immunoblotting, cells were washed twice with coldPBS and lysed in RIPA lysis buffer by incubating at 4 Crotatory shaker for 30 min. Cell debris was removed bycentrifugation at 13,000 rpm for 10 min and the supernatant was collected. Protein content was measured byperforming Bradford assay. Western blotting was performed as described previously [23]. The membraneswere probed with primary antibody against GLUT1(Abcam, Cambridge, UK), c-Myc-9E10 (Santa Cruz Biotechnology, Dallas, TX, USA), HKII (Cell SignalingTechnology, Beverly, MA, USA), and HSP90 (Santa CruzBiotechnology).ATP assayTotal ATP level in cells was determined by using an ATPassay kit (Roche, Indianapolis, IN, USA). After 12 h, cellswere treated with different concentrations of sodium-3hydroxybutyrate and lithium acetoacetate for 24 h andATP level was determined as per the manufacturer’sprotocol. ATP level was normalized with total proteinconcentration.Reactive oxygen species assayReactive oxygen species level was determined by usingoxidation-sensitive fluorescent dye DHE. Capan1 and S2013 cells (0.1 106 cells per well) were seeded in 12-wellplates on glass coverslips. After 12 h, cells were treatedwith solvent control or indicated doses of sodium-3hydroxybutyrate and lithium acetoacetate for 24 h.Control and treated cells were incubated at 37 C in2.5 mM DHE containing DMEM. After incubation, cellswere washed with cold PBS and fixed with HistoChoice fixative (Sigma-Aldrich) for 15 min at room temperature.Cells were washed with PBS and the coverslips weremounted onto glass slides using real-mount. Fluorescenceintensity per cell was determined by scanning with ZeissAxiovert 200 M microscope (Oberkochen, Germany) andanalyzing the images with SlideBook 5.5 software (Intelligent Imaging Innovations, Inc., Denver, CO, USA).Luciferase assayc-Myc-promoter (del1)-luciferase reporter construct wasobtained from Addgene (Cambridge, MA, USA) [24].Cells were transfected with 1 μg of plasmid, and 16 hpost transfection, cells were treated with different ketonebodies for 24 h. A synthetic Renilla luciferase reporterpRL-TK was utilized as a transfection control. Luciferaseactivity was determined by utilizing Dual-Luciferase Reporter Assay System (Promega).Chromatin immunoprecipitationFor chromatin immunoprecipitation, cells were treatedwith 20 mM sodium-3-hydroxybutyrate and lithiumacetoacetate for 24 h along with solvent control. Chromatin immunoprecipitation was performed by utilizingc-Myc antibody (9E10) as described previously [25].Mouse IgG was utilized as a control. qPCR data werenormalized to a genomic region located within GUSBgene and represented as fold enrichment relative to theIgG control. Primer sequences used for qPCR amplification are described in Additional file 1.Tumor growth measurementGene expression analysis by qRT-PCRTotal RNA was isolated by utilizing RNeasy columns(Qiagen, Venlo, The Netherlands) as per the manufacturer’sCongenitally athymic female nude mice (NCr-nu/nu) werepurchased from the National Cancer Institute. Mice weretreated as per the guidelines of our institutional animal care
Shukla et al. Cancer & Metabolism 2014, /18and use committee (IACUC). S2-013 cells (5 105) wereused for orthotopic injections into the pancreas of nudemice. After 7 days of implantation, mice were divided ingroups of nine animals each and fed ad libitum with a normal diet or a ketogenic diet (composition given in Table S2in Additional file 1). After 3 weeks of treatment, mice weresacrificed and tumor weight, tumor volume, muscle weight,carcass weight, etc. were recorded. Tumor tissue and otherorgans were flash frozen in liquid nitrogen for further analysis. Animal protocols were in accordance with the NIHGuide for the Care and Use of Laboratory Animals andwere approved by the University of Nebraska Medical Center Animal Care and Use Committee.ImmunohistochemistryImmunohistochemistry was performed as described previously [26]. Ki67 (Thermo Fisher Scientific, Waltham, MA,USA), c-Myc (Epitomics, Burlingame, CA, USA), andCleaved Caspase 3 (Cell Signaling Technology) primaryantibodies were utilized. The stained sections were imagedat 20 under an upright microscope and representative images were captured and presented.Metabolite extraction and NMR sample preparationAfter confirming the confluence of the cells, the mediawas aspirated and the cells were washed twice with 1 phosphate buffer to remove remnants of the media beforelysing the cells. The cells were then cold shocked with1 mL of cryogenically cold 80% methanol/water mixture.The plates with the 80% methanol/water were incubatedin a 80 C freezer for at least 15 min. The cells from thecold plates were scraped with a cell scraper and pipettedinto an Eppendorf tube and centrifuged at 13,000 rpm for5 min. The supernatant was collected and 250 μL of MilliQ water (Millipore, Billerica, MA, USA) was added to theremaining cell debris for re-extraction. After mixing thecell debris with the water by pipetting, the sample wasagain centrifuged at 13,000 rpm for 5 min. The new supernatant was combined with the previously collected supernatant. Finally, the sample was dried using speed vacuumevaporator (SpeedVac Plus, Savant, Thermo Scientific,Waltham, MA) to evaporate the methanol and subjectedto freeze drying (Labconco, Kansas City, MO) to lyophilizethe water consecutively. The dried sample was made readyfor an NMR experiment by dissolving in 600 μL of 50 mMphosphate buffer in 99.8% D2O (Isotec, St. Louis, MO) atpH 7.2 (uncorrected) with 50 μM 3-(tetramethysilane)propionic acid-2,2,3,3-d4 (TMSP) (500 μM for 2D 1H-13CHSQC) for spectral referencing.NMR experiment and data analysisThe NMR spectra were acquired on a Bruker AVANCEDRX 500 MHz spectrometer equipped with 5 mm tripleresonance cryogenic probe (1H, 13C, and 15 N) with a Z-Page 4 of 19axis gradient. The NMR data collection was automatedusing a BACS-120 sample changer, ATM (automatic tuning and matching), and Bruker IconNMR software. Theone-dimensional (1D) proton nuclear magnetic resonance(1H NMR) data was acquired using an excitation sculptingpulse sequence to remove the solvent peak and maintain aflat baseline [27]. The spectra were collected at 300 K with32 K data points, 128 scans, 16 dummy scans, and a spectral width of 5,483 Hz. Our MVAPACK software (http://bionmr.unl.edu/mvapack.php) [28] was used to processthe 1D 1H NMR spectra. The raw NMR data was onlyFourier transformed and automatically phased. The resulting NMR spectrum was binned using an adaptive intelligent binning algorithm that automatically adjusts bin sizesto avoid splitting NMR resonances between multiple bins[29]. The spectral region before the TMSP was used as atraining set to remove the noise from the data using themethod stated by Halouska et al. [30]. The spectra werethen normalized using standard normal variate (SNV) andscaled using Pareto scaling. The processed data was utilized to generate plots of principal component analysis(PCA) and orthogonal projections to latent structuresdiscriminant analysis (OPLS-DA) scores and backscaledloadings (Additional file 2) using our MVAPACK software [28]. Metabolite identification from the 1D 1HNMR spectra was accomplished using the ChenomxNMR Suite 7.6 (http://www.chenomx.com/) and thebackscaled loadings.The 2D 1H-13C hetero-nuclear single quantum coherence (HSQC) NMR spectra were collected at 300 K with64 scans, 16 dummy scans, and a 1.5-s relaxation delay.The spectra were collected with 2 K data points and aspectrum width of 4,735 Hz in the direct dimension and64 data points and a spectrum width of 17,607 Hz in theindirect dimension. The 2D 1H-13C HSQC NMR spectrawere processed using NMRPipe (NIH, Bethesda, Maryland) [31] and analyzed using NMRViewJ Version 8.0.3.Peak intensities were normalized by the average peak intensity for a given spectrum and then assigned to a metabolite using chemical shift references from the HumanMetabolomics Database [32], Madison MetabolomicsConsortium Database [33], and Platform for RIKENMetabolomics [34]. Chemical shift errors of 0.08 and0.25 ppm for the 1H and 13C chemical shifts, respectively, were used to match the experimental chemicalshifts with the databases. In addition to chemical shifts,peak splitting patterns and peak shapes were also usedto verify metabolite assignments.The 2D 1H-13C HSQC NMR experiment is a more reliable approach for metabolite identification because of thesignificantly higher signal dispersion, and the correlationbetween 1H and 13C chemical shifts for each C-H pair in amolecule [35]. More importantly, the 2D 1H-13C HSQCexperiment simplifies the analysis of the metabolome
Shukla et al. Cancer & Metabolism 2014, /18because only compounds containing a 13C-carbon derivedfrom the 13C6-glucose added to the media will be detected.Thus, using 13C6-glucose will highlight metabolite changesassociated with the glycolytic flux in tumor cells. Thisavoids the challenge with the 1D 1H NMR experimentswhere the spectra were dominated by catabolic productsof ketone bodies. Thus, the identification of metabolitesfrom the 2D 1H-13C HSQC experiments is more reliableand pertinent to the analysis of metabolic changes resulting from ketone body effects on pancreatic cancercachexia.Each metabolite peak from the two sets (control andketone body-treated) of triplicate 2D 1H-13C HSQC NMRspectra were further normalized by using the maximumpeak intensity for the metabolite and then scaled from 0to 100. The peak intensities for each metabolite werethen averaged and compared between the control andtreated groups using a Student’s t test. Metabolites witha p value 0.1 were used to generate a heat map usingthe R statistical package [36]. A relative change in peakintensity implies a corresponding metabolite concentration change. Absolute concentrations are not measurable from the 2D 1H-13C HSQC because other factors,such as coupling constants, relaxation, and dynamics,also contribute to peak intensities.Measurement of blood glucose and β-hydroxybutyrateconcentrationBlood glucose level of mice was measured after 16 h ofstarvation by utilizing Contour USB blood glucose meter(Bayer Health Care, Mishawaka, Japan), as per the manufacturer’s protocol. Blood ketone level was measured byutilizing a blood glucose and ketone monitor (NovaBiomedical, Waltham, MA, USA) as per the manufacturer’s protocol. The concentration of β-hydroxybutyratewas measured by comparing the TMSP-normalized methyl peaks of 1H NMR collected for six animals.C2C12 and 3T3L1 differentiation and conditionedmedium preparationC2C12 mouse myoblasts were grown in DMEM with 10%FBS. To induce differentiation, cells were switched to 2%horse serum and 10 μg/mL insulin-containing DMEMand grown for 72 h. 3T3L1 mouse embryo fibroblastswere cultured in DMEM with 10% FBS. For differentiationof 3T3L1 preadipocytes, after 2 days at confluency, cellswere treated with differentiation medium: DMEM containing 10% FBS, 1 μM dexamethasone, 0.5 mM methylisobutylxanthine (IBMX), and 1 μg/mL insulin for 2 days.After 2 days, differentiation medium was replaced withDMEM containing 10% FBS. Medium was changed regularly after 48 h. For conditioned medium preparation, cellswere plated at a density of 50,000 cells/cm2, and after 12 hof seeding, cells were washed twice with PBS and culturedPage 5 of 19in serum-free DMEM for the next 24 h. Conditionedmedium was centrifuged at 1,200 g for 10 min and filteredwith a 0.2-μm syringe filter and used immediately or storedat 80 C.Measurement of intracellular pHCytosolic pH was measured by using fluorescence spectroscopy using BCPCF-AM as described by Marinoet al. [37].Statistical analysisComparisons between different groups were performed byusing ANOVA (one-way; GraphPad Prism version 4.03)with Dunnett’s post hoc test. Student’s t test was used forin vivo studies. A p value of 0.05 was considered to besignificant.ResultsKetone bodies diminish pancreatic cancer cell growthand induce apoptosis in a dose-dependent mannerWe investigated the effect of ketone bodies (sodium hydroxybutyrate and lithium acetoacetate) on cell survival inmultiple pancreatic cancer cell lines. Initially, we evaluatedthe effect of multiple doses of sodium hydroxybutyrate andlithium acetoacetate (1 to 20 mM) on the survival ofCapan1 and S2-013 pancreatic cancer cells by performingMTT assays. Ketone bodies were observed to inhibit cellsurvival in a dose-dependent manner. Ketone bodies significantly inhibited cell growth at concentrations of 10 and20 mM after a 72-h treatment (Figure 1A,B). To evaluate ifthe ketone body-induced survival diminution is specific tocancer cells, we subjected immortalized, non-transformedpancreatic epithelial cell lines HPNE and RAPAN to incubation with sodium hydroxybutyrate and lithium acetoacetate. We observed no significant effect on survival of thesecells under treatment with ketone bodies (Additional file 3).Similarly, to rule out the possibility of organic acid and lithium ion being responsible for reduction in cancer cell survival, rather than ketone bodies themselves, we evaluatedthe survival of S2-013 and Capan1 under treatment with Shydroxy butyric acid and lithium chloride. We observed nosignificant effect on S2-013 and Capan1 cell survival after72 h of treatment (Additional file 4). Furthermore, weinvestigated the effect of sodium hydroxybutyrate, lithiumacetoacetate, and S-hydroxybutyrate on intracellular pH.After 6 h of treatment with different doses of sodiumhydroxybutyrate, lithium acetoacetate, and S-hydroxybutyrate on S2-013, Capan1, HPNE, and RAPAN cells, weobserved significant decrease in intracellular pH (0.2 to 0.4units) in all the cell lines (Additional file 5). Although intracellular acidification upon treatment with ketone bodiesmight contribute to the antiproliferative effects of ketonebodies, it is not the primary cause of cells death as we didnot observe significant cell death upon treatment with S-
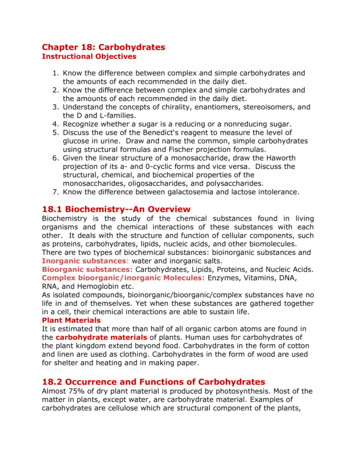
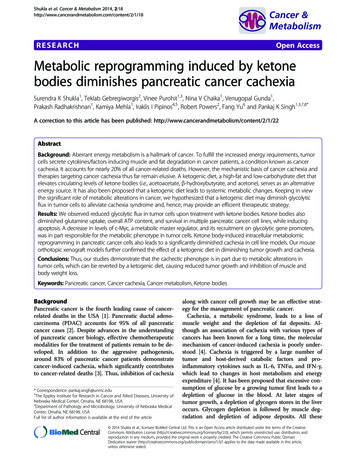
Shukla et al. Cancer & Metabolism 2014, /18Page 6 of 19Figure 1 Ketone bodies inhibit growth and induce apoptosis in pancreatic cancer cell lines. Capan1 (A) and S2-013 (B) cells were treatedwith different concentrations of sodium-3-hydroxybutyrate (NaHB) and lithium acetoacetate (LiAcAc) for 72 h, and cell viability was determinedby MTT assay. Bar represents percent viability under indicated treatments relative to treatment with solvent control. Representative bright-fieldimages of Capan1 (C) and S2-013 (D) cells under treatment with 10- and 20-mM concentrations of NaHB and LiAcAc for 72 h. (E) Multiplepancreatic cancer cell lines were treated with 10- and 20-mM concentrations of NaHB and LiAcAc for 72 h, and relative cell viability determinedby MTT assay is plotted in the bar charts. (F) Capan1 and S2-013 cells treated with 10- and 20-mM concentrations of sodium-3-hydroxybutyrateand lithium acetoacetate for 48 h and the relative caspase 3/7 activity are plotted. Values represented are mean SEM. *P 0.05; **P 0.01.isomer of hydroxybutyrate that caused similar intracellularpH change as did the other ketone bodies. Furthermore, weobserved a similar effect on intracellular pH in nontransformed pancreatic epithelial cell lines HPNE andRAPAN after treatment with sodium hydroxybutyrate, lithium acetoacetate, and S-isomer of hydroxybutyrate but nosignificant cell death, as mentioned earlier. Bright-field microscopy images of the cells treated with 10 and 20 mM ofNaHB and LiAcAc are presented in Figure 1C,D. Furthermore, we investigated the effect of ketone bodies on fivepancreatic cancer cell lines and observed that cell growthis significantly inhibited in a dose-dependent fashion(Figure 1E). We also investigated the effect of ketone bodytreatment on caspase activity in Capan1 and S2-013 celllines. Caspase 3/7 activity increased upon treatment of thepancreatic cancer cells with ketone bodies in a dosedependent manner (Figure 1F).Ketone bodies cause metabolic alterations in pancreaticcancer cellsPrevious studies indicate that a ketogenic diet inducesmetabolic alterations in mice [17]. Hence, we next investigated the effect of ketone bodies on pancreatic cancer cellmetabolism. Because cancer cells demonstrate an increasein glycolysis [38], we examined the effect of ketone bodieson glucose uptake and lactate release in Capan1 and S2013 cells. Treatment of Capan1 and S2-013 cells withketone bodies resulted in a decrease in glucose uptake(Figure 2A,B) and release of lactate (Figure 2C,D) in adose-dependent manner. Since glutamine also supportspancreatic cancer cell growth [7], we also evaluated the effect of ketone bodies on glutamine uptake. Our resultsindicate a reduced uptake of glutamine by Capan1 andS2-013 pancreatic cancer cells under treatment withketone bodies (Figure 2E,F). Furthermore, we observed a
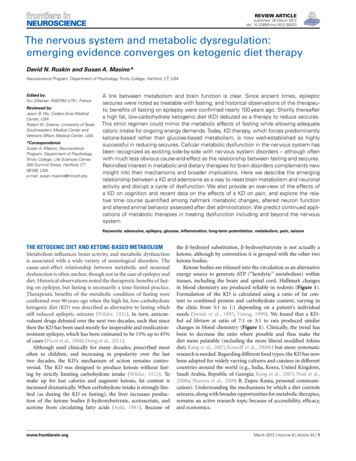
Shukla et al. Cancer & Metabolism 2014, /18Figure 2 (See legend on next page.)Page 7 of 19
Shukla et al. Cancer & Metabolism 2014, /18Page 8 of 19(See figure on previous page.)Figure 2 Ketone bodies induce metabolic alterations in pancreatic cancer cell lines. S2-013 (A) and Capan1 (B) cells were treated withdifferent doses of ketone bodies for 24 h, and glucose uptake was determined by performing 3H-2DG uptake assay. Bars represent countsnormalized with cell number and plotted relative to control. Lactate release was determined by colorimetric assay using c
Cachexia, a metabolic syndrome, leads to a loss of muscle weight and the depletion of fat deposits. Al-though an association of cachexia with various types of cancers has been known for a long time, the molecular mechanism of cancer-induced cachexia is poorly under-stood [4]. Cachexia is triggered by a large number of