Transcription
RealtimeContentInsights 2.0Guide
Table of Contents03Overview07How to Use and Optimize229Realtime Article Performance13Realtime Video Performance16Historic Performance21Trends in your regionFrequently Asked Questions
OverviewSupportDocumentation
What is Realtime Content Insights (RCI)?Realtime Content Insights (RCI) wasdesigned to simplify consumption ofcontent performance data found in GoogleAnalytics with the goal of supportingcontent distribution and creation decisions.All of the data presented revolves aroundwhat is currently happening on your site,what’s trending on the web, how yourcontent performed today and what contentdid especially well over previous thirty days.Our objective in creating RCI is to help youbetter understand which of your contentis resonating (both articles and video),where content can be improved and toprovide insights on potential contentcreation and distribution opportunities.What do I need to use RCI?RCI is completely free to use. All that is necessary is to have a Google account associated with GoogleAnalytics (standard or 360 version) implemented on your publication.(some features require some additional tags from News Tagging Guide (NTG))What can I learn from RCI ?There are four key areas that are displayed within RCI.1.2.3.4.Realtime Article PerformanceFocused on what’s trending on your publication in realtimeRealtime Video Performance (requires NTG to be implemented)Focused on which videos are trending on your publication in realtimeHistoric Performance (limited data is displayed without NTG)Insights on content that has overperformed in driving engagement.Trends in Your RegionInsights on what people are searching for across Google and Youtube4
What’s new with RCI 2.0?RCI 2.0 has been redesigned to introduce a number of new features to help you with content creationand distribution decisions: Support for video - If you have implemented NTG for video, you will see a number of newmetrics including: Realtime viewers Casual (new) vs Loyal Users (returning) Completion rate Unmute rate Fullscreen rate Support for historic data - this new view will give you a content engagement rank for articlesand video for a period of time that you can set. This rank can be used to understand whicharticles and videos are driving the most engagement. Dashboard view - a convenient way to see how your publication is performing across all themetrics that we’re highlighting for your articles, video and historics metrics. Additional metrics for articles - we’ve introduced new metrics to help you better understandhow your articles are performing including the following: Casual (new) vs Loyal Users (returning) Recirculation and how it compares to your publication on average Mobile speed performance and how it compares to your publication on average Scroll depth to help you understand on average how much of your article is beingcompleted5
Get better data with News Tagging Guide (NTG)We’ve heard from multiple news organizations around the world that it can be complex to identify theright metrics to collect in Google Analytics or even ensure the right technical implementation.We created News Tagging Guide (NTG) to highlight the right news and publishing metrics to measure inGoogle Analytics, simplify tagging and amplify the recommendations and insights found in NewsConsumer Insights and Realtime Content Insights.These are the data components covered in NTG :News Tagging Guide (NTG) and RCIImplementing specific NTG tags or taxonomy will give you access to specific insights in your RealtimeContent Insights report including: scroll depth analysis, video consumption, and a more advanced ContentEngagement Rank for your articles.Please check our FAQ section to identify which NTG tags/events you should implement specifically to getthe best of Realtime Content Insights.6
How to Useand OptimizeImprove distribution and contentcreationSupportDocumentation
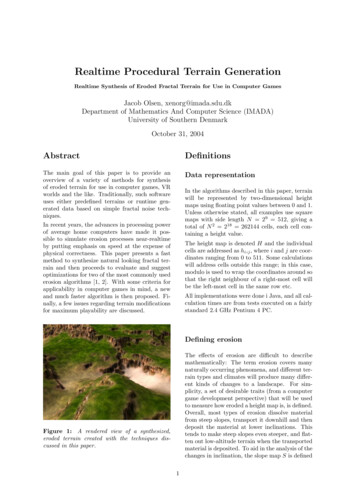
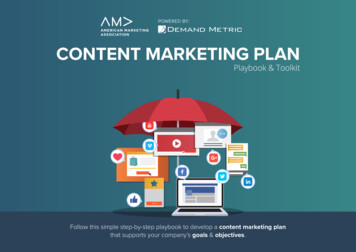
How to use Realtime Content Insights (RCI) 2.0Realtime Consumer Insights (RCI) is completely free to use! The only thing you’ll need to access the toolis an email address associated with your Google Analytics account.1 - Authorize the tool to get access to your Google Analytics Data, connect your Google Analytics Accountand visit the setup tab.Select your Google Analytics accountInput custom dimensions for Author or Category, modify the data beingbeing used in the dashboards2 - Select the section in RCI that you want to focus on. The first 3 sections: Realtime Article Performance,Realtime Video Performance and Historic performance have a similar structure to the image below.Use the dashboardto see how yourpublication is doingin realtime and todayThe list view shows youthe articles or videos tofocus on, the metricswe’re tracking and howthey compare to theaverageExpand anarticle or videoto see all of thedetails8
Realtime Article Performance:Article ViewThe article table view shows you which of your articles are generating the most realtime readers andthe pageviews they generated in the last 30 minutes. It also shows you which articles are driving thefollowing based on today’s data:Casual vs Loyal users (C icon vs L icon)Recirculation in comparison to your site average*Performance issues that should be addressed* compared to your site average* *The icon color green represents a rate above site average and red represents a rate below site averageThings to ConsiderThings to Consider If an article is driving more casual readers, perhaps it’s an article you want to use to acquire newusers. If an article is driving more loyal readers, this potentially is an article that is resonating wellwith your current audience. The degree that this article is leaning in one direction should helpyou determine if you should promote an article.If an article has less recirculation, consider the placement of recirculation widgets within thearticle or if leads to a high degree of recirculation, consider promoting this article or replicatingtactics employed.If you are seeing that an icon is grey, it means that GA does not have the data yet.9
Realtime Article Performance:Article View - ExpandedWhen you expand an article, you’re provided with the supporting metrics for each of the iconsdisplayed. In addition, you will see a breakdown of device types and scroll depth if you’ve implementedour NTG Scroll Depth component. Similar to the dashboard, the geography and top 5 referral sourcesare presented in realtime. The data for casual vs loyal, mobile vs desktop, recirculation, page speed andscroll depth are all presented based on today’s Google Analytics data (or yesterday if you’ve modifiedwhich day to use for the dashboard).Take a look at each of the data points being displayed.How does this compare with what you’re seeing in thedashboardview? How does this compare with what you’reTake a look at each of the data pointsbeing displayed.If you see that a specific article is doing especially wellseeing in the dashboard view? for you,is therewellsomethingarticlecontentinthatIf you see that a specific article is doingespeciallyfor you,inis thetheresomethingthe thiscontent that you can replicate? Should you distribute / promote this article on other platforms?articleon otherIf you see that a specific article is doingworsethanplatforms?expected, is there something that you want Ifyouseethataspecificarticle is doing worse thanto modify in the article content?expected,there somethingthatthatyou GAwantto modifyin theIf you notice that a box is empty witha yellow iswarning,this indicatesdoesnot havethearticlecontent?data yet but it will be presented when it’s available.Thingsto ConsiderThingsto Consider 10
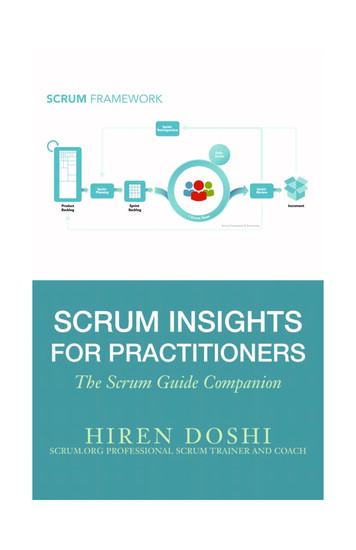
Realtime Article Performance:Today’s Performance DashboardThe dashboard view on the right shows you how your articles on yourpublication are performing both in realtime and for today. Thefollowing metrics are displayed in realtime:Realtime readers - how many users are on your site in realtimeGeography - what countries, regions or cities are your userscoming from in realtime.Top 5 referral sources- what sources are directing your usersto your site in realtime. Additional metrics are displayed for today (the point at which GA has isable to obtain data). Daily visits shows you how you are pacing in usersfor the day vs your average for the past week (the daily average isestimated from your total overall visits over the last 7 days).We also calculate the averages of the following metrics for todaywhich include the following:Casual vs Loyal readers - how many new users vs returning users have visited your site on averageMobile vs Desktop - a breakdown of mobile or desktop for articles on averageRecirculation - your overall average recirculationPagespeed - your overall average page load timeScroll depth- how far do readers read articles on average Things to ConsiderThings to Consider Use the dashboard to understand how your publication is doing for the day and in real time.Have any of these numbers changed substantially from day to day? Do they line up with yourgoals?If you notice that you’re pacing behind, this may be a good opportunity to release more contentor promote content to drive visits. If you’re pacing ahead, you may want to wait to releasecontent that isn’t imperative for the day.These metrics can help you with roadmap prioritization by helping you focus on recirculation andpage speed.If you're not seeing data for today, this could mean that there is a delay in GA or the data is notavailable. You can use yesterday’s data by going into the settings tab.11
Realtime Article Performance:Newsroom ViewThe newsroom view was built to provide a visual of all articles that are currently trending on yourpublication. In full screen mode, it can be used as a display to ensure that the entire newsroom isaware of what is trending in any given moment and to drive further newsroom involvement. The datawill refresh automatically every 180 seconds while in this view.Thingsto ConsiderThingsto Consider Put this view on a large screen in the newsroom so everyone is on the same page regardingwhat is trending on site.Icons aligned with key metrics will be displayed in this view. Look for patterns across these iconsand identify items that should be addressed.Use the icons presented to also identify opportunities to further promote articles or inspirecontent.Remove the homepage if it’s not something you want to track by using the toggle above thenewsroom.12
Realtime Video Performance:Video Table ViewThe video table view shows you which of your videos are generating the most realtime viewers. It alsoshows you which videos are driving the following based on today’s data:Casual vs Loyal users (C icon vs L icon)Completion rate in comparison to your site average*Unmute rate in comparison to your site average*Fullscreen rate in comparison to your site average* *The icon color green represents a rate above the site average and red represents a rate below the site averageThings to Consider If a video is driving more casual viewers, perhaps it’s a video you want to use to acquire newviewers for your site. If a video is driving more loyal viewers, this is potentially a video that isThings to Considerresonating well with your current audience. The degree that this video is leaning in one directionshould help you determine if you should promote a video depending on the strategy you want toemploy.If a video has a low completion rate, consider the length, titles and description. You can learnmore about optimizing video content in our NCI guide.13
Realtime Video Performance:Video View - ExpandedWhen you expand a video, you’re provided with the supporting metrics for each of the icons displayed.In addition, you will see a breakdown of device types and completion rate. Similar to the dashboard,the geography and top 5 referral sources are presented in realtime. The data for casual vs loyal, mobilevs desktop, unmute, fullscreen and completion rate are all presented based on today’s GoogleAnalytics data (or yesterday if you’ve modified which day to use for the dashboard).Things to ConsiderThings to Consider Take a look at each of the data points being displayed. How does this compare with what you’reseeing in the video dashboard view?If you see that a specific video is doing especially well, is there something in the video contentthat you can replicate? Should you distribute / promote this video on other platforms?If you see that a specific video is doing worse than expected, is there something that you wantto modify in the video content?14
Realtime Video Performance:Today’s Performance DashboardThe dashboard view on the right shows you how thevideos on your site are performing both in realtimeand for today. The following metrics are displayed inrealtime:Realtime viewers - how many users on yoursite are viewing video content.Geography - what countries, regions orcities are your video views coming from inrealtime.Top 5 referral sources- what sources aredirecting views to your site in realtime. Additional metrics are displayed for today (the pointat which GA has data). Daily visits shows you howyou are pacing in views for the day vs your averagefor the past week (the daily average is estimatedfrom your total overall visits over the last 7 days).We also look at the top 50 videos to calculate theaverages of the following metrics for today whichinclude the following:Casual vs Loyal readers - how many new users vs returning users have watched a video on averageMobile vs Desktop - a breakdown of mobile or desktop for videos on averageUnmute rate - the unmute rate for videos on averageFullscreen rate - the fullscreen rate for videos on averageCompletion rate- the average % of completion for videos Things to ConsiderThings to Consider Use the dashboard to understand how users are consuming video on your site for the day and inrealtime.Have any of these numbers changed substantially from day to day? Do they line up with yourgoals?Consider if you’re building the best experience for the device type majority.If you're not seeing data for today, this could mean that there is a delay in GA or the data is notavailable. You can go into the settings and use yesterday’s data.If you notice that you’re pacing behind in viewers, this may be a good opportunity to releasemore contentIf you’re pacing ahead, you may want to wait to release content that isn’t imperative for the day.15
Historic Performance:Article and Video Performance TableThe table below ranks all of your articles and video by pageviews / views generated during the time frameselected (last 30 days by default). We've created a Content Engagement Rank (CER) that looks beyondpageviews / views and across all key engagement metrics (like recirculation, % loyal readers) to provide adeeper analysis of your content performance compared to your site average. This should allow you toquickly identify stories that have impacted your audience in more meaningful ways.Make your CER even more valuable! Implement Reader Engagement and Reader Revenue componentsfrom News Tagging Guide and we'll take those into consideration and adapt our rank to surface the storiesthat improved performance accordingly.The article and video performance table also indicates which metric is the highest performing and whichmetric is the lowest performing for your site within the time period set.You also have the ability to filter the content being shown on this screen by author or category if you haveprovided the necessary dimensions in the settings. Find out more about this in our FAQ.Things to Consider Is there a big gap between pageviews / views and the CER? If so, understand why that gapexists.By default, you’re seeing this data by the last 30 days. Modify this to see other time periods ifthis aligns better for internal strategy or reporting.16
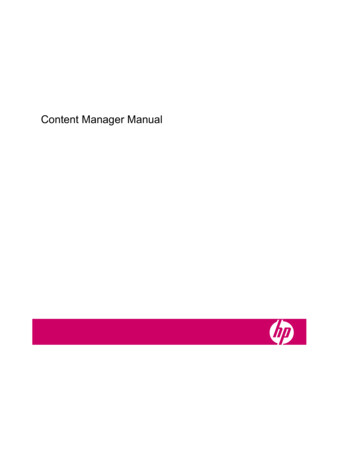
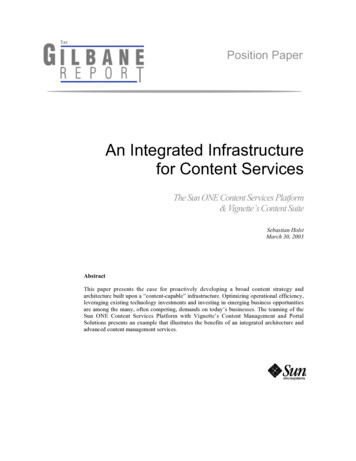
Historic Performance:Overview of Content Engagement Rank (CER)We created a metric called “Content Engagement Rank” (CER) to help you analyze your article’sperformance beyond just pageviews / views. What content is particularly resonating with your loyalreaders? Which stories are overperforming on recirculation or newsletter signups? These are some of thequestions we aim to answer with our CER.We’ve built the CER based on multiple Google Analytics metrics and our score analyses 7 metrics forarticles and 4 metrics for videos.These metrics are dynamically compared to your site’s average (from the top 100 articles or top 50videos for the publication during the time period selected) and weighted based on their respectiveimportance towards your performance.The metrics used to calculate the CER for any given story: Pageviews generated Loyal readers engaged Recirculation Affiliate clicks (based on your NTG implementation) Newsletters signup (based on your NTG implementation) Social Shares (based on your NTG implementation) Comments (based on your NTG implementation)The metrics used to calculate the CER for any given video: Video Starts Video completion rate Unmute rate Fullscreen rateHere’s an example of how the Content Engagement Rank is weighted for articles :17
Historic Performance:Article View and Video View ExpandedWhen you expand an article or a video, you’re provided with the a breakdown of all the metrics that arebeing used for the Content Engagement Rank. Each of these metrics will have a green or red icon next toit, indicating if this metric is performing above the or below the average of your publication.Things to Consider Take a look at each of the data points being displayed. How does this compare with what you’reseeing in the dashboard view?If you see that a specific article or video is doing especially well for you, is there something inthe content that you can replicate? Should you distribute / promote this on other platforms?If you see that a specific article or video is doing worse than expected, is there something thatyou want to modify in the content?If you’re not seeing all of the metrics outlined in the overview of the content engagement rank,this may mean you have not implemented NTG.18
Historic Performance:Top Articles and Videos by Key MetricsBelow both the article and video views, you will find a table that shows you the top articles or videos bymetrics. This will give you chance to easily see which articles or videos contributed to a specific keydata metric for the time period you have set. By default, the rows in this table are collapsed. Expandinga metric will show you the top 5 articles or videos for that specific metric.Things to Consider Which of these metrics are most important to your business? Expand that specific row andunderstand why those specific articles are doing especially well for this metric.Consider if that article should be promoted further.Use the author and category filters to dig a little deeper.If you don’t have an author category filter, set this up the dimensions by using the settings19
Historic Performance:Historic Performance DashboardThe dashboard view on the right shows you the key performance metrics averages associated witharticles and video across the time period selected (30 days by default).From your Top 100 articles, we define your average expected performance per story:PageviewsAvg. pageviews for an articleLoyal readersAvg. amount of Loyal readers engagedRecirculationAvg. amount of recirculationNewsletter Signup RateAvg. amount of newsletter signupsSocial Share RateAvg. amount of social sharesComment RateAvg. amount of commentsAffiliate Click RateAvg. amount of clicks on affiliate links From your Top 50 videos, we define your average expectedperformance per video:VIdeo StartsAvg. amount of autoplay and click to play generatedVideo Completion RateAvg. completion rateUnmute RateAvg. unmute rateFullscreen RateAvg. fullscreen rate Things to Consider Use this dashboard to understand how your site has done for a specific period of time. Do thesenumbers align with what you expect or your strategy?Not seeing all the metrics? Make sure you have NTG implemented correctly. Check out the FAQ.20
Trends in your regionRealtime Search Trends show you which searches are currently trending in realtime. You can furtherbreak down these searches into categories that include the following: business, entertainment, health,science/technology, sports and top stories. You can also modify which country to focus on by using thefilter at the top.Trends in your region is a new module that will provide you with search insights for predetermined events(these events will be updated regularly). Insights include:Interest over timeRelated topicsRelated queries These insight can be found by selecting the key events drop down at the top within ‘trends in yourregion.’Things to Consider Take a look at the content that is currently trending in a category for search and what’s trendingon Youtube. Is there content that aligns with what your users rely on you for?How does what’s trending in search and on Youtube align with your top videos? Are therecontent gaps you could potentially fill?Are the events in the ‘trends in your region’ relevant to content you normally produce?Is interest growing and relevant today?What other questions are users asking? Can you create content to fill this need?What topics are related? Is there an opportunity to fill a need associated with the topic?21
FrequentlyAskedQuestionsSupportDocumentation
Frequently Asked Questions (FAQ)Do I need to implement any GoogleAnalytics tags on my site to useRealtime Content Insights (RCI)?You can use RCI by simply connecting your GoogleAnalytics account. To maximize the value of RCI andreceive additional insights and recommendations, youshould implement certain News Tagging Guide (NTG)tags. This will also be used to improve the ContentEngagement Rank (CER).Which NTG tags/events should Iimplement specifically?Visit News Tagging Guide and implement the followingtags to take full advantage of RCI (you can also changeyour current events based on NTG taxonomy):To enableRCI Video reportsTo enableRCI “Scroll Depth”To improve yourContent Engagement RankAffiliate link clickNewsletter signupSocial ShareComment Added23
Why am I not seeing any data whenaccessing RCI?This likely occurring because you’re not logged inwith a Google account that is associated with aGoogle Analytics account. To fix this,1.Log out of your current account.2.Log back in with a Google accountassociated with the Google Analytics youwould like to use RCI with.3.Close and reopen RCI.Why aren’t my article imagesloading in the newsroom view?This can happen for two reasons:1.2.We couldn’t identify your full URL in order toextract the image from each article.Yourdomain needs to be populated in GoogleAnalytics correctly. You can set GoogleAnalytics to include the full URL in yourreports by creating a filter. You can findinstructions here (no alytics/answer/1012243?hl enYou probably don’t have an Open Graph(OG) image tag in place on the specificpage (og:image). An OG image tag gives usthe ability to detect the image on the pageto be used for the newsroom view. You canfind more information on eb/fundamentals/discovery/social-discoveryMy data isn’t showing up in thedashboard. What do I do?This is likely due to Google Analytics not havingdata up until this point in the day. You can eitherwait until this data is available for you or go intosettings and switch the data being used for thedashboard to ‘yesterday’ instead of ‘today’Can I filter Search trends down tocity or region?This is not possible due to limitations in the GoogleSearch trends API. There is no plan at the momentto make this available.24
Do I have to select my GoogleAnalytics account every time?I don’t see any of my authors orcategories in the drop down for theHistoric Performance section.No, once you’ve selected your Google Analyticsaccount and populated RCI with your data, you canbookmark the URL generated or share the URL sothat you can automatically load up your data whenyou use the RCI tool. This URL can also be sharedwith other users as long as they are authorized toaccess this Google Analytics account.You can set this up by going into the settingsscreen and by providing RCI with the GoogleAnalytics Dimension Index number used for authorand category.25
How to use Realtime Content Insights (RCI) 2.0 Select your Google Analytics account Input custom dimensions for Author or Category, modify the data being being used in the dashboards Expand an article or video to see all of the details Use the dashboard to see how your publicati