Transcription
Feature ArticleCite This: J. Phys. Chem. C XXXX, XXX, XXX XXXpubs.acs.org/JPCCPolymer Genome: A Data-Powered Polymer Informatics Platform forProperty PredictionsChiho Kim,†,§ Anand Chandrasekaran,†,§ Tran Doan Huan,‡ Deya Das,† and Rampi Ramprasad*,††Downloaded via GEORGIA INST OF TECHNOLOGY on July 31, 2018 at 18:34:27 (UTC).See https://pubs.acs.org/sharingguidelines for options on how to legitimately share published articles.School of Materials Science and Engineering, Georgia Institute of Technology, 771 Ferst Drive NW, Atlanta, Georgia 30332,United States‡Department of Materials Science and Engineering and Institute of Materials Science, University of Connecticut, 97 North EaglevilleRoad, Storrs, Connecticut 06269-3136, United StatesS Supporting Information*ABSTRACT: The recent successes of the Materials GenomeInitiative have opened up new opportunities for data-centric informatics approaches in several subfields of materials research,including in polymer science and engineering. Polymers, beinginexpensive and possessing a broad range of tunable properties, are widespread in many technological applications. Thevast chemical and morphological complexity of polymersthough gives rise to challenges in the rational discovery of newmaterials for specific applications. The nascent field of polymer informatics seeks to provide tools and pathways for accelerated property prediction (and materials design) via surrogate machine learning models built on reliable past data.We have carefully accumulated a data set of organic polymers whose properties were obtained either computationally (bandgap,dielectric constant, refractive index, and atomization energy) or experimentally (glass transition temperature, solubility parameter, and density). A fingerprinting scheme that captures atomistic to morphological structural features was developed tonumerically represent the polymers. Machine learning models were then trained by mapping the fingerprints (or features) toproperties. Once developed, these models can rapidly predict properties of new polymers (within the same chemical class as theparent data set) and can also provide uncertainties underlying the predictions. Since different properties depend on differentlength-scale features, the prediction models were built on an optimized set of features for each individual property. Furthermore,these models are incorporated in a user-friendly online platform named Polymer Genome (www.polymergenome.org). Systematic and progressive expansion of both chemical and property spaces are planned to extend the applicability of Polymer Genometo a wide range of technological domains.1. INTRODUCTIONThe past few years have seen a surge in the application of datadriven techniques in a plethora of research and developmentfields, ranging from image-recognition1 to drug-discovery.2,3Sophisticated machine learning techniques, initially within thepurview of computer science researchers mainly, are now becoming ubiquitous in many other branches of science and engineering and have the potential to spur technological innovations.In materials science, the increasing availability of largeamounts of data (both computational and experimental) hasled to the prominent field of materials informatics over the pastfew years.4 21 The strategic visions and plans of the MaterialsGenome Initiative (USA)22 and the recent developments of essential infrastructures for materials informatics such as the NOMADLaboratory: a European Centre for Excellence (EU),23 and theMaterials Research by Information Integration Initiative (Japan)are expected to lead to a paradigm shift in the discovery ofnovel functional materials.24Polymers form an important (and challenging) materialsclass. They are pervasive with applications ranging from daily XXXX American Chemical Societyproducts, e.g., plastic packaging and containers, to state-of-theart technological components, e.g., high-energy density capacitors, electrolytes for Li-ion batteries, polymer light-emittingdiodes, and photovoltaic materials. Their chemical and morphological spaces are immensely vast and complex,25 leading to fundamental obstacles in polymer discovery. Some recent successesin rationally designing polymer dielectrics via experiment computation synergies4,5,13,17,26 33 indicate that there may beopportunities for machine learning and informatics approachesin this challenging research and development area.The biggest hurdle of the machine learning approach topolymer discovery is of both scientific and nonscientific innature. The properties of a polymer are strongly dependent ondistinctive factors such as branching, molecular weight distribution, copolymerization, additives, and processing conditions.These factors, along with issues such as nonstandard namingReceived: March 27, 2018Revised: June 27, 2018Published: July 13, 2018ADOI: 10.1021/acs.jpcc.8b02913J. Phys. Chem. C XXXX, XXX, XXX XXX
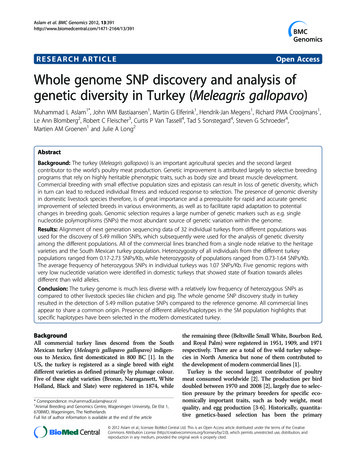
Feature ArticleThe Journal of Physical Chemistry CFigure 1. Overview of our polymer data set used for development of property prediction models.2. DATA SETTwo strategic tracks were followed for the creation of our dataset (see Figure 1): (1) via high-throughput computation usingdensity functional theory (DFT) as presented earlier,26,38,39and (2) by utilizing experimentally measured properties fromliterature and data collections.36,37 The overall data set includes854 polymers made up of a subset of the following species: H,C, N, O, S, F, Cl, Br, and I. Seven different properties wereincluded in the present study. The bandgap, dielectric constant, refractive index and atomization energy were determinedusing DFT computations, and Tg, solubility parameter anddensity were obtained from measurements.All the computational data was generated through a series ofstudies related to advanced polymer dielectrics.26,38,39 Thecomputational data set includes polymers containing the following building blocks, CH2, CO, CS, NH, C6H4, C4H2S, CF2,CHF, and O.13,16,38 40 Repeat units contained 4 8 buildingblocks, and 3D structure prediction algorithms were used todetermine their structure.26,38,39 The building blocks considered in the data set are found in common polymeric materialsincluding polyethylene (PE), polyesters and polyureas, andcould theoretically produce an enormous variety of differentpolymers. The bandgap was computed using the hybrid Heyd Scuseria Ernzerhof (HSE06) electronic exchange-correlationfunctional.41 Dielectric constant and refractive index (thesquare root of the electronic part of the dielectric constant)were computed using density functional perturbation theory(DFPT).42 The atomization energy was computed for all thepolymers following previous work.28 31,39,40,43 48The Tg, solubility parameter and density data was obtainedfrom existing databases of experimental measurements.36,37 Tg,which is an indication of the transition point between theglassy and supercooled liquid phases in an amorphous polymer, is important in many polymer applications because thestructural characteristics (and, consequently, other properties)of the polymer changes dramatically at this point. The solubility parameter of a polymer is typically used to determine asuitable solvent to use during polymer synthesis. In this particular study we consider the Hildebrand solubility parameter,which is also useful to make quantitative estimation of polymer solvent interaction.49 51We have determined the chemical formula and the associated topological structure from the name of polymerslisted in the literature. The data set contains a total of 854organic polymers composed of nine frequently found atomicspecies; i.e., C, H, O, N, S, F, Cl, Br, and I with propertieslisted in the right side panel of Figure 1. Figure 2 shows asummary of the property space for the polymer data set,including the range of property values, distribution, standardconventions, have made it exceedingly difficult to create auniversal polymer database upon which one may base apolymer informatics framework. A detailed analysis of thechallenges faced in this front is presented in a recent reviewpaper by Audus and de Pablo.34We have created an informatics platform capable of predicting a variety of important polymer properties on-demand.This platform utilizes surrogate (or machine learning) models,which link key features of polymers to properties, trained onhigh-throughput DFT calculations and experimental data fromliterature and existing databases. This data set of 854 polymersand the properties considered thus far are summarized inFigure 1. Certain properties, like the atomization energy,depend mainly on the atomic constituents and short-rangebonding, whereas other properties, such as the glass transitiontemperature (Tg), are strongly influenced by morphologicalcharacteristics like the chain-stiffness and branching. We haveconstructed a hierarchical and automated fingerprinting schemeto identify the most important set of features to accuratelydescribe a particular polymer property. The features span multiple length scales and range from 3-atom long fragments todescriptors such as the ratio of side-chain and main-chainatoms. The description of polymers in terms of these fundamental chemical and morphological “building blocks” is whatinspired the coinage of the term “Polymer Genome”. Machinelearning algorithms, specifically those based on Gaussianprocess regression (GPR),35 were used to generate predictivemodels to correlate the polymer’s “genome” to its associated properties. The property prediction models have beenimplemented in an online platform (www.polymergenome.org), to guide polymer choices for further investigation viasynthesis.This article is organized as follows. In section 2, we describethe curation of high-throughput computational data forpolymers built using a set of predefined chemical “blocks”and experimantal data, which were obtained from existingdatabases.36,37 In section 3, we describe the hierarchy of descriptors used to fingerprint the polymers. In section 4, variousaspects of prediction model development, e.g., the fingerprintdimensionality reduction schemes and machine learningalgorithms, are described in detail. The predictive accuracyof the model, using the aforementioned hierarchical fingerprinting scheme, is demonstrated for the particular case of Tg.The performance of the final models for all the properties aresummarized in section 5. In section 6, we provide an overviewof our online polymer property prediction platform. Details ofhow this platform may be used (including how polymers maybe queried using a customized SMILES string language) areprovided separately in the Appendix.BDOI: 10.1021/acs.jpcc.8b02913J. Phys. Chem. C XXXX, XXX, XXX XXX
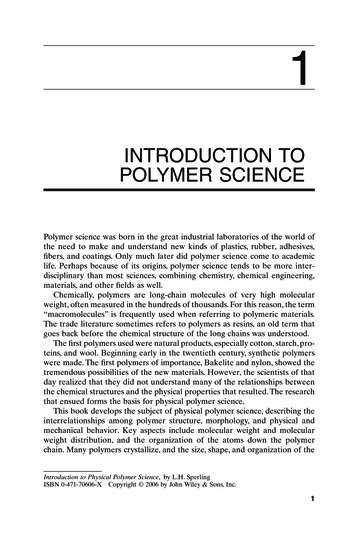
Feature ArticleThe Journal of Physical Chemistry CFigure 2. Property space of Polymer Genome data set. The seven properties considered in this study were the bandgap, dielectric constant,refractive index, atomization energy, Tg, solubility parameter, and density.Examples of such descriptors are van der Waals surface area,56the topological polar surface area (TPSA),57,58 the fraction ofatoms that are part of rings (i.e., the number of atoms associated with rings divided by the total number of atoms in theformula unit), and the fraction of rotatable bonds. TPSA is thesum of surfaces of polar atoms in the molecule and we observedthis descriptor to be strongly correlated to the solubility.Descriptors such as the fraction of ring atoms and fraction ofrotable bonds strongly influenced properties such as Tg anddensity. Such descriptors, 99 in total, form the next set of components of our overall fingerprint.The highest length-scale fingerprint components we considered may be classified as “morphological descriptors”. Theseinclude features such as the shortest topological distancebetween rings, fraction of atoms that are part of side-chains,and the length of the largest side-chain. Properties such as Tgstrongly depend on such features which influence the way thechains are packed in the polymer. For instance, if two rings arevery close, the stiffness of the polymer backbone is muchhigher than if the rings were separated by a larger topologicaldistance. Both the number and the length of the side-chainsstrongly influence the amount of free volume in the polymericmaterial and therefore directly influence Tg. The larger thedeviation and the number of polymers associated with eachproperty.3. HIERARCHICAL FINGERPRINTINGFingerprinting is a crucial step of our data-driven machinelearning approach. In this step, the geometric and chemicalinformation on the polymers is converted to a numericalrepresentation. To comprehensively capture the key featuresthat may control the diversity of properties of interest, we consider three hierarchical levels of descriptors spanning differentlength scales. At the atomic-scale, the occurrence of a fixed setof atomic fragments (or motifs) are tracked.52 An example ofsuch a fragment is O1 C3 C4, made up of three contiguousatoms, namely, a one-fold coordinated oxygen, a 3-fold coordinated carbon, and a 4-fold coordinated carbon, in this order.Such a series of predefined ‘‘triplets” has been shown to be agood fingerprint for a diverse range of organic materials.17,52A vector of such triplets form the fingerprint components atthe lowest hierarchy. For the polymer classes under study,there are 108 such components.Next in the hierarchy of fingerprint components are largerlength-scale descriptors of the quantitative structure propertyrelationship (QSPR) type, often used in chemical and biological sciences, and implemented in the RDKit Python library.53 55CDOI: 10.1021/acs.jpcc.8b02913J. Phys. Chem. C XXXX, XXX, XXX XXX
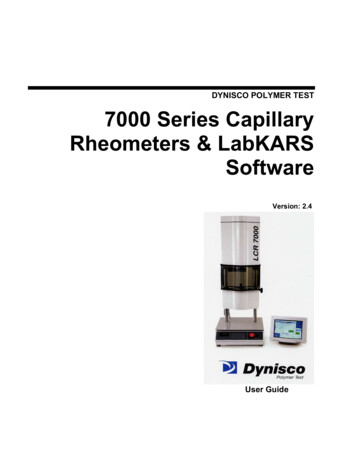
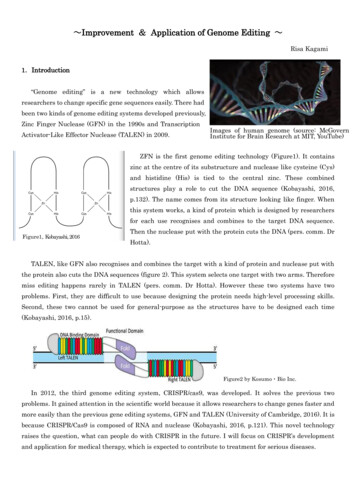
Feature ArticleThe Journal of Physical Chemistry CFigure 3. Hierarchy of descriptors used to fingerprint the polymers, and an example demonstration for the systematic improvement of modelperformance depending on the type of fingerprint considered. (a) Classification of descriptors according to the physical scale and chemicalcharacteristics are shown with representative examples. Dimension of the fingerprint in each level can be reduced by a recursive feature elimination(RFE) process. In the “ RFE” panel, N, Ω, and Emin are total number of features in fingerprint, optimal number of features determined by RFE, andminimum error of prediction model, respectively. Plots at the bottom panel show the performance of machine learning prediction models for glasstransition temperature (Tg) with (b) only atomic level descriptors, (c) atomic level and QSPR descriptors, and (d) entire fingerprint componentsincluding morphological descriptors. (e) How the optimal subset selected by RFE improves the prediction model for Tg.free-volume, the lower the Tg. We include 22 such morphological descriptors in our overall fingerprint.Figure 3a shows the hierarchy of polymer fingerprint, including atomic level, QSPR and morphological descriptors. Theoverall fingerprint of a polymer is constructed by concatenatingthe three classes of fingerprint components. In total, this leads toa fingerprint with 229 components. Subsequently, we showthat the dimensionality of the fingerprints needs to be reducedto improve prediction performance. Also, during performanceassessment, we use different combinations of fingerprint components. For clarity of that discussion, we introduce somenomenclature. The atom triples fingerprint, QSPR descriptors,and morphological descriptors are, respectively, denoted by“A”, “Q”, and “M”. Therefore, “AQ” implies a combination ofjust the atom-triples and QSPR descriptors.In order to visualize the chemical diversity of polymers considered here, we have performed principal component analysis(PCA) of the complete fingerprint vector. PCA identifies orthogonal linear combinations of the original fingerprint componentsthat provide the highest variance; the first few principal components account for much of the variability in the data.7 Figure 4displays the data set with the horizontal and vertical axes chosenas the first two principal components, PC1 and PC2. Molecularmodels of some common polymers are shown explicitly, andsymbol color, symbol size and symbol type are used to represent the fraction of sp3-bonded C atoms, fraction of rings, andTPSA of polymers, respectively. As an example from the figure,PE is composed of only sp3-bonded C without any rings in thechain, while poly(1,4-phenylene sulfide) contains no sp3-bondedC atoms, and more than 90% of its atoms are part of rings. As aresult, these two polymers are situated far from each other in2D principal component space.4. SURROGATE (MACHINE LEARNING) MODELDEVELOPMENT4.1. Recursive Feature Elimination. As alluded to earlier,our general fingerprint is rather high in dimensionality, and notall of the components may be relevant for describing a particular property. In fact, irrelevant features often lead to a poorprediction capability. On the practical side, large fingerprintdimensionality also implies longer training times. There is thusa need to determine the optimal subset of the complete fingerprint necessary for the prediction of a particular property (i.e.,different properties may require different subsets of the fingerprint vector). Rather than manually deciding which fingerprintcomponents to use, one may utilize a wide variety of dimensionality reduction techniques to automatically select a set offeatures that best represent a particular property. In the currentwork, we utilize the recursive feature elimination (RFE) algorithm to sequentially eliminate the least important features fora given property.60 The RFE is an iterative procedure forreducing the number of features by recursively repeating theestimation of feature ranking (importance) and elimination ofthe least important feature. The rightmost panel of Figure 3ademonstrates how the optimal set of features were determinedas the best fingerprint components by RFE. A simple linearmodel was used to rapidly remove unwanted features and thefinal set of features is passed forward to the nonlinear machinelearning algorithm described next in section 4.2. The final setof features selected by RFE can also be used to obtain anDDOI: 10.1021/acs.jpcc.8b02913J. Phys. Chem. C XXXX, XXX, XXX XXX
Feature ArticleThe Journal of Physical Chemistry CFigure 4. Graphical summary of chemical space of polymers considered. 854 chemically unique organic polymers generated by structure predictionmethod (minima-hopping59) and experimental sources36,37 distributed in 2D principal component space. Two leading components, PC1 and PC2,are produced by principal component analysis, and assigned to axes of the plot. Fraction of sp3-bonded C atoms, fraction of rings, and normalizedTPSA per atoms in a formula unit are used for color code, size, and symbol of each polymer. A few representative structures with various number ofaromatic and/or aliphatic rings and their position on the map are shown.intuitive understanding of how certain key fingerprint components influence particular materials properties.4.2. Gaussian Process Regression. In our past work,6,13,26we have successfully utilized kernel ridge regression (KRR)61to learn the nonlinear relationship between a polymer’s fingerprint and its properties. However, in this work we utilizeGPR because of two key benefits. First, GPR learns a generative, probabilistic model of the target property and thusprovides meaningful uncertainties/confidence intervals forthe prediction. Second, the optimization of the model hyperparameters is relatively faster in GPR because one may perform gradient-ascent on the marginal likelihood function asopposed to the cross-validated grid-search which is requiredfor KRR. We use a radial basis function (RBF) kernel definedasÅÄÅÑÉÅÅ (x i x j)2 ÑÑÑ2ÅÑÑ σ 2δ(x , x )k(x i , x j) σ expÅÅÅÑÑnij2ÅÅÑÑ2l(1)ÅÇÑÖwas set aside as a test set. Learning curves for machine learningmodels for each property are shown in Figure S1.4.3. Optimization of Fingerprint Vector. Certain properties, like the DFT-computed atomization energy, dependmainly on the connectivity of the atomic species and onlyweakly on the morphology. As a result, we were able to achieve atest-RMSE of 0.01 eV using just “AQ” components. However,properties such as Tg are dependent not only on the atomicspecies and bonding but they are also strongly influenced by themorphology of the polymer. In Figure 3b, we see how using justthe atom-triplet fingerprint components results in a poor modelfor the Tg with a significantly high RMSE of 51 K. However,adding the QSPR descriptors results in a visible improvementof the model performance, resulting in an RMSE of 39 K(Figure 3c). Two examples of QSPR descriptors which arehighly correlated with Tg are the fraction of rotatable bonds(Pearson correlation 0.66) and the fraction of ring atoms(Pearson correlation 0.63). As the fraction of rotatable bonds isincreased, the polymer chains become more flexible, thusresulting in a decrease in Tg. The fraction of rings is positivelycorrelated with Tg due to the fact that rings increase the stiffnessof the polymer chain thus reducing interchain mobility. The addition of the morphological fingerprints like the number of sidechains and the shortest topological distance between rings further improves the predictive capability of the model (Figure 3d).However, after including all hierarchical levels of the fingerprint, the dimensionality of the fingerprint vector becomes unnecessarily large (229). Subjecting these combined set of fingerprintsto RFE brings down the dimensionality to 69. Through thissystematic process of fingerprint development the final testRMSE for Tg is brought down to 24.2 K (Figure 3e).Similarly, other experimental properties like the solubilityparameter and density showed a strong dependence on the “Q”where σ, l, and σn are hyperparameters to be determinedduring the training process (in the machine learning parlance,these hyperparameters are referred to as signal variance, lengthscale parameter and noise level parameter, respectively). xi andxj are the fingerprint vectors for two polymers i and j. xi isan m dimensional vector with components x1i , x2i , x3i , ., xmi ,determined and optimized by the RFE step described above.Performance of the model was evaluated based on the rootmean-square error (RMSE) and the coefficient of determination (R2). During the surrogate model development stepusing GPR, including substeps for selection of the best combination of fingerprint types, and optimization of dimensionality of the fingerprint by recursive feature elimination (RFE),80% of the data was used for training and the remaining 20%EDOI: 10.1021/acs.jpcc.8b02913J. Phys. Chem. C XXXX, XXX, XXX XXX
Feature ArticleThe Journal of Physical Chemistry Cor “M” type fingerprints. For some cases, the feature elimination process reduces the number of fingerprints to no morethan a dozen or so. For instance, in the case of the refractiveindex, 19 fingerprint components are sufficient to obtain agood model.Table 1. Summary of Fingerprint Used for Development ofMachine Learning Prediction Model and the Performanceof Prediction for Each Propertyapropertybest fingerprintdimension offingerprintRMSEbandgapdielectric constantrefractive indexatomizationenergyglass transitiontemperaturesolubility paramdensityAQM RFEAQ RFEAQM RFEAQ8835192070.30 eV0.480.080.01 eV/atomAQM RFE6918 KAQM RFEAQ RFE2490.56 MPa1/20.05 g/cm35. MODEL PERFORMANCE VALIDATIONThe final machine learning models for each of the properties under consideration here were constructed using theentire polymer data set for each property. To avoid overfitting the data, and to ensure that the models are generalizable,we employed 5-fold cross-validation, wherein the data set isdivided into five different subsets and one subset was usedfor testing while remaining sets were employed for training.Table 1 summarizes the best fingerprint, dimension of fingerprint vector, and performance based on RMSE for the entiredata set.aThe best fingerprint is selected based on average RMSE of test-setfor 100 models (A, atomic level descriptors; Q, QSPR descriptors; M,morphological descriptors; RFE, subject to the RFE process).Figure 5. Performance of the cross-validated machine learning models developed by GPR with combination of RBF and white noise kernels.Comparison of DFT computed (a) bandgap, (b) dielectric constant, (c) refractive index, (d) atomization energy, experimental (e) Tg, (f)Hildebrand solubility parameter, and (g) density for the predicted values are shown with inset of distribution of % relative error, (y Y)/Y 100where Y is DFT computed or experimental value, and y is the machine learning predicted value. Other error metrics including RMSE, meanabsolute error (MAE) and mean absolute relative error (MARE) and 1 R2 are summarized in part h.FDOI: 10.1021/acs.jpcc.8b02913J. Phys. Chem. C XXXX, XXX, XXX XXX
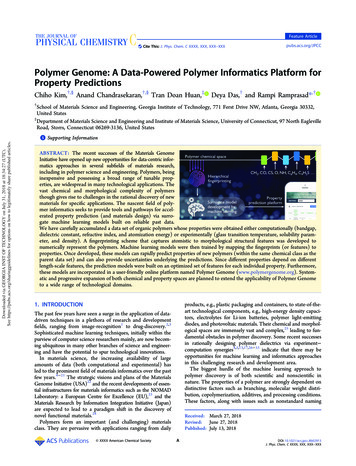
Feature ArticleThe Journal of Physical Chemistry CFigure 6. Overview of the Polymer Genome online platform available at www.polymergenome.org. Keyword Polycarbonothioyl is used as anexample user input to show resulting the Polymer table, and the Polymer details page of the selected polymer among the list.7. CHALLENGES AND OPPORTUNITIESPolymer Genome, including the data set, fingerprinting scheme,and machine learning models, remains in its early stages. Coverage of the polymer chemical space needs to be progressivelyincreased, and further developments in the fingerprintingscheme is necessary to adequately capture conformational(e.g., cis versus trans, tacticity, etc.) and morphological features(e.g., copolymerization, crystallinity, etc.). Any topological ormorphological variations that cannot be well represented bypurely the repeat unit of the polymer (such as irregular sidechains in low-density polyethylene, or cross-linking) wouldindeed require macro-level descriptors to capture variations inthe property space. One such macro-level descriptor could bethe experimentally measured density itself.While our implementation currently reports the Bayesianuncertainty of a particular property prediction, it would also becrucial to carefully investigate the uncertainties and errorsassociated with the underlying experimental measurements.In many cases, properties such as the Tg are reported as a rangerather than a single absolute value and in some cases there is asignificant variation in the measured property depending onthe specific experimental technique utilized. A detailed analysisis currently underway to develop a framework to quantify theseintrinsic uncertainties.Going forward, the process of inverse design, or the autonomous suggestion of materials candidates with user-requestedproperties, would be an invaluable addition to any materialsinformatics platform and preliminary progress on this front hasbeen reported in an earlier work.13 Systematic pathways toachieve such expansions are presently being examined toParity plots in Figure 5 are shown to compare experimentalor DFT computed properties with respect to machine learningpredicted values with percentage relative error distribution.Several error metrics, such as RMSE, mean absolute error (MAE),mean absolute relative error (MARE) and 1 R2 were considered to evaluate the performance of these models, and showntogether in Figure 5h.6. POLYMER GENOME ONLINE PLATFORMFor easy access and use of the prediction models developed here,an online platform called Polymer Genome has been created. Thisplatform is available at www.polymergenome.org.62 The PolymerGenome application was developed using Python and standardweb languages such as Hypertext Preprocessor (php) and Hypertext Markup Language (HTML). As user input, the repeat unit ofa polymer or its SMILES may be used (following a prescribedformat described in the Appendix). One may also use an integrated drawing tool to sketch the repeat unit of the polymer.Once the user input is delivered to Polymer Genome by theuser, property predictions (with uncertainty) are made, and theresults are shown in an organized table. The names of polymers (if there are more than one meeting the search criteria)with SMILES and repeat unit are provided with customizablecollection of properties. Upon selection of any polymer fromthis list, comprehensive information is reported. This one-pagereport provides the name and class of the polymer, 3Dvisualization of the structure with atomic coordinates (if suchis available), and properties determined using our machinelearning models. A typical user output of Polymer Genome iscaptured in Figure 6.GDOI: 10.1021/acs.jpcc.8b02913J. Phys. Chem. C XXXX, XXX, XXX XXX
Feature ArticleThe Journal of Physical Chemistry CTable 2. Example Polymers Specified by Multiple Input TypesPolymer Genome application can handle the followingbuilding blocks: CH2, CH, O, CS, CO, NH, C6H4, C4H2S,C5H3N, C4H3N, CF2, CF, CHF, CCl2, CCl, CHCl, CBr2,CBr, CHBr, CI2, CI, and CHI (Figure S2).There are several other schemes, proposed in earlier studies, torepresent the structure of polymers, such as Wiswesser lineformula notation (WLFN),63,64 SMARTS,65 MDL Molfiles,66 etc.Among these representations, Polymer Genome is capable ofhandling the SMILES format, a powerful representation todescribe the topological structure of molecular systems.67 SinceSMILES was originally developed for isolated molecules, we haveintroduced the following custom variations to extend itsapplicability to polymers: 1) If not specified, the first and lastatoms in the main-chain of the SMILES are the linking atoms ofthe polymer chain. 2) Atoms other than the first and last can alsobe assigned as the linking atoms by adding the special symbol,[*], next to the atom symbol. For example, C(S1) CC C1 isobviously the SMILES of polythiophene with interconnectionbetween the first and the last C atoms, while [*]C(S1) CC([*]) C1 has different connectivity between neighboringrings. This difference of connectivity for these two variants ofpolythiophene can be seen in Table 2. Her
Mar 27, 2018 · This platform utilizes surrogate (or machine learning) models, which link key features of polymers to properties, trained on high-throughput DFT calculations and experimental data from literature and existing databases. This data set of 854 polymers