Transcription
PROTEINS: Structure, Function, and Bioinformatics Suppl 7:225–236 (2005)Progress Over the First Decade of CASP ExperimentsAndriy Kryshtafovych,1 Česlovas Venclovas,2 Krzysztof Fidelis,1 and John Moult3*1Biology and Biotechnology Research Program, Lawrence Livermore National Laboratory Livermore, California2Institute of Biotechnology, Vilnius, Lithuania3Center for Advanced Research in Biotechnology, University of Maryland Biotechnology Institute, Rockville, MarylandABSTRACTCASP has now completed a decadeof monitoring the state of the art in protein structure prediction. The quality of structure modelsproduced in the latest experiment, CASP6, has beencompared with that in earlier CASPs. Significantalthough modest progress has again been made inthe fold recognition regime, and cumulatively,progress in this area is impressive. Models of previously unknown folds again appear to have modestlyimproved, and several mixed / structures havebeen modeled in a topologically correct manner.Progress remains hard to detect in high sequenceidentity comparative modeling, but server performance in this area has moved forward. Proteins2005;Suppl 7:225–236. 2005 Wiley-Liss, Inc.Key words: protein structure prediction, community wide experiment, CASPINTRODUCTIONThe CASP experiments have now spanned a period of adecade, from CASP1 in 1994, to the latest experiment,CASP6, in 2004. The set of results reflect a decade ofdevelopment in protein structure modeling by a largenumber of people— over 200 groups from 25 countriesparticipated in the latest CASP. In this paper, we oncemore provide an overview of progress over the full course ofthe experiments, with particular emphasis on the last two.The papers by the three assessors in this special issue ofPROTEINS focus more on the state of the art now.1,2,3 Theanalysis methods have mostly been introduced in theearlier papers.4,5 New analyses of server performance andimprovement of models over single template copying havebeen added. Details of the CASP6 experiment can be foundin the introduction to this special issue.6GENERAL CONSIDERATIONSChoice of Models to EvaluateAs before, we analyze two aspects of progress— how thequality of the very best models is improving, and to a lesserextent, how the quality of models produced in the field as awhole is advancing. Best performance is evaluated bycomparing the most accurate models of targets of comparable difficulty in different CASPs. Progress in the field asa whole is evaluated by comparing the average accuracy ofthe six best models for a target with the average accuracyof models in other CASPs for targets of similar difficulty. 2005 WILEY-LISS, INC.Relative Target DifficultyThe difficulty of producing a high quality model of atarget protein depends on a number of factors. As in theearlier progress assessments, we use a two-dimensionalscale to estimate difficulty, incorporating the similarity ofthe protein sequence to that of a protein with knownstructure, and the similarity of the structure of the targetprotein to potential templates. Some other significantfactors that affect modeling difficulty are not considered,particularly the number and phylogenetic distribution ofrelated sequences and the number and structural distribution of available templates. The set of related sequenceswill influence whether or not an evolutionary relationshipcan be detected, and also the quality of the alignment thatcan be generated. As discussed later, additional templatesmay provide models for regions of structure not present inthe single best one. These factors add some noise to therelationship between model quality and our difficultyscale.The difficulty of a target is calculated by comparing itwith every structure in the appropriate release of theprotein databank, using the LGA structure superpositionprogram.7 For CASP6, templates were taken from thePDB releases accessible before each target deadline. Templates for the previous CASPs are the same as those usedin the earlier analyses.5 For each target, the most similarstructure, as determined by LGA, in the appropriateversion of the PDB is chosen as the representative template.Similarity between a target structure and a potentialtemplate is measured as the number of target–templateC atom pairs that are within 5 Å in the LGA superposition, irrespective of continuity in the sequence, or sequence relatedness. The 5-Å threshold maintains compatibility with earlier target/template comparisons,4,8,9 whichwere made using Prosup10 software. It is a little largerthan we now consider most appropriate (3.8 Å), and thereGrant sponsor: the National Institutes of Health; Grant number:LM07085-01; Grant sponsor: Howard Hughes Medical Institute; Grantnumber: HHMI-55000341; Grant sponsor: the Sixth European Community Framework Programme; Grant number: MIRG-CT-2004-004543.*Correspondence to: John Moult, Center for Advanced Research inBiotechnology, University of Maryland Biotechnology Institute, 9600Gudelsky Drive, Rockville, MD 20850. E-mail: jmoult@tunc.orgReceived 15 May 2005; Accepted 21 June 2005Published online 26 September 2005 in Wiley InterScience(www.interscience.wiley.com). DOI: 10.1002/prot.20740This article was originally published online as an accepted preprint.The “Published Online” date corresponds to the preprint version.
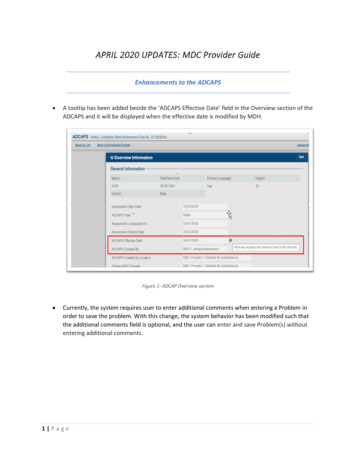
226A. KRYSHTAFOVYCH ET AL.is some times significant superimposability between unrelated structures, particularly for small proteins. Sequenceidentity is defined as the fraction of structurally alignedresidues that are identical, maintaining sequence order.Note that basing sequence identity on structurally equivalent regions will usually yield a higher value than obtainedby sequence comparison alone. In cases where severaltemplates display comparable structural similarity to thetarget (coverage differed by less than 3%), but one hasclearly higher sequence similarity (around 10% or more)the template with the highest sequence identity wasselected. There are a total of 15 of these in previousCASPs, and six in CASP6.DomainsMany target structures consist of two or more structuraldomains. Since domains within the same structure maypresent modeling problems of different difficulty, assessment in CASPs 4 – 6 has treated each identifiable domainas a separate target. Assessors have the advantage ofderiving domains from the experimental structure, whereaspredictors only have the sequence. In any case, domaindefinitions are nearly always subjective. For most of theanalysis, we subdivide comparative modeling and foldrecognition targets into domains only if these divisions arelikely identifiable by a predictor, and require differentmodeling approaches (i.e., belong to different difficultycategories), or the domains are sequentially related todifferent templates. There are six such targets in CASP6,seven in CASP5, three in CASP4, and one each in CASPs 2and 3. For evaluation of nontemplate based models (theFR/A and NF target categories) and some server comparisons, all domains identified by the assessors are treated asseparate targets.TARGET DIFFICULTY ANALYSISFigure 1 shows the distribution of target difficulty for allCASPs, as a function of structure and sequence similaritybetween the experimental structure of each target and thecorresponding best available template. Targets span awide range of structure and sequence similarity in all theCASPs. There are a few very high sequence identitytargets (greater than 50% ID), and these all have highsuperposability with the best template. At lower identities, superposability varies between 80 and 100% fortargets with greater than 30% sequence ID to a template,and is some times as low as 55% for those between 20 and30% sequence ID. Below 20% ID, superposability may fallbelow 50%, even for targets, which are evolutionarilyrelated to a template. As discussed later, low superposability often places a limit on the quality of a model. Ingeneral, the distribution of difficulty is similar for all theCASPs. Figure 1(B) shows the difficulty distribution foronly CASPs 5 and 6, with individual CASP6 targets/domains labeled. The distributions are similar, with 71targets included in CASP6 and 62 in CASP5.For most analysis purposes, it is more convenient to usea one dimensional scale of target difficulty, though thisdoes result in some loss of resolution. As in the previousanalysis, we project the data in Figure 1 into one dimension, using the following relationship:Relative Difficulty (RANK STR ALN RANK SEQ ID)/2,where RANK STR ALN is the rank of the target along thehorizontal axis of Figure 1 (i.e., ranking by percent of thetemplate structure aligned to the target), and RANK SEQ ID is the rank along the vertical axis (ranking bypercent sequence identity in the structurally aligned regions). For the CASP6 analysis, we experimented with 15alternative definitions of difficulty based on both rankingand absolute value schemes. Some placed more weight onsequence identity in high sequence ID cases and moreweight on structural similarity for low sequence ID cases.Alternative difficulty scales were assessed by the correlation between difficulty and the quality of the corresponding best model. In spite of considerable effort put intodevelopment of alternative scales, the original difficultyscheme proved best, and so was retained.For assessment, CASP targets are divided into threecategories of relative difficulty: comparative modeling(CM), fold recognition (FR), and new folds (NF).11 Comparative modeling is subdivided into CM easy (those targetswhere a structural template can be identified by a BLASTsearch) and CM hard (the rest). Fold recognition is dividedinto FR/H: “homologous” (those cases where target andtemplate are similar because of a common ancestor) andFR/A: “analogous” (where target and template are similar,but for which there is no evidence of a common ancestor).These regimes approximately map to the one-dimensionaldifficulty scale, with comparative modeling the easiest,fold recognition in the intermediate difficulty range, andnew fold targets the hardest. However, there is somereordering.OVER-ALL MODEL QUALITYEvaluating the quality of approximate models is notsimple, and a number of new measures have been introduced in CASP. One of the most useful is GDT TS.12 TheGDT TS value of a model is determined as follows. A largesample of possible structure superpositions of the model onthe corresponding experimental structure is generated bysuperposing all sets of three, five, and seven consecutiveC atoms along the backbone (each peptide segmentprovides one superposition). Each of these initial superpositions is iteratively extended, including all residue pairsunder a specified threshold in the next iteration, andcontinuing until there is no change in included residues.7The procedure is carried out using thresholds of 1, 2, 4, and8 Å, and the final superposition that includes the maximum number of residues is selected for each threshold.Superimposed residues are not required to be continuousin the sequence, nor is there necessarily any relationshipbetween the sets of residues superimposed at differentthresholds. GDT TS is then obtained by averaging overthe four superposition scores for the different thresholds:GDT TS 1/4[N1 N2 N4 N8],
PROGRESS IN CASP227Fig. 1. Distribution of target difficulty. The difficulty of producing an accurate model is shown as function ofthe fraction of each target that can be superimposed on a known structure (horizontal axis) and the sequenceidentity between target and template for the superimposed portion (vertical axis). In all CASPs, targets span awide range of difficulty. A: All CASPs. B: CASPs 5 and 6 only. CASP 6 targets are labeled.where Nn is the number of residues superimposed under adistance threshold of “n” Å. GDT TS may be thought of asan approximation of the area under the curve of accuracyversus the fraction of the structure included. Differentthresholds play different roles in different modeling regimes. For relatively accurate comparative models, almostall residues will likely fall under the 8-Å cutoff, and manywill be under 4 Å, so that the 1–2 Å thresholds capturemost of the variations in model quality. In the new foldregime, on the other hand, few residues fall under the 1–2Å thresholds, and the larger thresholds capture most of thevariation between models. In the intermediate fold recognition regime, all four thresholds will often play a significantrole. It is this shift across thresholds that makes the
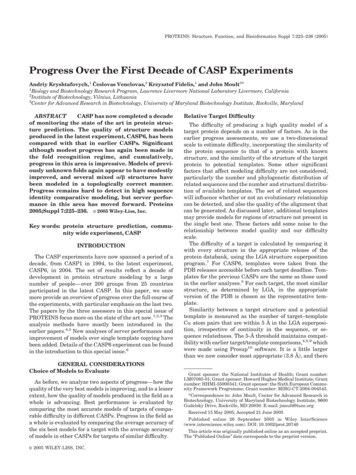
228A. KRYSHTAFOVYCH ET AL.Fig. 2. GDT TS scores for models for targets in all CASPs. Data are smoothed by averaging over sets ofconsecutive targets in each CASP. A: shows the scores for the best models on each target. B: the averagescore over the top six models from different groups. Trend lines show a clear—though some times modestimprovement—from each successive CASP to the next, for both the best models and the best sets of models.GDT TS measure useful (though not perfect) across a widerange of modeling accuracy.In the new fold regime models are often very approximate. In recent CASPs the assessors have found GDT TSa useful measure for identifying interesting models, buthave occasionally visually identified an alternative highest quality model to that found by GDT TS. In thecomparative modeling regime, accuracy improvements arelikely to be relatively small-scale. The CASP6 comparativemodeling assessors have introduced a finer grained measure, GDT TL, where the thresholds are 0.25, 0.5, 1, and 2Å.Figure 2(A) shows the GDT TS scores for the best modelon each target, for all CASPs, with each point an averageover five targets. Quadratic splines have been fitted throughthe data for each CASP.A perfect model would not be expected to have a GDT TSscore of 100, since there are errors in the experimentalstructures. For high sequence ID (ⲏ 30%) targets, onlyX-ray crystallographic structures have been used for evaluation of model quality. Errors in the core of X-ray structures are small, typically a few tenths of an Ångstrom,13but there may be systematic differences from the solutionconformation, caused by the crystal environment. Theseeffects are some times invoked to justify imperfect models.In spite of these factors, the easiest comparative modelingtargets (at far left) do consistently score better than 90 onthe GDT TS scale. These have sequence identities of 50%
PROGRESS IN CASP229Fig. 3. Percent of residues correctly aligned for the best model of each target in all CASPs, smoothed byaveraging over sets of five adjacent targets. Trend lines here follow those in the equivalent GDT TS plot (Fig.2) indicating that for many targets, alignment accuracy, together with the fraction of residues that can bealigned to a single template, dominate model quality.or more to an available template, and usually a highdegree of structure superposability (see Fig. 1). The task ofmodeling structure from sequence will be complete whenalmost all models score better than 90, irrespective oftarget difficulty. It is clear that there is still a long way togo to reach that goal.Nevertheless, there has been very substantial and consistent progress over the CASPs, with the trend line foreach experiment higher than the previous one. Progress isclearest in the mid-range of target difficulty. Here, the bestGDT TS scores have doubled from about 30 in CASP1 to60 in CASP6. According to GDT TS there is little apparentprogress for the closest evolutionary relationships (comparative models at the left hand side of the plot). The moresensitive GDT TL measure does show a slight improvement between CASP5 and CASP6.1 GDT TS is also notoptimal for assessing new fold models (far right), and wereturn to analysis of these later.Figure 2(B) shows the smoothed average GDT TS values over the six best models from different groups, ratherthan the single best. There is a similar improvement trendacross the mid-range of target difficulty, although here thechange from CASP5 to CASP6 is more modest.ALIGNMENT ACCURACYFor models based on an evolutionary relationship, correctalignment of the target sequence onto available templatestructures is a critical and often demanding step. As inprevious analyses, we measure alignment accuracy (AL0) bycounting the number of correctly aligned residues in the LGA5 Å superposition of the modeled and experimental struc-tures of a target. A model residue is considered to be correctlyaligned if the C atom falls within 3.8 Å of the correspondingatom in the experimental structure, and there is no otherexperimental structure C atom nearer.Figure 3 shows the smoothed alignment accuracy for thebest models of each target in all the CASPs. Alignmentaccuracy is near 100% for the easiest targets, but fallssteadily with target difficulty. The spline fits show asteady improvement in alignment accuracy over the CASPs,again most noticeable in the mid-range of target difficulty.It is most dramatic from CASP1 to CASP2, but hascontinued steadily thereafter. The plots show a similardependence on target difficulty as for GTD TS [Fig. 2(A)].As discussed below, alignment accuracy is only one of twofactors contributing to this similarity.ALIGNMENT ACCURACY RELATIVE TOTEMPLATE IMPOSED LIMITSThe fraction of residues that can be aligned is limited bythe fraction of superimposable residues between the targetand template structures. Values above that may be obtained by the use of additional templates, where thesecontribute new information, and by free modeling ofadditional features, such as loops and secondary structureelements. We define the maximum alignability with respect to the best single template as follows: We first find alltarget C atoms that are within 3.8 Å of any template C atom in the 5-Å LGA sequence-independent superposition.Then, we use a dynamic programming procedure thatdetermines the longest alignment between the two structures using these preselected atoms, in such a way that no
Fig. 4. A: Smoothed alignment accuracy and smoothed maximum alignability as a function of targetdifficulty. Targets for CASPs 5 and 6 are shown. Maximum alignability is defined as the fraction of equivalentresidues in a superposition of the target and best template structures. The fraction of this theoretical maximumthat is successfully aligned falls steadily with target difficulty. Residues that cannot be aligned to the besttemplate must either be obtained from additional templates, if available, or modeled using template freemethods. B: Alignment accuracy for the best model of each target in all CASPs, expressed as percent of themaximum number residues that can be aligned by copying from the closest available template structure.Targets are ordered by sequence identity between the target and the closest template. An alignment of 100%indicates that all residues with an equivalent in the template were correctly aligned. A value greater than 100%indicates an improvement in model quality beyond that obtained by copying a template structure. Above 30%sequence identity most, but not all, best models are perfectly aligned to the template. Trend lines show a steadythough some times modest improvement over successive CASPs.atom is taken twice and all the atoms in the alignment arein the order of the sequence. The maximum alignability isthen the fraction of target C atoms in this alignment.Figure 4(A) shows the smoothed alignment accuracy forthe best models of all targets in CASPs 5 and 6 [a subset ofthe data in Fig. 3], together with the smoothed maximumalignability. Alignability falls steadily and approximatelylinearly with increasing target difficulty, but with a smallerslope than that of the fall-off in alignment accuracy. In themid-range of difficulty, best model alignments are typi-
231PROGRESS IN CASPFig. 5. An example of Improvements in a model over copying from a single best template, CASP6 comparative modeling target 199 1. The red curveshows the error in the model, i(model), and the green curve, the “error” in the template, i(template). The blue curve shows the difference, i. In mostregions, the two error curves are similar, and the model has the accuracy obtained by simply copying the template ( i close to zero). Two regions,residues 34 to 50 and 80 to 86, are significantly more accurate than can be obtained from the best template. The lower panel shows where the six besttemplates (best one postitioned lowest) provide a model for which residues. It can be seen that extra information is provided by several templates inthese regions.cally within 20% of optimum, but up to 40% of thestructure cannot be aligned at all.Figure 4(B) shows the alignment accuracy for all CASPs,as a percent of the maximum alignability. Log fits to thedata for each CASP are also shown. Targets are ordered bythe sequence identity between the target and best available template. In all CASPs, the majority of targets withgreater than 30% sequence identity to a template have allpossible residues correctly aligned. The curves show steadyprogress over the CASPs, with the smallest incrementbetween CASP5 and CASP6. Closer inspection shows thatfor the first time in CASP6 there are a few targets at lowsequence identity that have a higher fraction of theresidues aligned than is possible from a single template.FEATURES OF MODELS NOT AVAILABLE FROMA SINGLE BEST TEMPLATEAs noted earlier, not all residues can be modeled bycopying from a single evolutionary related structure. It isof interest to ask whether models contain features notavailable from a single template. Additional features maybe added in three ways: by refining aligned regions awayfrom a template structure towards the experimental one(requiring adjustments of up to about 4 Å), by the use oftemplate-free modeling methods, and by the identificationof features that are present in other available templatestructures. We searched for these “added value” featuresusing an error difference function, : i i(model) i(template),where i(model) is the error in the model for the C atom ofresidue “i,” and i(template) is the distance between thetemplate and target C atoms of residue “i” (the error in acorrectly aligned template-based model at that position).Inter-C distances are taken from the LGA sequenceindependent superposition of target and template. Negative values represent regions of a model that are moreaccurate than could be obtained by simply correctly aligning the single best template.In general, there is no sign of model improvement byrefinement, but occasional utilization of additional templates and limited free modeling is evident.Figure 5 shows results for the CASP6 comparativemodeling target 199 1. The red curve shows the error inthe model, i(model), and the green curve, the “error” in thetemplate, i(template). The blue curve shows the difference, i. In most regions, the two error curves are similar,and the model has the accuracy obtained by simplycopying the template. Two regions, residues 34 to 50 and80 to 86, are significantly more accurate than can beobtained from the best template. The lower panel showswhere the six best templates provide a model for whichresidues. In this case, multiple templates are available formuch of this winged helix structure, and in particular,provide additional information in the two improved regions. The best model likely incorporates information from
232A. KRYSHTAFOVYCH ET AL.one or more additional templates. There are other examples, indicating that current methods are at least sometimes able to successfully combine multiple templates.Some small features, particularly loops between secondary structure elements in comparative models, are builtmoderately accurately by template-free methods. An example is two loops in CASP6 target 266. As noted earlier,there are also a few examples of larger features modeled inthis way, such as a helix in target 205.SERVER PERFORMANCEHuman prediction teams often start with models generated by publicly available servers. Thus, overall progressin server performance has an immediate effect on the art ofprotein structure prediction in general. In addition, servers are the only option for high-throughput modeling, sotheir performance is independently important. We haveexamined server predictions in CASPs 5 and 6, comparingthem to the corresponding human predictions. Approximately the same number of structure prediction serversparticipated in CASP5 and CASP6 (53 and 50 respectively)making the two sets of data comparable.Figure 6(A) shows how many server models were amongthe “best six” for three categories of target difficulty. For“easy” CM targets (CMe, those where a template can bedetected with BLAST), the percent of server models hasrisen by about a factor of two, to the same level as in theother categories ( 20%). In contrast to this, CASP6 serverperformance in the other two categories has slipped slightlycompared to humans, relative to CASP5. Figure 6(B)shows the number of targets with at least one serveramong the best six models and the number of servergroups with at least one model in a top six set, for the easycomparative modeling targets. By these measures too, it isclear that relative server performance has improved forthis class of targets. These analyses are made on allassessor-defined domains.Figure 6(C) shows the ratio of the quality of bestserver models to best human models as a function oftarget difficulty, for CASPs 5 and 6, as measured byGDT TS. By this measure, it is again clear that therehas been an improvement in the relative performance ofservers for comparative models, while in other areas,they are less competitive. “Predictor” domains wereused for this figure.Overall, servers provided the best models (or tied withhumans) for 7% of targets in both CASP5 and CASP6.TEMPLATE FREE METHODSFor “new fold” targets, and most targets judged to besimilar to a known fold because of convergence rather thanan evolutionary relationship (“FR/A” targets), templatefree modeling methods are required. Different factorsaffect the quality of model in this category. In earlyCASPs, structures with a high fraction of structure weremore difficult to model than those that were mostly -helical, though this problem has now largely been solved.Other factors are contact order (how local the contacts inthe experimental structure are, see Bonneau et al.14),domain structure, and size.Fig. 6. A: Percent of server predictions among the “best six models”for three categories of target difficulty in CASPs 5 and 6. Relative serverperformance improved for easy comparative models. (CM: comparativemodels, e: easy, h: hard; FR/H: homologous fold recognition; FR/A:analogous fold recognition; NF: new folds). B: Percent of easy comparative modeling targets for which at least one server is among the top sixbest models, and percent of server groups having at least one model in atop six set. By these measures too it is clear that there has been animprovement in relative server performance for this class of target. C:Ratio of the quality of best server models to best human models as afunction of target difficulty, for CASPs 5 and 6, as measured by GDT TS,averaging over five adjacent points. By this measure, there is a smallimprovement in the relative performance of servers for comparativemodels, while in other areas, server models are less competitive.Because of the lower accuracy of these models, different evaluation methods are required. In earlier analyses, we used the extent of sequence-dependent structuresuperposition to measure model quality, considering thefour terms that contribute to the GDT TS measure,rather than just that single value. That is, the number ofresidues which can be superimposed under 1, 2, 4 and 8Å. Although most observers felt there was progressbetween CASP4 and CASP5, it was difficult to detect bythis measure. We have used the same measure again,and added a second: the fraction of superposed residuesbetween the model and the target, in a structure independent superposition. This measure still requires thatsuperposed residues be in sequence order, and so willnot capture approximate topology features that may bevisually pleasing. For example, the -sheet in the bestGDT TS model of CASP6 target 201 has all strandssuperposed onto target structure strands, but there is
PROGRESS IN CASP233Fig. 7. Model quality for the best (A) and averaged over the six best (B) “new fold” category targets, for CASPs 5 and 6 for each target. The lowestbars show the number of residues superimposed between model and target to closer than 1 Å, the next bar, the number superimposed to 2 Å, then 4 Å,then 8 Å. The open bars show number of residues superimposed to greater than 8 Å. Greek letters indicate the fold type. Targets in each CASP areordered by size. Bars for residues under 8Å are colored orange for CASP6 and green for CASP5.an error in the strand order. We have also added best fit“trend lines” to the analysis, allowing smaller differences in performance to be seen. As in the earlieranalyses, all domains identified by the assessors aretreated as separate targets. Domains which are unambiguously new folds (NF targets) and domains in theanalogous fold recognition category (FR/A) are included,providing a total of 23 targets in CASP5 and 25 inCASP6. The FR/A targets are considered since anyrelationship to a known fold is usually too weak fortemplate-based modeling to be very effective.Figure 7 shows the results of the GDT threshold analysis for CASPs 5 and 6. Targets are ordered by size. Foldtype is indicated by the usual Greek letter classification.The stacked bars show the number of residues superimposed under the distance thresholds of 1, 2, 4, and 8 Å, i.e.,the number of residues for which the largest error is lessthan or equal to each threshold. The RMS error on such aset is typically about half the threshold, thus substructures meeting the 8-Å threshold would usually be judgedexcellent by visual inspection.In Figure 7(A), the performance in ter
Progress Over the First Decade of CASP Experiments Andriy Kryshtafovych, 1Cˇ eslovas Venclovas,2 Krzysztof Fidelis, and John Moult3* 1Biology and Biotechnology Research Program, Lawrence Livermore National Laboratory Livermore, California 2Institute of Biotechnology, Vilnius, Lithuania 3Center for Adv