Transcription
An Introduction to SASTo open the SAS software using University of Iowa Virtual Desktop.1. Go to https://virtualdesktop.uiowa.edu2. Log on with your hawkid and password3. Choose SAS 9 4 64bit.IMPORTANT NOTES: Personal-laptop access - If you are using a personal laptop, you will need to have the CitrixWorkspace App installed to run SAS through virtual desktop. Off-campus access - If you want to access SAS from off-campus, you will need to use VirtualPrivate Network (VPN). Files in your university home drive folder (H : drive) are accessible through virtual desktop.Contents1 Launching SAS22 Introduction to SAS23 Basic SAS Programming Structure34 Quick Examples4.1 Dataset Creation . . . . . . . . . . . . . . . . . . . . . . . . . . . . . . . . . . . . . .4.2 Plot of Y vs. X . . . . . . . . . . . . . . . . . . . . . . . . . . . . . . . . . . . . . . .4.3 Descriptive Statistics by a Factor . . . . . . . . . . . . . . . . . . . . . . . . . . . . .33455 Setting Preferences for Output66 Options77 Creating Datasets and Importing Data into SAS78 Printing Dataset to Output Window99 Simple plots910 Other SAS Resources121
1Launching SASAfter launching SAS, four windows will appear: The Editor window is where syntax and commands are kept (the script). Saved as a .sas file. The Log box gives you run information after running programs and provides error statements. The Output window is where listing (i.e. text) results will appear. Saved as a .lst file. The Explorer gives you you quick folder access to files (you can close this window if you like).2Introduction to SASSAS is a command-driven statistical package; you enter statements in SAS’s language, submit thestatements, and then get results output. A fairly friendly user interface is provided to help withthis. You enter your SAS statements in an Editor window, then click on a Submit button (arunning-man icon at the top of the GUI), and the results appear in an Output window (simple textlisting output), and/or HTML output in the Results Viewer window. If your code uses PROC GPLOTor SGPLOT you will also generate a GRAPH window. There is also a Log window that displaysmessages, and an explorer window that allows you to navigate the results and your datasets.As you read this handout, I suggest that you start up SAS, and copy/paste these statementsinto SAS’s editor and submit them. If you highlight a portion of a SAS program in the Editorwindow and click Submit (i.e. click on the running-man), only the highlighted portion is submittedto SAS. Otherwise, everything in the Editor window is submitted.2
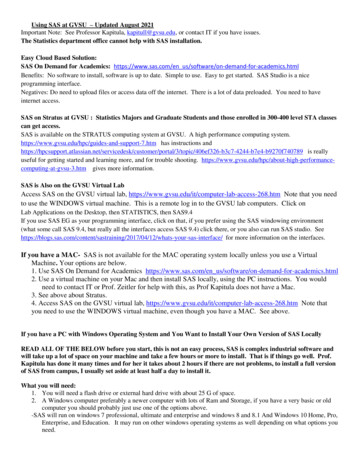
3Basic SAS Programming StructureSAS programs consist of three types of building blocks: options statements (options are globalinstructions that affect the entire SAS session and control the way SAS performs operations), datasteps (for creating data sets, or manipulating datasets), and proc steps (for doing analyses). Thishandout gives you a few basic examples. Notice the usage of the semicolon throughout the SAScode to end each statement.44.1Quick ExamplesDataset CreationWe will use a SAS dataset supplied by Dean, Voss, and Draguljic for a quick example here. Goto the author’s website and select the SAS data link. Click on the balloon.sas file. This textrepresents a .sas file, or a file that is opened in the editor window. You could save this file fromthe web and then open it in SAS, or you can simply copy and paste into the editor window. Youshould have something similar to what is shown below after copying and pasting:After you’ve copied and pasted the code into the editor, run the code (first click on the editorwindow to make it the active window, then click the running-man icon) which simply creates adataset called balloon containing three numeric variables called order, color, and time, usingthe lines statement. If you click on the log box, you’ll see that SAS tells you it created a datasetcalled balloon with 32 observations and 3 variables.Save this file as balloon.sas for later use.3
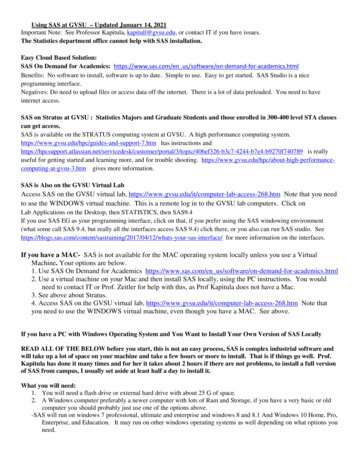
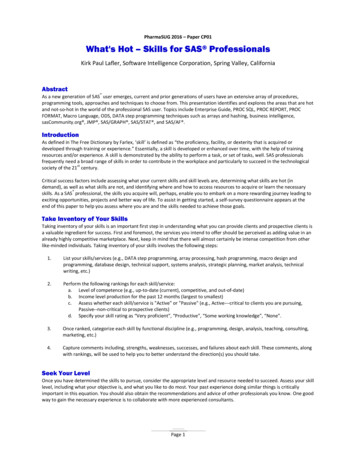
4.2Plot of Y vs. XAdd the following three lines of code to your balloon.sas file (at the bottom). Run the code to geta plot of time against color for the balloon dataset. Here, we are using the proc gplot statement tocreate our plot. We state our X (color) and Y (time) axis variables in the plot statement.SAS statement(s)proc gplot data balloon;plot time*color;run;Graph1 WindowGraphics can be exported and saved in a variety of formats, otherwise, you can simply take a screenshot and save as a .png for later use.4
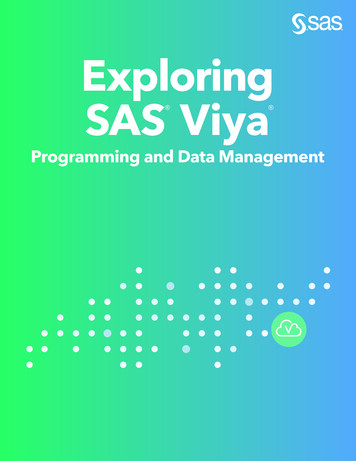
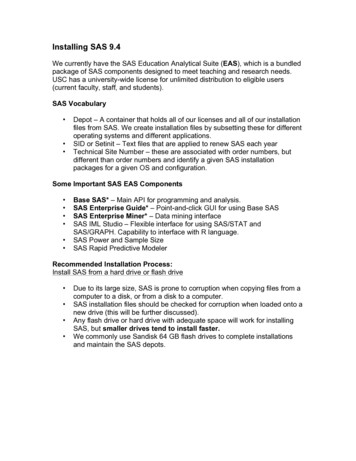
4.3Descriptive Statistics by a FactorGet the time mean (and some other statistics) for each color. The dataset must first be sorted bycolor. Also, save the information in a new dataset called ‘mymeans’.SAS statement(s)proc sort data balloon;by color;proc means data balloon;var time;by color;output out mymeans;run;Results Viewer WindowPrint the new dataset.SAS statement(s)proc print data mymeans;run;5
Output (Listing) WindowThe SAS 18753.0216Setting Preferences for OutputBy default, you will receive output in HTML format. HTML output is nice for graphics, butI’ve also found the HTML table output sometimes difficult to deal with (like when I’m trying tosave pieces of it). Therefore, I also generate all my output as a ‘listing’ which appears in myOutput window. This output is simply text and can easily be copied and pasted as desired. Ifyou are on virtual desktop, you can choose to generate both HTML and listing output by going to.Tools -- Options -- Preferences.Then click the Results tab, and check the box that says ’Create Listing’. Then OK.This listing output (Output window) is just text and you can easily copy and paste the pieces intoWord or LaTeX using the ‘verbatim’ environment to present it. If you copy and paste into Word,you should use a monospace font, such as Andale Mono or SAS monospace to maintain columnspacing. If you don’t, you may find that you have very ugly results reporting like below (we cando better than this).6
If you save your listing output it will be as a .lst file.6OptionsAssuming you want to copy/paste SAS listing output into a report in Word or LaTeX, for example,you should begin your SAS program with a statement like this:SAS statement(s)options ls 79 nocenter nodate nonumberformchar " ---- --- -/\ *" ;This sets up a suitable maximum width, disables centering and page numbers, and specifies thecharacters to use as rules around tables and such.7Creating Datasets and Importing Data into SASThe following illustrates using a data step to enter data into SAS. We also compute a new variable,logcount. Note that each SAS statement ends with a semicolon. Additional spacing or line breakswithin a statement may be used as desired. A semicolon alone is a valid SAS statement, andsuch blank statements are used to signal the end of the input data. You can include commentsas below using the pair of /*comment*/ format. When reading-in character variables with theinput statement, you need to let SAS know this by following the variable name with a dollar sign . Without the dollar sign you’ll get an ‘invalid data’ error in the Log window.7
SAS statement(s)data meat;input run pkg count;logcount log10(count);datalines;1 um41000005MixedGas260000006 1900000010CO2110000011MixedGas 10000000012 Commercial 0000016 Commercial 38000000017MixedGas 34000000018 Commercial 55000000019Vacuum5100000020CO27200000;/* ‘cards’ or ‘lines’ will do the same.*/Log WindowNOTE: The data set WORK.MEAT has 20 observations and 4 variables.NOTE: DATA statement used (Total process time):real time0.01 secondscpu time0.01 secondsAs below, when we have the data as a separate file, we can use the PROC IMPORT statement to readit into SAS. Common dbms specifications available are CSV, EXCEL, TAB.SAS statement(s)proc import datafile "\\Client\H \Iowa classes\examples\sales.csv"out salesdbms CSVreplace;run;8
8Printing Dataset to Output WindowAfter the data are read into SAS, it’s a good idea to print it on the screen to verify things. SASwon’t actually run a proc until it sees another proc or data step, or a run statement. If you arerunning this as a tutorial, copy and paste the previous statements creating the data set called meatand then copy and paste the statement below into SAS’s editor window. With the mouse, highlightjust the proc print statement. Then click the Submit button. SAS will not complain, but you won’tget any output because SAS thinks there may be more statements specifying what to do in procprint. Now highlight just the run; line, click Submit, and youll see the printout.SAS statement(s)proc print data meat;run;Or if you just want to print the first 8 observations.SAS statement(s)proc print data meat (obs asVacuumMixedGasCommerciCO2VacuumOutput .612787.414977.826075.579787.14613Simple plotsPROC PLOT produces text-based graphics; there is also a PROC GPLOT that we saw earlier that makeshigher-resolution plots. And since SAS 9.1, there’s also PROC SGPLOT. But text plots work nicely forsome simple purposes, especially diagnostic plots. Here is a simple way to get side-by-side dotplotsof the data. Text plots always fill up a page, and since we want this one to be short and squat,we set the pages to be only 16 lines high using the options statement. You need a run statementbefore we set it back to a normal page size; otherwise, the re-sizing goes into effect before the graphis constructed.9
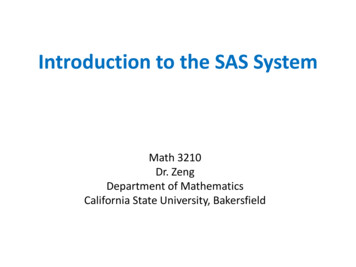
SAS statement(s)options ps 16;/* Set short page size for character-based plot */;proc plot data meat;plot pkg * logcount;run;options ps 60;/* Go back to normal page size */Results Viewer window10
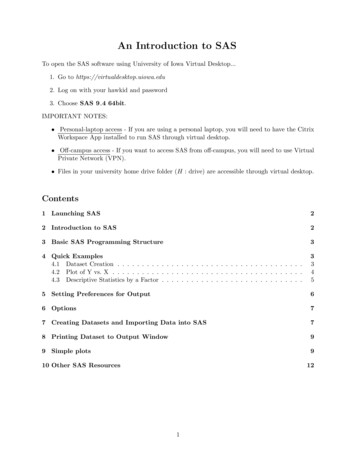
Or using a higher resolution procedure as we saw earlier.SAS statement(s)SYMBOL1 i none value circle c black height 2;proc gplot;plot logcount*pkg;run;Results Viewer window11
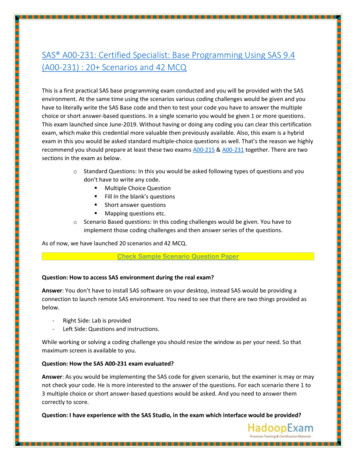
10Other SAS Resources The on-line documentation for SAS is rally vast. If you google a particular procedure ormodel with ‘SAS’ in your search, you’ll usually find some SAS documentation for it. Forexample, we’ll use PROG GLM often in the start of the class. Here is a screen shot of the topof the help page on syntax.12
The UCLA Institute for Digital Research & Education (IDRE) has some useful SAS tutorialinformation on-line at ‘SAS learning Modules’.13
To open the SAS software using University of Iowa Virtual Desktop. 1.Go to https://virtualdesktop.uiowa.edu 2.Log on with your hawkid and password 3.Choose SAS 9 4 64bit. IMPORTANT NOTES: Personal-laptop access - If you are using a personal laptop, you will need to have the Citrix Workspace App installed to run SAS through virtual desktop.