Transcription
DEMOGRAPHICS & DATA
“The goal is to transform datainto information , andinformation into insight .”– Carly Fiorina
11 MILWAUKEE CITYWIDE POLICY PLAN
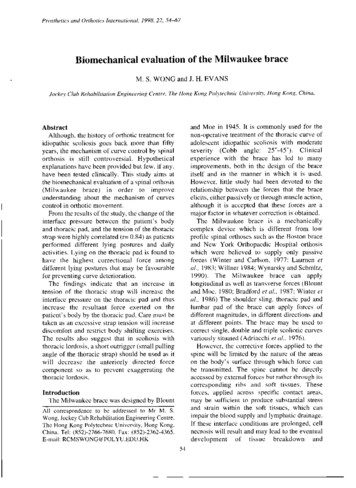
This chapter presents data and trendsin the city’s population over time, futureforecasts, and the spatial distributionof these characteristics across thecity. This information is highly usefulin establishing policies and programsintended to improve the city’s livability,economic strength, and other assets.More detailed information on specificareas of the city can be found in theArea Plans.POPULATION TRENDS ANDPROJECTIONS 1960-2025Like many major American cities,the City of Milwaukee experiencedpopulation decline for several decadesfollowing its historic peak of 741,324 in1960. The migration of city dwellers tothe suburbs that began with theautomobile was accelerated bymassive freeway development in the1950s and the development of newer,larger housing options in outlyingareas. Smaller family size, loss ofmanufacturing jobs, and other factorsexacerbated the loss of population inthe city.In 2000, the city’s population hadfallen to 596,974, a 19% decline from1960 levels. The city’s proportion ofMilwaukee County’s population alsofell during this period. In 1960, thecity made up 71.6% of the county’spopulation and in 2000 that percentagehad decreased to 63.5%. (U.S. CensusBureau)Since 2000, however, the city’spopulation has stabilized and begun togrow once more. The 2008 AmericanCommunity Survey (ACS) estimatesMilwaukee’s population at 604,477,making it the 23rd largest city in theU.S., similar in size to Boston, Seattle,and Washington, DC.According to Wisconsin Department ofAdministration (WisDOA) projections,Milwaukee’s population will continue togrow slightly in coming years. Between2000 and 2025, WisDOA forecasts thatMilwaukee’s population will increaseby 4.3% to approximately 623,000(Figure 1). Natural increase (birthsminus deaths) and in-migration by theHispanic population account for muchof the expected increase.HOUSEHOLDSAs with population, the number ofhouseholds in the City of Milwaukeeis expected to increase modestly incoming years. From 2000 to 2025,the number of households in theFigure 1 - Source U.S. Census Bureau and WisDOADATA AND DEMOGRAPHICS 12
Figure 2 - Source U.S. Census Bureau and WisDOAcity is expected to rise by 24,000or 10.1% (Figure 2). Based onthis projected increase, as well aspotential for changing characteristicsof households (empty nesters, singleparent, alternative lifestyles, etc), thecity will need to develop sufficient anddiverse housing choices to providefor these additional households.(WisDOA)The higher rate of household growthcompared to population growth islargely due to the city’s decreasingaverage household size. The averagenumber of persons per household inMilwaukee has declined from 2.61in 1990 to 2.57 in 2000 and 2.43in 2005, a trend that is expectedto continue. (U.S. Census Bureau)Reasons for this decrease includelower birth rates, higher divorce rates,13 MILWAUKEE CITYWIDE POLICY PLANpostponement of marriage, and longerlife expectancy.HOUSING UNITS AND OCCUPANCYAccording to the 2008 ACS,Milwaukee had 249,302 housing unitsin 2008 and a median home valueof 147,900. The data also showsthat the city’s housing stock is aging.Over 105,000 of these units were builtbefore World War II, while less than20,000 units have been built since1980. Milwaukee’s housing types,age, and value are shown in Figure 3.U.S. Census data shows that thetotal number of housing units inMilwaukee declined by approximately2% between 1990 and 2000, and hassince remained stable (Figure 4). TheCensus also indicates that housingvacancy has more than doubled in thecity since 1990. The housing vacancyrate was 11.3% in 2008, up from 6.8%in 2000 and 5.4% in 1990. During thisperiod, the owner-occupied housingrate remained stable, but the renteroccupied housing rate declined byapproximately 6%. It should be noted,however, that the recent housingcrisis has resulted in a spike inforeclosures and pushed demand tothe rental market, so this data hasalready become outdated. Anotherpossible reason for the decrease inhousehold size is out-migration offamilies with school aged children tothe surrounding suburbs.
Housing Type, Age and ValueUnits in StructureSubtotalTotal housing units249,302Built 2000 to 20085,608Less than 50,0003,6581-unit, detached104,946Built 1990 to 19995,627 50,000 to 99,99919,4321-unit, attached14,291Built 1980 to 19898,287 100,000 to 149,99931,2952 units55,391Built 1970 to 197918,322 150,000 to 199,99930,7653 or 4 units17,701Built 1960 to 196926,800 200,000 to 299,99915,8785 to 9 units11,916Built 1950 to 195952,671 300,000 to 499,9993,61510 to 19 units11,428Built 1940 to 194926,435 500,000 to 999,99977720 or more units32,634Built 1939 or earlier 1,000,000 or more498Mobile homeYear Structure BuiltNumber105,552995ValueNumberMedian (dollars)147,900Figure 3 - U.S. Census Bureau, American Community Survey, 2008Housing Stock and Occupancy1990Number2000%All housing units254,204100.0%Occupied housing units240,540Owner-occupied housing unitsRenter-occupied housing unitsVacant housing unitsNumber2008%Number%249,225 100.0%249,302 7646.2%13,6645.4%17,0376.8%28,10811.3%Figure 4 - Source U.S. Census Bureau and WisDOADATA AND DEMOGRAPHICS 14
DEMOGRAPHIC TRENDSMilwaukee is the most racially andethnically diverse city in Wisconsinand is substantially more diverse thanMilwaukee County, the metropolitanarea, and the State as a whole.According to ACS 2008 data, whilecity residents make up 63% of totalMilwaukee County population, theyaccount for 88% of the county’s minoritypopulation. This includes 96% of thecounty’s African American populationand 81% of Hispanics. Milwaukeerecently became a minority-majoritycity, and today approximately 53%of city residents are racial and ethnicminorities (Figure 5). (ACS 2006-2008)The racial and ethnic compositionof Milwaukee continues to change.Milwaukee’s White population hasdeclined in each of the last threecensus years (1980, 1990, and 2000),though it has since stabilized andstarted to rise. The population of AfricanAmericans, Hispanics, and Asianshave all steadily increased. The city’sHispanic community in particular hasgrown dramatically in recent years, from6.3% of the city total in 1990 to 15.1%in 2008. (U.S. Census 1990 and 2000,ACS 2008)other racial category. African Americanshave the lowest male-to-female ratiowith only 46% male. (Census 2000)As Figure 6 indicates, Milwaukee’syounger population is largely minorityand its older population is largely White.Minority children under 10 years of age,for example, outnumber White childrenthree to one, while White residents over70 outnumber minorities by nearly fourto one. (Census 2000)AGE DISTRIBUTIONThe population of Milwaukee isgradually getting older. From 2000to 2008, median age increased from30.6 to 32.0. Similarly, the percentageof people age 45 and older wasapproximately 32% in 2008, anincrease from 29% in 2000 and 28% in1990. (U.S. Census Bureau)Census tract maps show that racial andethnic groups are heavily concentratedin certain areas of the city (Figure 7).African Americans, for example, livepredominately on the near north side,while most Hispanics live on the nearsouth side.GENDERA slight majority (52%) of Milwaukee’spopulation is female, though thisdistribution varies among racialand ethnic groups. Hispanic andAsian males outnumber their femalecounterparts, for example, whilefemales outnumber males in everyFigure 5 - Source U.S. Census Bureau, American Community Survey 2006-200815 MILWAUKEE CITYWIDE POLICY PLANThe age of the population variesthroughout the city. For example, thenear north and near south sides areskewed towards a younger population.Conversely, between 1990 and 2000the percentage of the population 65years and older increased the most onthe northwest, north, and south sides.The 5-17 age range expanded whilethe 55-64 age range contracted duringthe same period. (U.S. Census Bureau)The age distribution of the populationis a key factor in housing planning,because family formation is a drivingforce of housing need.
Figure 6 - Source U.S. Census Bureau 2000African American and Hispanic PopulationsFigure 7 - Source U.S. Census Bureau 2000DATA AND DEMOGRAPHICS 16
EDUCATIONThe 2008 ACS indicated thatapproximately 19.7% of Milwaukeeresidents 25 years and older did notgraduate from high school (Figure 8).Compared with Census 2000 figures(25.2%), this percentage is on thedecline. Conversely, the percentageof Milwaukeeans with a collegedegree is on the rise. In 2000, theU.S. Census Bureau reported that18.3% of Milwaukee residents helda Bachelor’s Degree or higher, whilethe 2008 ACS shows 21.9% held aBachelor’s Degree or higher in 2008.While Milwaukee’s college graduationrate is increasing, the city’s rate is stillsignificantly lower than MilwaukeeCounty (27.6%) and the nationalaverage (27.7%).Asians and Whites are the groupswith the highest percentage of collegegraduates in the City of Milwaukee,while other groups have substantiallylower proportions of college graduates.Educational attainment varies widelyby race and neighborhood throughoutthe city. In general, Whites are morelikely than minorities to graduatefrom high school. Less than half(45%) of Hispanics 25 years andolder in Milwaukee hold high schooldiplomas. In the other minority groups,approximately two-thirds are highschool graduates, compared to roughlyfour out every five Whites (84%)(Figure 9).Educational AttainmentFigure 8 - Source U.S. Census Bureau, American Community Survey 20082007-2008 High School GraduationRate by Race/EthnicityThe near north and near south sidesin particular have low percentages ofhigh school graduates. Several censustracts in both areas contain fewer than50% of residents 25 years and olderholding high school diplomas (Census2000) (Figure 10).Figure 9 - Source DPIFigure 11 shows the highest educationlevel completed by residents ofMilwaukee 25 years and older in 2005by race.17 MILWAUKEE CITYWIDE POLICY PLAN
Percent Persons 25 or Older High School Graduates, 2000Figure 10 - Source U.S. Census Bureau 2000Figure 11 - Source U.S. Census Bureau 2000DATA AND DEMOGRAPHICS 18
INCOMEThe median Milwaukee household incomein 2008 was 37,331, up from 32,316in 2000 (Figure 12). The city median issomewhat lower than Milwaukee County’smedian of 45,909 and substantially lowerthan the statewide median of 52,094. In2008, nearly half (47%) of the householdsin Milwaukee earned less than 35,000 peryear. (U.S. Census Bureau)Household income shows a similargeographic pattern as education. Most of thecensus tracts with a 1999 median householdincome of less than 17,500 were located inthe same census tracts as those with a lowpercentage of high school graduates (Figure13).The poverty rate in Milwaukee has remainedabove 20% since 2002, and in 2006 thecity’s poverty rate peaked at 26.2%, ranking8th among U.S. cities with populations over250,000 (Figure 14). Since then, there hasbeen a modest improvement in the povertyrate, but poverty continues to be a majorchallenge for the city. The poverty rate in thesurrounding area is considerably lower. In2008, Milwaukee County’s poverty rate was16.8% and Waukesha County and OzaukeeCounty were at 3.9% and 3.6% respectively.City of Milwaukee Income DistributionTotal households221,194Less than 10,00012.0% 10,000 to 14,9998.2% 15,000 to 24,99913.9% 25,000 to 34,99913.0% 35,000 to 49,99915.7% 50,000 to 74,99918.9% 75,000 to 99,9999.4% 100,000 to 149,9996.5% 150,000 to 199,9991.5% 200,000 or more1.0%Median household income (dollars)37,331Mean household income (dollars)47,900Total householdsFigure 12 - Source U.S. Census Bureau 20001999 Median Household IncomeEMPLOYMENTIn Milwaukee, the number of people in thelabor force has been showing an overalldownward trend since 1995. The numberof employed Milwaukeeans has showna similar trend (Figure 15). This patterngenerally follows the overall populationtrends in the city.It is important to note that unemploymentrates count only those who do not havea job and are actively looking for work asunemployed; those who have no job and arenot looking for one are counted as not in thelabor force.Figure 13 - Source U.S. Census Bureau, 200019 MILWAUKEE CITYWIDE POLICY PLAN221,194
Figure 14 - Source U.S. Census Bureau, American Community SurveyEmployment Over TimeYearLabor 8,65518,3656.6Figure 15 - Source U.S. Bureau of Labor Statistics, 2009DATA AND DEMOGRAPHICS 20
The city’s unemployment rate was stablefrom 1995 to 2000 at just over 5%. For eachof the next three years the rate rose, reachinga high of 8.8% in 2003 before declining again(Figure 16).Resident EmploymentThe recent economic recession has pushedthe unemployment rate up once more. In2009 Milwaukee’s unemployment peakedat 12.9%, while the most recent data fromNovember of 2009, indicates unemploymentat 10.9% (not seasonally adjusted).DEMOGRAPHICS AND EMPLOYMENTEmployment in Milwaukee varies significantlyby race and geography. In 2000, AfricanAmericans had the highest unemploymentrate of any race at over 16%. Hispanics andAmerican Indians both had rates around12% and Asians and Whites had the lowestrates with 10% and 5%, respectively. AfricanAmerican and Asian populations had thehighest percentage of people not in the laborforce; both over 39%. American Indians andWhites had the lowest rates of people not inthe labor force, less than 34%.Figure 16 - Source Bureau of Labor Statistics, Local Area Unemployment StatisticsPercent Persons 16 and OlderNot in Labor Force, 2000The central city had the highest unemploymentrates and the highest concentration ofresidents 18 years and over not in the laborforce, with many census tracts at 45% or more(Figure 17). The greatest concentration ofunemployment is on the city’s near north side.In 2006, the Trade, Transportation, and Utilitiesindustry sectors, taken together, accountedfor the greatest share of employment inmetropolitan Milwaukee (17.4%), followed byEducational and Health Services (16.2%), andManufacturing (16.1%) (Figure 18). (Bureau ofLabor Statistics)In 1990, these same industries alsoaccounted for the greatest number ofemployees. Since 1990, Education & HealthServices has been the fastest growing ofthese industries. Manufacturing remains amajor source of employment in the area butthe number of people employed is in slightdecline (Figure 19). The City of Milwaukee issecond only to San Jose among U.S. cities inthe percentage of residents employed in theManufacturing sector. (Milwaukee 7)21 MILWAUKEE CITYWIDE POLICY PLANFigure 17 - Source U.S. Census Bureau 2000
Figure 18 - Source U.S. Bureau of Labor Statistics, 2006Figure 19 - Source U.S. Bureau of Labor Statistics – Worknet Wisconsin 2006DATA AND DEMOGRAPHICS 22
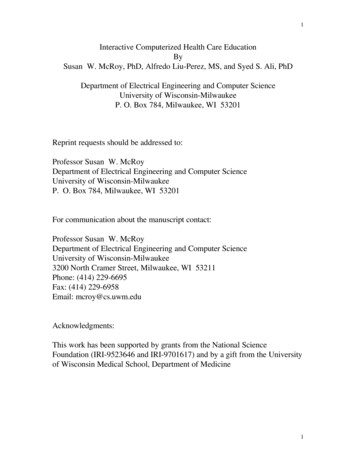
EMPLOYMENT PROJECTIONSTotal employment is expected to grow by 13.4% for the metropolitan Milwaukee workforce (Milwaukee, Waukesha,Ozaukee, and Washington Counties) from 2004 to 2014. Figure 20 below shows that Manufacturing is the only sectorforecasted to decrease in total number of jobs over this time. The fastest growing sector will continue to be Education andHealth Services, which is expected to grow by 24.0%.Employment ProjectionsIndustry EmploymentEmployment Change2004-2014PercentageChangeTotal Non-Farm ining/Natural 0134,210-1,730-1.3%Fabricated Metal Products23,13023,7306002.6%Machinery Mfg22,10020,240-1,860-8.4%Electrical Equip, Appliance, and Component %16,43017,1206904.2%Transportation and Utilities (Including US Postal)35,10039,4504,35012.4%Financial Activities57,15064,5207,37012.9%Education and Health Services (Including Stateand Local Gov Educ and Hosp)164,390203,81039,42024.0%Ambulatory Health Care Services31,75043,39011,64036.7%Hospitals (Including State and Local Government)34,08041,8107,73022.7%Leisure and Hospitality66,00076,03010,03015.2%Information/Prof Services/Other Services169,860201,57031,71018.7%Government (Excluding US Postal, State andLocal Educ and Hosp)39,79041,4301,6404.1%TradeFood and Beverage StoresFigure 20 - Source Wisconsin Department of Workforce Development23 MILWAUKEE CITYWIDE POLICY PLAN
DATA AND DEMOGRAPHICS 24
before World War II, while less than 20,000 units have been built since 1980. Milwaukee’s housing types, age, and value are shown in Figure 3. U.S. Census data shows that the total number of housing units in Milwaukee declined by approximately 2% between 1990 and 2000, and has since remai