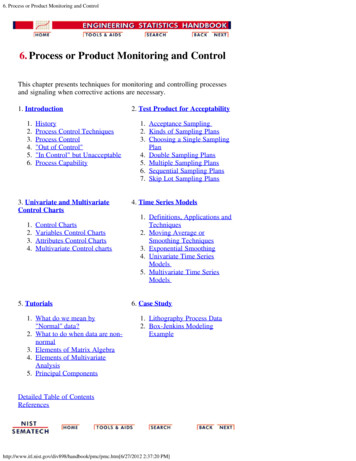
Transcription
Chapter 5Statistical Quality Control, 7th Edition by Douglas C. Montgomery.Copyright (c) 2013 John Wiley & Sons, Inc.1
Learning ObjectivesChapter 5Statistical Quality Control, 7th Edition by Douglas C. Montgomery.Copyright (c) 2013 John Wiley & Sons, Inc.2
Basic SPC ToolsChapter 5Statistical Quality Control, 7th Edition by Douglas C. Montgomery.Copyright (c) 2013 John Wiley & Sons, Inc.3
5.2 Chance and Assignable Causes of Variation A process is operating with only chance causes of variation present is said tobe in statistical control. A process that is operating in the presence of assignable causes is said to beout of control.Chapter 5Statistical Quality Control, 7th Edition by Douglas C. Montgomery.Copyright (c) 2013 John Wiley & Sons, Inc.4
5.3 Statistical Basis of the Control Chart A control chart contains– A center line– An upper control limit– A lower control limit A point that plots within thecontrol limits indicates theprocess is in control– No action is necessary A point that plots outside thecontrol limits is evidence that theprocess is out of control– Investigation and correctiveaction are required to find andeliminate assignable cause(s) There is a close connectionbetween control charts andhypothesis testingChapter 5Statistical Quality Control, 7th Edition by Douglas C. Montgomery.Copyright (c) 2013 John Wiley & Sons, Inc.5
Photolithography Example Important quality characteristic in hard bake is resist flow width Process is monitored by average flow width– Sample of 5 wafers– Process mean is 1.5 microns– Process standard deviation is 0.15 microns Note that all plotted points fall inside the control limits– Process is considered to be in statistical controlChapter 5Statistical Quality Control, 7th Edition by Douglas C. Montgomery.Copyright (c) 2013 John Wiley & Sons, Inc.6
Determination of the Control LimitsChapter 5Statistical Quality Control, 7th Edition by Douglas C. Montgomery.Copyright (c) 2013 John Wiley & Sons, Inc.7
Shewhart Control Chart ModelChapter 5Statistical Quality Control, 7th Edition by Douglas C. Montgomery.Copyright (c) 2013 John Wiley & Sons, Inc.8
How the Shewhart Control Chart WorksChapter 5Statistical Quality Control, 7th Edition by Douglas C. Montgomery.Copyright (c) 2013 John Wiley & Sons, Inc.9
Chapter 5Statistical Quality Control, 7th Edition by Douglas C. Montgomery.Copyright (c) 2013 John Wiley & Sons, Inc.10
Out-Of-Control-Action PlansChapter 5Statistical Quality Control, 7th Edition by Douglas C. Montgomery.Copyright (c) 2013 John Wiley & Sons, Inc.11
More Basic Principles Control charts may be used to estimate processparameters, which are used to determine capability Two general types of control charts– Variables (Chapter 6) Continuous scale of measurement Quality characteristic described by central tendency and a measureof variability– Attributes (Chapter 7) Conforming/nonconforming Counts Control chart design encompasses selection ofsample size, control limits, and sampling frequencyChapter 5Statistical Quality Control, 7th Edition by Douglas C. Montgomery.Copyright (c) 2013 John Wiley & Sons, Inc.12
Types of Process Variability Stationary and uncorrelated data vary around a fixed mean in a stableor predictable manner Stationary and autocorrelated successive observations are dependentwith tendency to move in long runs on either side of mean Nonstationary process drifts without any sense of a stable or fixed meanChapter 5Statistical Quality Control, 7th Edition by Douglas C. Montgomery.Copyright (c) 2013 John Wiley & Sons, Inc.13
Reasons for Popularityof Control Charts1. Control charts are a proven technique for improvingproductivity.2. Control charts are effective in defect prevention.3. Control charts prevent unnecessary processadjustment.4. Control charts provide diagnostic information.5. Control charts provide information about processcapability.Chapter 5Statistical Quality Control, 7th Edition by Douglas C. Montgomery.Copyright (c) 2013 John Wiley & Sons, Inc.14
3-Sigma Control Limits– Probability of type I error is 0.0027 Probability Limits– Type I error probability is chosen directly– For example, 0.001 gives 3.09-sigma control limits Warning Limits– Typically selected as 2-sigma limitsChapter 5Statistical Quality Control, 7th Edition by Douglas C. Montgomery.Copyright (c) 2013 John Wiley & Sons, Inc.15
5.3.3 Sample Size and Sampling FrequencyChapter 5Statistical Quality Control, 7th Edition by Douglas C. Montgomery.Copyright (c) 2013 John Wiley & Sons, Inc.16
Chapter 5Statistical Quality Control, 7th Edition by Douglas C. Montgomery.Copyright (c) 2013 John Wiley & Sons, Inc.17
Chapter 5Statistical Quality Control, 7th Edition by Douglas C. Montgomery.Copyright (c) 2013 John Wiley & Sons, Inc.18
Chapter 5Statistical Quality Control, 7th Edition by Douglas C. Montgomery.Copyright (c) 2013 John Wiley & Sons, Inc.19
Chapter 5Statistical Quality Control, 7th Edition by Douglas C. Montgomery.Copyright (c) 2013 John Wiley & Sons, Inc.20
Chapter 5Statistical Quality Control, 7th Edition by Douglas C. Montgomery.Copyright (c) 2013 John Wiley & Sons, Inc.21
Chapter 5Statistical Quality Control, 7th Edition by Douglas C. Montgomery.Copyright (c) 2013 John Wiley & Sons, Inc.22
5.3.4 Rational Subgroups The rational subgroup concept means that subgroups or samplesshould be selected so that if assignable causes are present, chance fordifferences between subgroups will be maximized, while chance fordifference due to assignable causes within a subgroup will beminimized. Two general approaches for constructing rational subgroups:1.Sample consists of units produced at the same time consecutive units–2.Sample consists of units that are representative of all units producedsince last sample random sample of all process output oversampling interval–––Chapter 5Primary purpose is to detect process shiftsOften used to make decisions about acceptance of productEffective at detecting shifts to out-of-control state and back into in-controlstate between samplesCare must be taken because we can often make any process appear to bein statistical control just by stretching out the interval betweenobservations in the sample.Statistical Quality Control, 7th Edition by Douglas C. Montgomery.Copyright (c) 2013 John Wiley & Sons, Inc.23
Rational SubgroupsChapter 5Statistical Quality Control, 7th Edition by Douglas C. Montgomery.Copyright (c) 2013 John Wiley & Sons, Inc.24
5.3.5 Patterns on Control Charts Pattern is very nonrandom in appearance 19 of 25 points plot below the center line, while only 6 plotabove Following 4th point, 5 points in a row increase inmagnitude, a run up There is also an unusually long run down beginning with18th pointChapter 5Statistical Quality Control, 7th Edition by Douglas C. Montgomery.Copyright (c) 2013 John Wiley & Sons, Inc.25
The Cyclic PatternChapter 5Statistical Quality Control, 7th Edition by Douglas C. Montgomery.Copyright (c) 2013 John Wiley & Sons, Inc.26
Chapter 5Statistical Quality Control, 7th Edition by Douglas C. Montgomery.Copyright (c) 2013 John Wiley & Sons, Inc.27
5.3.6 Discussion of the Sensitizing RulesChapter 5Statistical Quality Control, 7th Edition by Douglas C. Montgomery.Copyright (c) 2013 John Wiley & Sons, Inc.28
See Champ and Woodall (1987)Chapter 5Statistical Quality Control, 7th Edition by Douglas C. Montgomery.Copyright (c) 2013 John Wiley & Sons, Inc.29
Chapter 5Statistical Quality Control, 7th Edition by Douglas C. Montgomery.Copyright (c) 2013 John Wiley & Sons, Inc.30
4.3.7 Phase I and Phase II of Control Chart Application Phase I is a retrospective analysis of processdata to construct trial control limits– Charts are effective at detecting large, sustainedshifts in process parameters, outliers, measurementerrors, data entry errors, etc.– Facilitates identification and removal of assignablecauses In phase II, the control chart is used to monitorthe process– Process is assumed to be reasonably stable– Emphasis is on process monitoring, not on bringingan unruly process into controlChapter 5Statistical Quality Control, 7th Edition by Douglas C. Montgomery.Copyright (c) 2013 John Wiley & Sons, Inc.31
5.4 THE REST OF THE “MAGNIFICENT SEVEN”1.2.3.4.5.6.7.Chapter 5Histogram or stem-and-leaf plotCheck sheetPareto chartCause-and-effect diagramDefect concentration diagramScatter diagramControl chartStatistical Quality Control, 7th Edition by Douglas C. Montgomery.Copyright (c) 2013 John Wiley & Sons, Inc.32
Check SheetChapter 5Statistical Quality Control, 7th Edition by Douglas C. Montgomery.Copyright (c) 2013 John Wiley & Sons, Inc.33
Pareto ChartChapter 5Statistical Quality Control, 7th Edition by Douglas C. Montgomery.Copyright (c) 2013 John Wiley & Sons, Inc.34
Chapter 5Statistical Quality Control, 7th Edition by Douglas C. Montgomery.Copyright (c) 2013 John Wiley & Sons, Inc.35
Cause-and-Effect DiagramChapter 5Statistical Quality Control, 7th Edition by Douglas C. Montgomery.Copyright (c) 2013 John Wiley & Sons, Inc.36
Chapter 5Statistical Quality Control, 7th Edition by Douglas C. Montgomery.Copyright (c) 2013 John Wiley & Sons, Inc.37
Defect Concentration DiagramChapter 5Statistical Quality Control, 7th Edition by Douglas C. Montgomery.Copyright (c) 2013 John Wiley & Sons, Inc.38
Scatter DiagramChapter 5Statistical Quality Control, 7th Edition by Douglas C. Montgomery.Copyright (c) 2013 John Wiley & Sons, Inc.39
5.5 Implementing SPC in a Quality Improvement ProgramChapter 5Statistical Quality Control, 7th Edition by Douglas C. Montgomery.Copyright (c) 2013 John Wiley & Sons, Inc.40
5.6 An Application of SPC Improving quality in a copper plating operation at aprinted circuit board fabrication plant The DMAIC process was used During the define step, the team decided to focus onreducing flow time through the process During the measures step, controller downtown wasrecognized as a major factor in excessive flow timeChapter 5Statistical Quality Control, 7th Edition by Douglas C. Montgomery.Copyright (c) 2013 John Wiley & Sons, Inc.41
Chapter 5Statistical Quality Control, 7th Edition by Douglas C. Montgomery.Copyright (c) 2013 John Wiley & Sons, Inc.42
Chapter 5Statistical Quality Control, 7th Edition by Douglas C. Montgomery.Copyright (c) 2013 John Wiley & Sons, Inc.43
Chapter 5Statistical Quality Control, 7th Edition by Douglas C. Montgomery.Copyright (c) 2013 John Wiley & Sons, Inc.44
Chapter 5Statistical Quality Control, 7th Edition by Douglas C. Montgomery.Copyright (c) 2013 John Wiley & Sons, Inc.45
Chapter 5Statistical Quality Control, 7th Edition by Douglas C. Montgomery.Copyright (c) 2013 John Wiley & Sons, Inc.46
Chapter 5Statistical Quality Control, 7th Edition by Douglas C. Montgomery.Copyright (c) 2013 John Wiley & Sons, Inc.47
Chapter 5Statistical Quality Control, 7th Edition by Douglas C. Montgomery.Copyright (c) 2013 John Wiley & Sons, Inc.48
5.7 Applications of SPC and Quality ImprovementTools in Transactional and Service Businesses Nonmanufacturing applications often do not differsubstantially from industrial applications, butsometimes require ingenuity1.2.3.Flow charts, operation process charts and valuestream mapping are particularly useful in developingprocess definition and process understanding. This issometimes called process mapping. –Chapter 5Most nonmanufacturing operations do not have a naturalmeasurement systemThe observability of the process may be fairly lowPeople are usually involved in transactional and servicesprocesses, and variability between people may be animportant part of the problemUsed to identify value-added versus nonvalue-addedactivityStatistical Quality Control, 7th Edition by Douglas C. Montgomery.Copyright (c) 2013 John Wiley & Sons, Inc.49
Chapter 5Statistical Quality Control, 7th Edition by Douglas C. Montgomery.Copyright (c) 2013 John Wiley & Sons, Inc.50
Chapter 5Statistical Quality Control, 7th Edition by Douglas C. Montgomery.Copyright (c) 2013 John Wiley & Sons, Inc.51
Chapter 5Statistical Quality Control, 7th Edition by Douglas C. Montgomery.Copyright (c) 2013 John Wiley & Sons, Inc.52
Value Stream MappingChapter 5Statistical Quality Control, 7th Edition by Douglas C. Montgomery.Copyright (c) 2013 John Wiley & Sons, Inc.53
Chapter 5Statistical Quality Control, 7th Edition by Douglas C. Montgomery.Copyright (c) 2013 John Wiley & Sons, Inc.54
Chapter 5Statistical Quality Control, 7th Edition by Douglas C. Montgomery.Copyright (c) 2013 John Wiley & Sons, Inc.55
Chapter 5Statistical Quality Control, 7th Edition by Douglas C. Montgomery.Copyright (c) 2013 John Wiley & Sons, Inc.56
Transactional and Service Businesses All of the quality improvement tools can be used,including designed experiments Sometimes a simulation model if the process is useful More likely to encounter attribute data Lots of the continuous data may not be normallydistributed (such as cycle time) Non-normality isn’t a big problem, because manytechniques are relatively insensitive to the normalityassumption Transformations and nonparametric methods could beused if the problem is severe enoughChapter 5Statistical Quality Control, 7th Edition by Douglas C. Montgomery.Copyright (c) 2013 John Wiley & Sons, Inc.57
Consider a regression model on y cycle time to process a claim in aninsurance company:Chapter 5Statistical Quality Control, 7th Edition by Douglas C. Montgomery.Copyright (c) 2013 John Wiley & Sons, Inc.58
Chapter 5Statistical Quality Control, 7th Edition by Douglas C. Montgomery.Copyright (c) 2013 John Wiley & Sons, Inc.59
– Care must be taken because we can often make any process appear to be in statistical control just by stretching out the interval between observations in the sample. Rational Subgroups Chapter 5 Statistical