Transcription
chapter-20.qxd3/25/039:24 PMPage iiChapter 20Statistical QualityControlGOALSWhen you have completed this chapter, you will be able to: Discuss the role of quality control in production and serviceoperations Define and understand the terms chance cause, assignable cause,in control, out of control, attribute, and variable Construct and interpret a Pareto chart Construct and interpret a fishbone diagram Construct and interpret a mean and range chart Construct and interpret a percent defective and a c-bar chart Discuss acceptance sampling Construct an operating characteristic curve for various samplingplans.
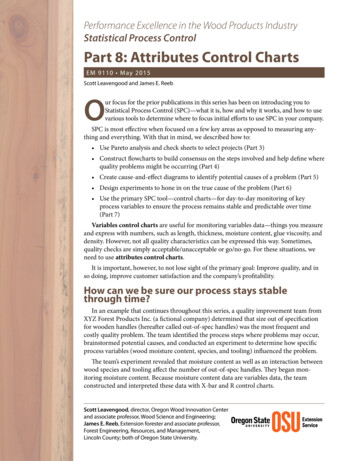
chapter-20.qxd3/25/039:24 PMPage 1Walter A. Shewhart (1891–1967)ith the advent of industrial revolution in the 19thcentury, mass production replaced manufacturing insmall shops by skilled craftsman and artisans. Whilein the small shops the individual worker was completelyresponsible for the quality of the work, this was no longertrue in mass production where each individual’s contributionto the finished product constituted only an insignificant partin the total process. The quality control by the large companies was achieved with the help of quality inspectors responsible for checking a 100 percent inspection of all theimportant characteristics.Dr. Walter A. Shewhart, called the father of quality controlanalysis, developed the concepts of statistical quality control.For the purpose of controlling quality, Shewhart developed charting techniques and statistical procedures for controlling in-process manufacturing operations. His statisticalprocedures are based on the concept of independent and identically distributed randomvariables. Based on these concepts, he distinguished between chance causes, producingrandom variation intrinsic to the process, and assignable causes, one should look for andtake requiring corrective actions. In order to identify the assignable causes, he recommended 3 (standard deviation) limits above and below the mean value of the variable.Observations beyond these limits were then used to identify the assignable causes.Shewharts’ other contributions to statistics include his emphasis on providing fullevidence in reporting research results and applications of measurement processes inscience, particularly physics.Shewhart served as consultant to several organizations including the War Department,the United Nations, and the Indian government. He also taught at the universities ofIllinois and California, and was involved with various other universities such as Harvard,Rutgers, and Princeton.W. Edwards Deming, one of Shewharts’s students—now more popular than his mentorin the arena of quality control, carried on Shewhart’s work on statistical quality control tonew heights. Deming’s contributions include not only a further development of procedures,but also a new philosophy, popularly known as Deming’s 14 points in modern statisticalquality control literature.W149815481598164816981748189819482000
chapter-20.qxd3/25/039:24 PMPage 2Statistical Quality Control3IntroductionThroughout this text we have presented many applications of hypothesis testing.In Chapter 10 we described methods for testing a hypothesis regarding a single population value. In Chapter 11 we described methods for testing a hypothesis about twopopulations. In this chapter we present another, somewhat different application ofhypothesis testing, called statistical process control or SPC.Statistical process control is a collection of strategies, techniques, and actions takenby an organization to ensure they are producing a quality product or providing a quality service. It begins at the product planning stage, when we specify the attributes ofthe product or service. It continues through the production stage. Each attributethroughout the process contributes to the overall quality of the product. To effectivelyuse quality control, measurable attributes and specifications must be developed againstwhich the actual attributes of the product or service can be compared.20.1Statistical Quality Control andEdwards Deming’s 14 Points ProgramStatistical quality control really came into its own during World War II. The need formass-produced war-related items, such as bomb sights, accurate radar, and otherelectronic equipment, at the lowest possible cost hastened the use of statisticalsampling and quality control charts. Since World War II these statistical techniqueshave been refined and sharpened. The use of computers in the last decade has alsowidened the use of these techniques.World War II virtually destroyed the Japanese production capability. Rather than retooltheir old production methods, the Japanese enlisted the aid of the late Dr. W. EdwardsDeming, of the United States Department of Agriculture, to help them develop an overall plan. In a series of seminars with Japanese planners he stressed a philosophy thatis known today as Deming’s 14 points. These 14 points are listed on the following page.He emphasized that quality originates from improving the process, not from inspection, and that quality is determined by the customers. The manufacturer must be able,via market research, to anticipate the needs of customers. Upper management hasthe responsibility for long-term improvement. Another of his points, and one that theJapanese strongly endorsed, is that every member of the company must contribute tothe long-term improvement. To achieve this improvement, ongoing education andtraining are necessary.Deming had some ideas that did not mesh with contemporary management philosophies in the West. Two areas where Deming’s ideas differed from Western management philosophy were with production quotas and merit ratings. He claimed these twopractices, which are both common in the West, are not productive and should beeliminated. He also pointed out that Western managers are mostly interested in goodnews. Good news, however, does not provide an opportunity for improvement. On theother hand, bad news opens the door for new products and allows for companyimprovement.Listed below, in a condensed form, are Dr. Deming’s 14 points. He was adamant thatthe 14 points needed to be adopted as a package in order to be successful. The underlying theme is cooperation, teamwork, and the belief that workers want to do their jobsin a quality fashion.
chapter-20.qxd43/25/039:24 PMPage 3Chapter Twenty1. Create constancy of purpose for the continual improvement of products andservice to society.2. Adopt a philosophy that we can no longer live with commonly accepted levelsof delays, mistakes, defective materials, and defective workmanship.3. Eliminate the need for mass inspection as the way to achieve quality. Insteadachieve quality by building the product correctly in the first place.4. End the practice of awarding business solely on the basis of price. Instead,require meaningful measures of quality along with the price.5. Improve constantly and forever every process for planning, production, andservice.6. Institute modern methods of training on the job for all employees, includingmanagers. This will lead to better utilization of each employee.7. Adopt and institute leadership aimed at helping people do a better job.8. Encourage effective two-way communication and other means to drive outfear throughout the organization so that everyone may work more effectivelyand more productively for the company.9. Break down barriers between departments and staff areas.10. Eliminate the use of slogans, posters, and exhortations demanding zero defectsand new levels of productivity without providing methods.11. Eliminate work standards that prescribe quotas for the workforce and numerical goals for people in management. Substitute aids and helpful leadership inorder to achieve continual improvement in quality and productivity.12. Remove the barriers that rob hourly workers and the people in managementof their right to pride of workmanship.13. Institute a vigorous program of education and encourage self-improvement foreveryone. What an organization needs is good people and people who areimproving with education. Advancement to a competitive position will have itsroots in knowledge.14. Define clearly management’s permanent commitment to ever-improvingquality and productivity to implement all of these principles.Deming’s 14 points did not ignore statistical quality control, which is often abbreviated as SQC, TQC, or just QC. The objective of statistical quality control is to monitor production through many stages of manufacturing. We use the tools of statisticalquality control, such as X-bar and R charts, to monitor the quality of many processesand services. Control charts allow us to identify when a process or service is “out ofcontrol,” that is, when the point is reached where an excessive number of defectiveunits are being produced.Interest in quality has accelerated dramatically since the late 1980s. Turn on thetelevision and watch the commercials sponsored by Ford, Nissan, and GM to verifythe emphasis on quality control on the assembly line. It is now one of the “in” topicsin all facets of business. V. Daniel Hunt, president of Technology Research Corporation,wrote in his book Quality in America that in the United States, 20 to 25 percent ofthe cost of production is currently spent finding and correcting mistakes. And, headded, the additional cost incurred in repairing or replacing faulty products in the fielddrives the total cost of poor quality to nearly 30 percent. In Japan, he indicates, this costis about 3 percent!In recent years companies have been motivated to improve quality by the challenge of being recognized for their quality achievements. The Malcolm BaldrigeNational Quality Award, established in 1988, is awarded annually to U.S. companies
chapter-20.qxd3/25/039:24 PMPage 4Statistical Quality Control5that demonstrate excellence in quality achievement and management. The awardcategories include manufacturing, service, and small business. Past winners includeMotorola, Xerox, IBM, Federal Express, and Cadillac. The 2002 award winnerswere Motorola Inc., Commercial, Government and Industrial Solutions Sector fromSchaumberg, Illinois (manufacturing category); Branch-Smith Printing Division, FortWorth, Texas (small business category); and SSM Health Care, St. Louis, Missouri(health care category). You can obtain more information on the 2002 winners andother winners by visiting the Web site: www.quality.nist.gov.Canada’s National Quality Institute (NQI) similarly awards organizations thatdemonstrate sustainable measures of continuous improvement. For the past 19 years,Canada Awards for Excellence have been awarded for Quality. (An new category,“Healthy Workplace” has been awarded since 1999.) The 2002 recipients of theCanada Awards for Excellence—Quality Award Trophy were Dana Canada Inc., SpicerDriveshaft Group, Magog, Quebec; Canada Post, Saskatoon Operations; HomewoodHealth Centre, Guelph Ontario; and Mullen Trucking, Aldersyde, Alberta. To find outmore about these and other winners, visit the Web site www.nqi.ca.What is quality? There is no commonly agreed upon definition of quality. To cite afew diverse definitions: From Westinghouse, “Total quality is performance leadershipin meeting the customer requirements by doing the right things right the first time.”From AT&T, “Quality is meeting customer expectations.” Historian BarbaraW. Tuchman says, “Quality is achieving or reaching the highest standard as againstbeing satisfied with the sloppy or fraudulent.”20.2Causes of VariationNo two parts are exactly the same. There is always some variation. The weight of eachMcDonald’s Quarter Pounder is not exactly 0.25 pounds. Some will weigh more than0.25 pounds, others less. The standard time for the bus run from downtown Toronto toairport is 45 minutes. Each run does not take exactly 45 minutes. Some runs takelonger. In some cases there is a reason for the bus being late, an accident on the highway or a snowstorm, for example. In other cases the driver may not “hit” the greenlights or the traffic is unusually heavy and slow for no apparent reason. There are twogeneral causes of variation in a process—chance and assignable.iCHANCE VARIATION Variation that is random in nature. This type of variationcannot be completely eliminated unless there is a major change in the equipment or material used in the process.Internal machine friction, slight variations in material or process conditions(such as the temperature of the mold being used to make glass bottles), atmosphericconditions (such as temperature, humidity, and the dust content of the air), andvibrations transmitted to a machine from a passing forklift are a few examples ofsources of chance variation.If the hole drilled in a piece of steel is too large due to a dull drill, the drill may besharpened or a new drill inserted. An operator who continually sets up the machineincorrectly can be replaced or retained. If the roll of steel to be used in the process doesnot have the correct tensile strength, it can be rejected. These are examples of assignable variation.
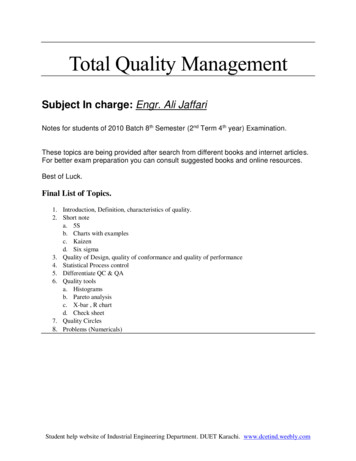
chapter-20.qxd63/25/039:24 PMPage 5Chapter TwentyiAssignable Variation Variation that is not random. It can be eliminated orreduced by investigating the problem and finding the cause.There are several reasons we should be concerned with variation.1. It will change the shape, dispersion, and central tendency of the distribution of theproduct characteristic being measured.2. Assignable variation is usually correctable, whereas chance variation usually cannotbe corrected or stabilized economically.20.3Diagnostic ChartsThere are a variety of diagnostic techniques available to investigate quality problems.Two of the more prominent of these techniques are Pareto charts and fishbonediagrams.PARETO CHARTSPareto analysis is a technique for tallying the number and type of defects that happenwithin a product or service. The chart is named after a 19th-century Italian scientist,Vilfredo Pareto. He noted that most of the “activity” in a process is causedby relatively few of the “factors.” His concept, often called the 80–20 rule, is that80 percent of the activity is caused by 20 percent of the factors. By concentrating on20 percent of the factors, managers can attack 80 percent of the problem. For example, Emily’s Family Restaurant is investigating “customer complaints.” The five complaints heard most frequently are: discourteous service, cold food, long wait for seating,few menu choices, and unruly young children. Suppose discourteous service wasmentioned most frequently and cold food second. These two factors total more than85 percent of the complaints and hence are the two that should be addressed firstbecause this will yield the largest reduction in complaints.To develop a Pareto chart, we begin by tallying the type of defects. Next, we rankthe defects in terms of frequency of occurrence from largest to smallest. Finally, weproduce a vertical bar chart, with the height of the bars corresponding to the frequencyof each defect. The following example illustrates these ideas.Example 20-1The Mayor of Moncton, NB, is concerned with water usage, particularly in single familyhomes. He would like to develop a plan to reduce the water usage in Moncton.To investigate, he selects a sample of 100 homes and determines the typical daily waterusage for various purposes. These sample results are as follows.Reasons forWater UsageLaunderingWatering lawnPersonal bathingCookingLitres per Day24.9143.7106.75.1Reasons forWater UsageSwimming poolDishwashingCar washingDrinkingLitres per Day28.312.310.47.9What is the area of greatest usage? Where should he concentrate his efforts to reducethe water usage?
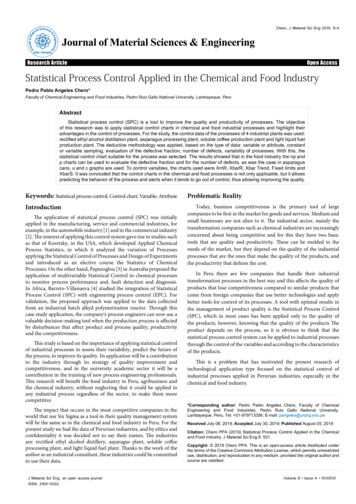
chapter-20.qxd3/25/039:24 PMPage 6Statistical Quality Control7MINITAB CHART 20-1: Pareto Chart for Water Usage in Moncton, NB1234MINITAB INSTRUCTIONS1. Enter the reasons for water usage in C1 and the litresused in C2.2. Click Stat, Quality Tools, Pareto Chart, and Enter.3. In the dialogue box, select Chart defects table, indicatethe location of the labels and frequencies, type a charttitle, and click OK.SolutionA Pareto chart is useful for identifying the major areas of water usage and focusing onthose areas where the greatest reduction can be achieved. The first step is to converteach of the activities to a percent and then to order them from largest to smallest. Thetotal water usage per day is 339.3 litres, found by totaling the litres used in the eightactivities. The activity with the largest use is watering lawns. It accounts for 143.7litres of water per day, or 42.4 percent of the amount of water used. The next largestcategory is personal bathing, which accounts for 31.4 percent of the water used. Thesetwo activities account for 73.8 percent of the water usage.
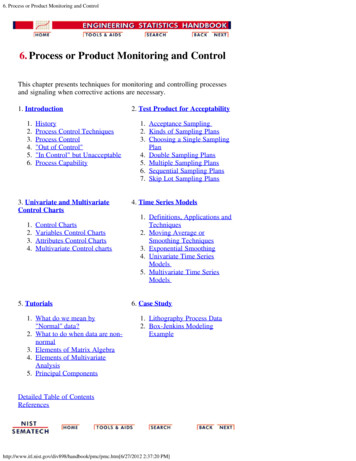
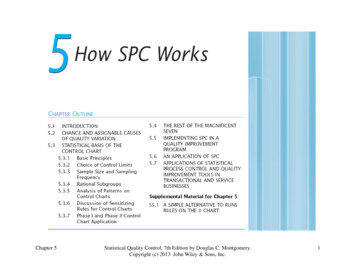
chapter-20.qxd83/25/039:24 PMPage 7Chapter TwentyReasons for Water UsageLaunderingWatering lawnPersonal bathingCookingSwimming pool usageDishwashingCar washingDrinkingTotalLitres per 42.431.41.58.33.63.12.3100.0To draw the Pareto chart, we begin by scaling the number of litres used on the leftvertical axis and the corresponding percent on the right vertical axis. Next we draw avertical bar with the height of the bar corresponding to the activity with the largestnumber of occurrences. In the Moncton example, we draw a vertical bar for the activity watering lawns to a height of 143.7 litres. (We call this the count.) We continue thisprocedure for the other activities, as shown in the Minitab Chart 20-1.Below the chart we list the activities, their frequency of occurrence, and the percent of the time each activity occurs. In the last row we list the cumulative percentage.This cumulative row will allow us to quickly determine which set of activities accountfor most of the activity. These cumulative percents are plotted above the vertical bars.In the Moncton example, the activities of watering lawn, personal bathing, and poolsaccount for 82.1 percent of the water usage. The city manager can attain the greatestgain by looking to reduce the water usage in these three areas.FISHBONE DIAGRAMAnother diagnostic chart is a cause-and-effect diagram or a fishbone diagram. It is calleda cause-and-effect diagram to emphasize the relationship between an effect and a set ofpossible causes that produce the particular effect. This diagram is useful to help organizeideas and to identify relationships. It is a tool that encourages open “brainstorming”for ideas. By identifying these relationships we can determine factors that are the causeof variability in our process. The name fishbone comes from the manner in which thevarious causes and effects are organized on the diagram. The effect is usually a particular problem, or perhaps a goal, and it is shown on the right-hand side of the diagram.The major causes are listed on the left-hand side of the diagram.The usual approach to a fishbone diagram is to consider four problem areas,namely, methods, materials, equipment, and personnel. The problem, or the effect,is the head of the fish. See Chart 20-2.CHART 20-2: Fishbone rsonnel
chapter-20.qxd3/25/039:24 PMPage 8Statistical Quality Control9Under each of the possible causes are subcauses that are identified and investigated. The subcauses are factors that may be producing the particular effect.Information is gathered about the problem and used to fill in the fishbone diagram.Each of the subcauses is investigated and those that are not important eliminated, untilthe real cause of the problem is identified.Chart 20-3 illustrates the details of a fishbone diagram. Suppose a family restaurant,such as those found along a highway, has recently been experiencing complaints fromcustomers that the food being served is cold. Notice each of the subcauses are listed asassumptions. Each of these subcauses must be investigated to find the real problemregarding the cold food. In a fishbone diagram there is no weighting of the subcauses.CHART 20-3: Fishbone Diagram for a Restaurant Investigation ofCold Food ComplaintsMethodsMaterialsFood at correctstarting temperatureFood heated tocorrect temperaturePackaging insulatesenoughFood placed underheating lightsThermostatworking properlyEmployees operatingequipment correctlyHeating lights atcorrect heightEquipmentComplaintsofColdFoodServers deliverfood quicklyPersonnelSource: Adapted from M.A. Vonderembse and G.P. White, Operations Management, 3rd Ed. (South Western CollegePublishing, 1996), p. 489.Self- Review 20-1Patients at the Rouse Home have been complaining recently about the conditions atthe home. The administrator would like to use a Pareto chart to investigate. When apatient or patient’s relative has a complaint, they are asked to complete a complaintform. Listed below is a summary of the complaint forms received during the last12 months.ComplaintNothing to doPoor care by staffMedication errorNumber45712ComplaintDirty conditionsPoor quality foodLack of respect by staffNumber638435Develop a Pareto chart. What complaints would you suggest the administrator work onfirst to achieve the most significant improvement?
chapter-20.qxd103/25/039:24 PMPage 9Chapter TwentyEXERCISES 20-1 TO 20-220-1. Tom Sharkey is the owner of Sharkey Chevy. At the start of the yearTom instituted a customer opinion program to find ways to improve service.One week after the service is performed, Tom’s administrative assistantcalls the customer to find out whether the service was performedsatisfactorily and how the service might be improved. Listed below isa summary of the complaints for the first six months. Develop a Pareto chart.What complaints would you suggest that Tom work on to improve the qualityof service?ComplaintFrequencyProblem not corrected38Error on invoice8Unfriendly atmosphere12ComplaintFrequencyPrice too high23Wait too long for service1020-2. Out of 110 diesel engines tested, a rework and repair facility found 9 had leakywater pumps, 15 had faulty cylinders, 4 had ignition problems, 52 had oilleaks, and 30 had cracked blocks. Draw a Pareto chart to identify the keyproblem in the production process.20.4 Purpose and Types ofQuality Control ChartsControl charts identify when assignable causes of variation or changes have enteredthe process. For example, the Wheeling Company makes vinyl-coated aluminumreplacement windows for older homes. The vinyl coating must have a thicknessbetween certain limits. If the coating becomes too thick, it will cause the windows tojam. On the other hand, if the coating become too thin, the window will not sealproperly. The mechanism that determines how much coating is put on each windowbecomes worn and begins making the coating too thick. Thus, a change has occurredin the process. Control charts are useful for detecting the change in process conditions. It is important to know when changes have entered the process, so that thecause may be identified and corrected before a large number of unacceptable itemsare produced.Control charts may be compared to the scoreboard in a baseball game. By lookingat the scoreboard, the fans, coaches, and players can tell which team is winning thegame. However, the scoreboard can do nothing to win or lose the game. Control chartsprovide a similar function. These charts indicate to the workers, group leaders, qualitycontrol engineers, production supervisor, and management whether the production ofthe part or service is “in control” or “out of control.” If the production is “out of control,” the control chart will not fix the situation; it is just a piece of paper with figuresand dots on it. Instead, the person responsible will adjust the machine manufacturingthe part or do what is necessary to return production to “in control.”There are two types of control charts. A variable control chart portrays measurements, such as the amount of cola in a two-litre bottle or the time it takes anurse at General Hospital to respond to a patient’s call. A variable control chart
chapter-20.qxd3/25/039:24 PMPage 10Statistical Quality Control11requires the interval or the ratio scale of measurement. An attribute control chartclassifies a product or service as either acceptable or unacceptable. It is based onthe nominal scale of measurement. Patients in a hospital are asked to rate the mealsserved as acceptable or unacceptable; bank loans are either repaid or they aredefaulted.CONTROL CHARTS FOR VARIABLESTo develop control charts for variables, we rely on the sampling theory discussed inconnection with the central limit theorem in Chapter 8. Suppose a sample of fivepieces is selected each hour from the production process and the mean of eachsample computed. The sample means are X1 , X2 , X3 , and so on. The mean of these sample means is denoted as X . We use k to indicate the number of sample means.The overall or grand mean is found by:Grand MeanX Σ of the means of the subgroups Σ X Number of sample meansk20-1The standard error of the distribution of the sample means is designated by sx . It isfound by:Standard Error of the MeanSx Sn20-2These relationships allow limits to be set up around the sample means to show howmuch variation can be expected for a given sample size. These expected limits arecalled the upper control limit (UCL) and the lower control limit (LCL). An examplewill illustrate the use of control limits and how the limits are determined.Example 20-2Statistical Software, Inc., offers a toll-free number where customers can call from7 A.M. until 11 P.M. daily with problems involving the use of their products. It isimpossible to have every call answered immediately by a technical representative,but it is important customers do not wait too long for a person to come on the line.Customers become upset when they hear the message “Your call is important to us.The next available representative will be with you shortly” too many times. Tounderstand their process, Statistical Software decides to develop a control chartdescribing the total time from when a call is received until the representativeanswers the caller’s question. Yesterday, for the 16 hours of operation, five calls weresampled each hour. This information is reported on the next page, in minutes untila call was answered.
chapter-20.qxd123/25/039:24 PMPage 11Chapter TwentySample NumberTime12345A.M. 789101187111211910128101571066469914118101211P.M. 812941299841071417174126451110712111311128911Based on this information, develop a control chart for the mean duration of the call.Does there appear to be a trend in the calling times? Is there any period in which itappears that customers wait longer than others?SolutionA mean chart has two limits, an upper control limit (UCL) and a lower control limit(LCL). These upper and lower control limits are computed by:Control Limits for the MeanUCL X 3SnandLCL X 3S20-3nwhere S is an estimate of the standard deviation of the population, . Notice that in thecalculation of the upper and lower control limits the number 3 appears. It representsthe 99.74 percent confidence limits. The limits are often called the 3-sigma limits.However, other levels of confidence (such as 90 or 95 percent) can be used.This application developed before computers were widely available and computingstandard deviations was difficult. Rather than calculate the standard deviation fromeach sample as a measure of variation, it is easier to use the range. For fixed sized samples there is a constant relationship between the range and the standard deviation,so we can use the following formulas to determine the 99.74 percent control limits forthe mean. It can be demonstrated that the term 3( s / n ) from Formula 20-3 is equiv–alent to A2 R in the following formula.Control Limits for the MeanUCL X A2 RLCL X A2 R20-4
chapter-20.qxd3/25/039:24 PMPage 12Statistical Quality Control13where:A2 is a constant used in computing the upper and the lower control limits. It is based–on the average range, R . The factors for various sample sizes can be found in theTable of Factors for Control Charts, Appendix 1 on this CD. (Note: n in this tablerefers to the number in the sample.) A portion of this table is shown below. Tolocate the A2 factor for this problem, find the sample size for n in the left margin.It is 5. Then move horizontally to the A2 column, and read the factor. It is 2.004is the mean of the sample means, computed by Σ X / k , where k is the number ofsamples selected. In this problem a sample of 5 observations is taken each hourfor 16 hours, so k 16.is the mean of the ranges of the sample. It is R/k. Remember the range is thedifference between the largest and the smallest value in each sample. It describesthe variability occurring in that particular sample. (See Table 20-1.)TABLE 20-1 Duration of 16 Samples of Five Help SessionsTime12345A.M. 610.49.410.4114368P.M. 102TotalMeanRangeThe centreline for the chart is X. It is 9.4125 minutes, found by 150.60/16. The–mean of the ranges (R ) is 6.375 minutes, found by 102/16. Thus, the upper controllimit of the X bar chart is:UCL X A2 R 9.4125 0.577(6.375) 13.0909The lower control limit of the X bar chart is:LCL X A2 R 9.4125 0.577(6.375) 5.7341
chapter-20.qxd143/25/039:24 PMPage 13Chapter TwentyX , UCL, and LCL, and the sample means are portrayed in Chart 20-4. The mean, X , is9.4125 minutes, the upper control limit is located at 13.0909 minutes, and the lowercontrol limit is located at 5.7341. There is some variation in the duration of the calls,but all sample means are within
hypothesis testing, called statistical process controlor SPC. Statistical process control is a collection of strategies, techniques, and actions taken by an organization to ensure they are producing a quality product or providing a qual-ity service. It begins at the product planning stage,