Transcription
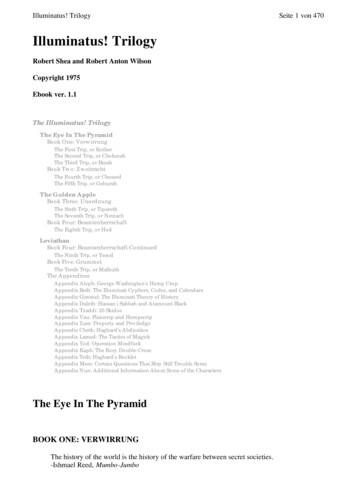
Appendix J: Diversity Engagement Survey ExecutiveSummaryVivian Lewis, Tony Kinslow, and Linda ChaudronIntroductionSince 2009, it has become clear that to achieve greater diversity, the University of Rochester needed toexpand its focus beyond demographics. “We have increasingly appreciated that diversity is not onlyabout numbers, but about culture (Seligman, 2009).” Several initiatives have begun since then topromote a more inclusive climate – including professional development resources for faculty,leadership programs, policies to support gender equity and programs to facilitate a more inclusiveorganizational culture. The collective impact of these efforts has not been measured. Our primarygoals in conducting this survey were:1. To understand how our faculty, staff and students perceive the state of diversity and inclusion,2. To compare the perceptions of specific demographic groups within the university,3. To have baseline data from which we will be able to measure changes in the climate and culture inthe future in response to changes and interventions.The Survey ToolThe Diversity Engagement Survey measures and describes the inclusiveness of an academicenvironment, defines the institutional areas of strengths and areas for improvement, and can helpinform a strategic direction for organizational change. This tool draws upon workforce engagementtheory and theoretical components of organizational inclusion. The 22 standard survey questions aremapped to eight “inclusion” factors (trust, appreciation of individual attributes, sense of belonging,access to opportunity, equitable reward and recognition, cultural competence, respect, and commonpurpose). These eight areas are further grouped into three workforce engagement clusters—vision/purpose, camaraderie, and appreciation. These aspects of organizational culture and diversityhave been identified and confirmed as the key components of workforce inclusion and diversityidentity based on research at over 33 institutions (Person 2015).Workplace engagement theory posits that engagement results from “cultural conditions that foster ashared sense of vision and purpose of the organization, camaraderie and appreciation of employees’contributions to the institution (Person 2015).” A shared sense of vision and purpose helps providemotivation to put forth one’s best efforts. Camaraderie is important for teamwork and sense ofbelonging. Appreciation helps individuals to experience a sense of meaning at work. These conditionsfacilitate an inclusive and diverse workforce in industry and academia (Colan, 2008, Cox, 2001,Davidson, 2001). A more complete description of the conceptual framework and definitions for theclusters and inclusion factors can be found in Appendix A. Our survey also included 4-8 customizedquestions.57Presidential Commission on Race and Diversity: Final Report Appendices
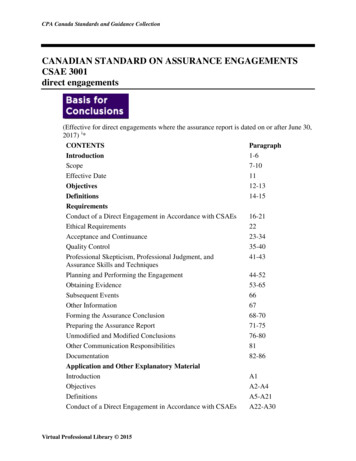
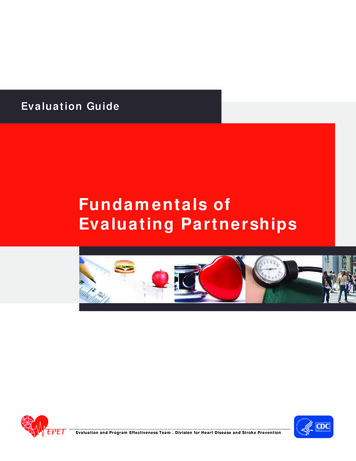
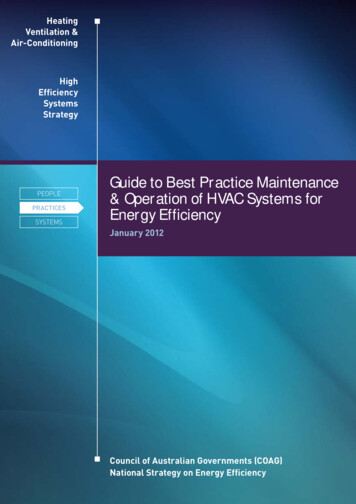
Responses to all questions were captured using a 5-point Likert scale which ranged from “stronglydisagree” to “strongly agree.” The survey also allowed respondents to write in comments in responseto the prompt: “If you wish, please provide additional comments on the University of Rochester’sdiversity and inclusion efforts.” This yielded 1,882 comments.Survey Administration and PopulationThe survey was administered through DataStar, and offered to all faculty and staff of the University ofRochester and students in our School of Medicine and Dentistry, School of Nursing, Simon School ofBusiness, and Warner School of Education in February 2016. The confidential survey was completedonline after e-mail invitations were extended. Only aggregate data are only reported to ensureanonymity.AnalysisTo describe perceptions about diversity at UR, we focused on the percentage of positive responses (e.g.strongly agree or agree). We created mean summary scores for the eight inclusion factors (e.g. groupsof questions that relate to an inclusion theme) using the mean scores for the questions that relate toeach inclusion theme. To compare the perceptions of specific demographic groups within theuniversity, we compared mean summary scores using analysis of variance (ANOVA). In this summary,we identify the strengths and areas of challenge university-wide that are especially salient andassociations between demographic characteristics or positions. Future reports will focus on specificunits or groups not mentioned here (e.g. trainees) as well as the qualitative data and custom questions.ResultsSurvey ParticipantsTwelve thousand and eighty (12,080) University of Rochester faculty, staff, trainees and students (seepopulation, excludes ASE, ESM) completed the survey, representing an overall response rate of 48%.There were 11,489 respondents from individualized E-mail links and 591 respondents (those withoute-mail addresses) who accessed the survey through a netID portal. The gender and racial breakdownof the respondents is similar to our full population (table 1).Areas of Strength Common Purpose – Individual contribution to institutional mission and connection to vision,purpose, mission. Eighty-three percent agree overall (figure1), including 90% agreement on thequestion of feeling that one’s work/studies contribute to institutional mission (table 2). Respect – Individuals experience “a culture of civility and positive regard for diverse perspectivesand ways of knowing.” An average of 83% agreed with the three components of this domain(figure1). Appreciation of Individual Attributes – Individuals perceive that they are valued and can“successfully navigate the organizational structure in their expressed group identity.” Seventyseven percent (77%) of participants agreed with these three questions (figure 1).58Presidential Commission on Race and Diversity: Final Report Appendices
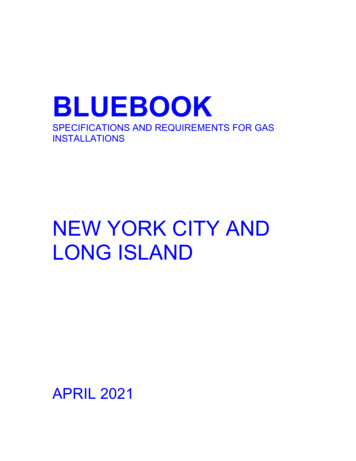
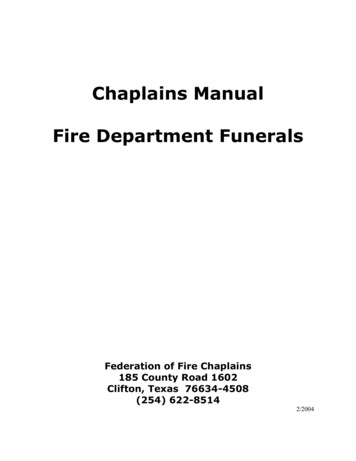
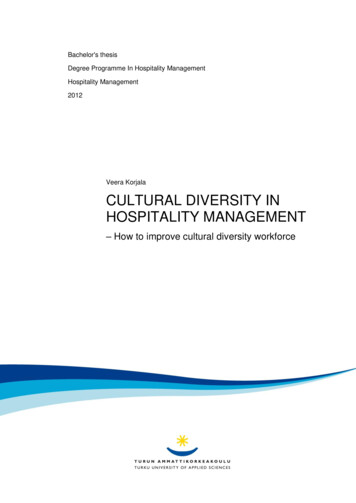
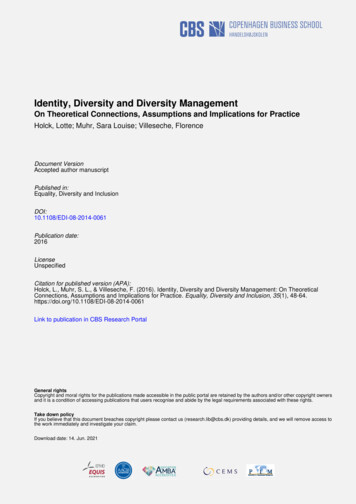
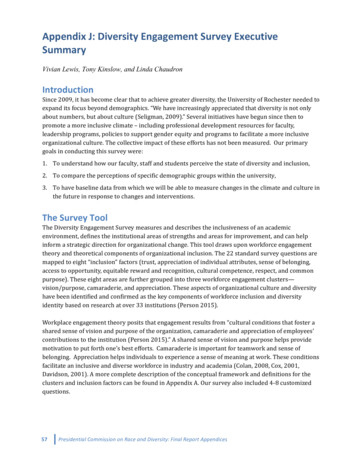
Access to Opportunity – Seventy-seven percent, overall (including 90% of students- seepopulation) agreed with the questions describing the ability “to find and utilize support for theirprofessional development and advancement (figure 1).Areas of Challenge Cultural Competence – “Individuals believe that the institution has the capacity to make creativeuse of its diverse workforce in a way that meets goals and enhances performance” These 4questions had the second lowest mean score overall (figure 1) and this was an area of significantvariance based on race (figure 2). The following 2 questions deserve comment. Effective management of diversity was the question with the largest area of variancebetween Blacks and Whites (71% of Whites and 53% of Blacks agree; P 0.01; table 3).Notably only 37% of Black faculty and Black students (see population) believe theinstitution manages diversity effectively. For both students (see population- excludes ASE,ESM) and faculty overall, the question of effective management of diversity was amonglowest scoring items (61% students agree and 58% of faculty) Among staff, 68% of all agreed that they received support for working with diverse groupsand in cross-cultural situations (table 2), however the difference between Black and Whitestaff was 19% (P .001) though a majority (55%) of Black staff agreed that diversity ismanaged effectively.Respect – Although this was overall a strong area university-wide, some demographic groupswere significantly less likely to agree that “individuals experience a culture of civility and positiveregard for diverse perspectives and ways of knowing” (figure 2). The mean difference inagreement was 14% lower for Blacks compared to Whites (85% mean agreement for Whites and71% for Blacks) LGBT individuals were also less likely to agree than heterosexual or cisgenderindividuals (84% agreement for heterosexual/cisgender and 75% for LGBT individuals) See figure3. Trust – “Individuals have confidence that the policies, practices, and procedures of theorganization will allow them to bring their best and full self to work.” Overall, mean levelagreement with the 3 questions in this factor was at 77% however based on position (e.g. faculty,staff, student) and demographics, the following differences for specific questions should be noted. 59 Among faculty and students- women were significantly less likely than men to believe that:harassment is not tolerated (76% of female faculty compared to 83% of male faculty and78% of female students compared to 85% of male students), that “the institution would dowhat is right” with respect to concerns raised about discrimination and that the institutionis fair to all students and employees (P .001- all 3 comparisons). See figure 4 for genderdifferences by theme. Fewer than half of Black students and faculty agreed that the institution would do what isright about discrimination concerns (48% Black faculty and 42% Black students comparedto73% White faculty and 69% of White students).Equitable Reward and Recognition – “Individuals perceive the organization as having equitablePresidential Commission on Race and Diversity: Final Report Appendices
compensation practices and non-financial incentives.” Our university wide agreement with thesetwo questions averaged 64%, our lowest scoring factor (figure 1). Survey results at otherinstitutions have found a similar pattern (Plummer 2012, Person 2016). In a report of over 13,000respondents at 14 academic medical centers surveyed in 2012, Person et al found a mean score of7.04 for the sum of these two questions compared to University of Rochester mean score of 7.22.The only other university-wide data available on this survey come from Washington University-StLouis in 2015 where this was the domain (for both Medical Center and Danforth campus), showedan average of 47% agreement (Wrighton 2015)). The differences we found based ondemographics (figure 2-4) and position (e.g. faculty, staff, student) in perceptions about theclimate, were also consistent with other published reports about climate and demographics (Orom2013, Person et al 2016; UM ADVANCE 2013).Other Areas of Challenge Race and LGBT status – Similar to the published report of other institutions (Person et al 2016)who have taken this survey, there was statistically significant lower agreement for Blackscompared to Whites on all questions as well as those individuals who identified their race as“Other” compared to Whites (table 3).We found very similar patterns comparing LGBT individualsto the heterosexual and cisgender population. The themes of cultural competence, trust, respectand equitable reward and recognition were the most salient.ConclusionOverall, the University of Rochester’s faculty, staff, trainees and students perceive a high level ofcommon purpose and there is a widespread belief that our university culture reflects an appreciationfor individual attributes and respect. Nonetheless, there are also important areas that needimprovement. Notably, cultural competence, trust and respect reflect areas with large disparities inperceptions based on position, gender, LGBT status or race. Confidence that institutional policies,practices, and procedures will allow everyone to bring their best and full selves to work can impactindividual engagement, motivation and productivity (Colan, 2008, Cox, 2001, Davidson, 2001). Theseare potential opportunities for enhancing all university initiatives by engaging and including our entireuniversity community.In the coming months, we will continue to analyze the survey data based on school, unit and otherattributes and provide qualitative analysis of over 1800 written comments. Greater and more purposedriven communication can help us use our institutional strengths to move the institutional cultureforward.ReferencesColan, L. (2008). Engaging the Hearts and Minds of. New York, NY: McGraw-Hill.Cox, T. (2001). Creating the Multicultural Organization: A Strategy for Capturing the Power of Diversity.San Francisco: Jossey-Bass.Davidson MN, F. B. (2001). Diversity and inclusion: What difference does it make? Industrial andOrganizational Psychology, 39(2):36–38.60Presidential Commission on Race and Diversity: Final Report Appendices
Orom H, Semalulu T, Underwood W: The Social and Learning Environments Experienced byUnderrepresented Minority Medical Students: A Narrative Review. Academic Medicine, 2013; 88:1765-1777Person SD, Jordan CG, Allison JJ, Fink Ogawa LM, Castillo-Page L, Conrad S, Nivet MA, Plummer DL:Measuring Diversity and Inclusion in Academic Medicine: The Diversity Engagement Survey. AcademicMedicine. 2015;90; 1675-1683.Plummer D, Person SD, Fink Ogawa LM, Jordan CG, Allison JJ, Castillo-Page L, Schoolcraft S: DiversityEngagement Survey, User Guide. University of Massachusetts. 2012Seligman, J. (2009). Diversity at the University. Retrieved July 15, 2016, from University of /2009/faculty diversity.htmUM ADVANCE Program. Assessing the academic work environment for science and engineering andtenured/tenure track faculty at the University of Michigan 2001, 2006 and 2012: gender and race indepartment and university related climate factors: ed August 9, 2016Wrighton M (2015). Message for the Chancellor. Washington University USTL Diversity Survey Appendix B 2015.pdf . AccessedAugust 29, 2016.List of TablesTable J1: University of Rochester Respondent CharacteristicsTable J2: University of Rochester Internal Comparisons by PositionTable J3: Differences among demographic groups, ANOVA resultsList of FiguresFigure J1: Average Percent Agree by Inclusion Factor and PositionFigure J2: Average Percent Agree by Inclusion Factor and GenderFigure J3: Average Percent Agree by Inclusion Factor and Race EthnicityFigure J4: Average Percent Agree by Inclusion Factor and LGBT Status61Presidential Commission on Race and Diversity: Final Report Appendices
Table J1: Respondent CharacteristicsParticipation by Division and PositionCentral Administration &Memorial Art GalleryArts & SciencesHajim School of EngineeringEastman SchoolSimon SchoolWarner SchoolSchool of Medicine and DentistrySchool of NursingEastman Institute of Oral HealthStrong Memorial HospitalHealth SciencesMedical Faculty Practice GroupGrand TotalPost-docs derMenWomenTransgender andGender yUniversitywideWhiteAsianBlack orAfricanAmericanHispanic/Latino(a)Other and2 7064238712,08073.8%5.8%8.8%3.1%5.3%3.2%LGBT StatusUniversity-wideHetero/cis1LGBT2Skipped on or %1 Hetero/cis heterosexual and cisgender (a person who is heterosexual and whose gender identity matches their sex assigned at birth)2 LGBT includes respondents who self-selected Lesbian, Gay, Bisexual, Transgender, Gender-Non-conforming or Other LGBT status.62Presidential Commission on Race and Diversity: Final Report Appendices
Table J2: Percent Agree/Strongly Agree by University PositionFactorsCommonPurposeAccess toOpportunityItemno.85%17I feel connected to the vision, missionand values of this institution.75%71%76%73%5This last year, I have had opportunitiesat work/school to developprofessionally.76%83%73%92%9There is someone at work/school whoencourages my %84%72%70%72%75%83%82%83%88%75%71%76%76%19In this institution, I have opportunitiesto work successfully in settings withdiverse colleagues.I believe my institution managesdiversity effectively.In my institution, I receive support forworking with diverse groups andworking in cross-cultural situations.In this institution, there areopportunities for me to engage inservice and community outreach.I receive recognition and praise for mygood work similar to others who dogood work at this institution.In my institution, I am confident thatmy accomplishments are compensatedsimilar to others who have achievedtheir goals.I trust my institution to be fair to allemployees and students.If I raised a concern aboutdiscrimination, I am confident myinstitution would do what is right.I believe that in my institutionharassment is not tolerated.6At work/school, my opinions matter.1115101614212183Appreciationof IndividualAttributesStudents(n 776 )90%21RespectStaff(n 9,257 )95%13Sense ofBelongingFaculty(n 1,599 )90%1Trust1I feel that my work or studiescontribute to the mission of theinstitution.20EquitableReward andRecognitionUniversity-wide(n 12,080)47CulturalCompetenceItem822I consider at least one of mycoworkers or fellow students to be atrusted friend.I feel that I am an integral part of mydepartment or school.The leadership of my institution iscommitted to treating peoplerespectfully.In my institution, I experience respectamong individuals and groups withvarious cultural differences.I believe that my institution reflects aculture of civility.I am valued as an individual by myinstitution.Someone at work/school seems tocare about me as an individual.The culture of my institution isaccepting of people with differentideas.Note: Respondents who chose 'Not able to evaluate' were recoded as nonresponse.163Trainees (including post-docs, residents, and fellows) are included in this University-wide response.Presidential Commission on Race and Diversity: Final Report Appendices
Table J3: Comparison of Inclusion Factor mean scores by demographic groups and positionCommon PurposeGenderA. FemaleB. MaleRace/EthnicityA. AsianB. BlackC. Hispanic/LatinoD. Other / 2 Races or EthnicitiesE. WhiteLGBT StatusA. LGBTB. Heterosexual/CisgenderPositionA. StaffB. StudentC. TraineeD. FacultyaCharacteristicMean (SD)aSignificant GroupbDifferencesGenderA. FemaleB. MaleRace/EthnicityA. AsianB. BlackC. Hispanic/LatinoD. Other / 2 Races or EthnicitiesE. WhiteLGBT StatusA. LGBTB. Heterosexual/CisgenderPositionA. StaffB. StudentC. TraineeD. Faculty64Mean (SD)aSignificant GroupbDifferences4.07 (0.66)4.12 (0.72)A vs B3.93 (0.85)3.98 (0.86)A vs B4.16 (0.68)3.92 (0.77)4.11 (0.73)3.94 (0.80)4.11 (0.66)A vs B, DB vs A, C, EC vs B, DD vs A, C, EE vs B, D4.12 (0.77)3.75 (0.92)4.00 (0.80)3.83 (0.95)3.95 (0.85)A vs B, D, EB vs A, C, EC vs BD vs A, EE vs A, B, D3.99 (0.80)4.10 (0.68)A vs. B3.89 (0.92)3.96 (0.85)A vs B4.07 (0.68)4.06 (0.82)4.12 (0.75)4.18 (0.68)A vs DB vs D(none)D vs A, B3.87 (0.87)4.30 (0.70)4.35 (0.65)4.03 (0.86)A vs (all)B vs A, DC vs A, DD vs (all)Equitable reward & recognitionCharacteristicAccess to opportunityMean (SD)aSignificant GroupbDifferencesCultural competenceMean (SD)aSignificant GroupbDifferences3.60 (0.97)3.72 (0.98)A vs B3.91 (0.71)3.94 (0.75)(none)3.91 (0.89)3.49 (1.02)3.80 (1.00)3.46 (1.07)3.63 (0.96)A vs B, D, EB vs A, C, EC vs B, D, ED vs A, C, EE vs (all)4.03 (0.75)3.64 (0.86)3.97 (0.79)3.73 (0.86)3.95 (0.68)A vs B, D, EB vs A, C, EC vs B, ED vs A, CE vs A, B, D3.52 (1.04)3.65 (0.97)A vs. B3.73 (0.84)3.93 (0.72)A vs B3.59 (0.97)3.90 (0.95)4.02 (0.88)3.56 (1.04)A vs B, CB vs A, DC vs A, DD vs B, C3.91 (0.71)3.95 (0.83)4.06 (0.76)3.91 (0.71)A vs CB vs DC vs DD vs B, CPresidential Commission on Race and Diversity: Final Report Appendices
Table J3: ContinuedTrustCharacteristicGenderA. FemaleB. MaleRace/EthnicityA. AsianB. BlackC. Hispanic/LatinoD. Other / 2 Races or EthnicitiesE. WhiteLGBT StatusA. LGBTB. Heterosexual/CisgenderPositionA. StaffB. StudentC. TraineeD. FacultyMean (SD)aSignificantGroupbDifferences3.91 (0.81)4.01 (0.84)A vs B3.94 (0.71)3.98 (0.76)A vs B4.03 (0.78)3.62 (1.00)4.02 (0.84)3.73 (0.96)3.98 (0.78)A vs B, DB vs A, C, EC vs B, DD vs A, C, EE vs B, D4.06 (0.71)3.77 (0.78)3.98 (0.73)3.78 (0.82)3.97 (0.71)A vs B, D, EB vs A, C, EC vs B, DD vs A, C, EE vs B, D3.71 (0.95)3.96 (0.81)A vs. B3.83 (0.82)3.97 (0.72)A vs B3.93 (0.82)3.89 (0.93)4.07 (0.76)3.91 (0.87)A vs CB vs CC vs (all)D vs C3.92 (0.72)4.01 (0.77)4.09 (0.72)4.01 (0.77)A vs (all)B vs AC vs AD vs ASignificantGroupbDifferencesAppreciation of ind. attributesSignificantaMean (SD)GroupbDifferencesRespectCharacteristicGenderA. FemaleB. MaleRace/EthnicityA. AsianB. BlackC. Hispanic/LatinoD. Other / 2 Races or EthnicitiesE. WhiteLGBT StatusA. LGBTB. Heterosexual/CisgenderPositionA. StaffB. StudentC. TraineeD. FacultyaSense of BelongingSignificantaMean (SD)GroupbDifferencesMean (SD)a4.03 (0.68)4.08 (0.74)A vs B3.93 (0.75)3.98 (0.79)A vs B4.13 (0.70)3.75 (0.86)4.06 (0.75)3.84 (0.86)4.08 (0.66)A vs B, DB vs A, C, EC vs B, DD vs A, C, EE vs B, D4.08 (0.74)3.77 (0.84)4.03 (0.76)3.80 (0.89)3.96 (0.75)A vs B, D, EB vs A, C, EC vs B, DD vs A, C, EE vs A, B, D3.85 (0.83)4.06 (0.69)A vs. B3.80 (0.88)3.96 (0.75)A vs B4.02 (0.70)4.09 (0.72)4.14 (0.73)4.05 (0.72)A vs B, CB vs AC vs A(none)3.92 (0.76)4.04 (0.80)4.07 (0.77)3.93 (0.80)A vs B, CB vs A, DC vs A, DD vs B, CMean scores could range from 1 to 5, with higher scores indicating greater perceived engagement and inclusion by respondents.b For each factor, the P value from ANOVA is statistically significant at the P .001 level, indicating that there is at least one differencebetween groups. Group difference significance was estimated using least squares means and adjusted for multiple testing. All listeddifferences are significant at least at the P .05 level. As an example of interpretation: For race/ethnicity, A vs (B, C, D, E) indicates thatrespondents who self-identified as Asian have a significantly different mean factor score than those of respondents who self-identified asblack/African American, Hispanic/Latino, other, or white.65Presidential Commission on Race and Diversity: Final Report Appendices
Figure J1: Inclusion Factors- Agreement by Position at the University:Average Percent ‘Agree’ or ‘Strongly Agree’ by nts50Figure J2: Inclusion Factors- Agreement by GenderAverage Percent ‘Agree’ or ‘Strongly Agree’ by Theme10095908580757065Men60Women555066Presidential Commission on Race and Diversity: Final Report Appendices
Figure J3: Inclusion Factors- Agreement by Race/EthnicityAverage Percent ‘Agree’ or ‘Strongly Agree’ by ther50Figure J4: Inclusion Factors- Agreement by LGBT StatusAverage Percent ‘Agree’ or ‘Strongly Agree’ by ential Commission on Race and Diversity: Final Report Appendices
Appendix J.A: DES Conceptual FrameworkThis appendix is excerpted from the DES User Guide, pp. 12-15.DES Conceptual FrameworkResearch literature suggests that diversity in organizations has an advantage if the conditions are right– when the value proposition for diversity is endorsed and a strong business rationale has beendefined, and when it has been implemented comprehensively. Research findings also indicate thatwhen there is a high pro-diversity climate and alignment between employees and managers’perceptions of the climate, the workplace environment is more conducive for improved individual andoverall organizational performance. Moreover, teams that consist of diverse perspectives, ideas,interpretations, experiences, and backgrounds contribute to better problem solving and organizationalproductivity than homogenous ones. In order to achieve these benefits, it is necessary to examine theconditions supporting diversity and inclusion as institutions strive to meet their goals and pursueexcellence and innovation.One such condition is the practice of employee engagement. Engaged employees who demonstrate astrong connection to the mission of the institution and who are committed to working towards theinstitution’s success are the foundation for an inclusive work environment. Thus, DES, as aninstitutional diversity measurement tool, is grounded in workforce engagement theory.Workforce engagement theory is a business and management philosophy which proposes thatemployees who are more connected to work are more productive and are more likely to contribute toachieving institutional goals. Note that workforce engagement is distinctly different from employeesatisfaction and motivation which are related to such factors as their relationship with their manageror co-workers, fairness of pay, work environment and benefits.Employee engagement theories are derived from 1920 studies of morale or a group’s willingness toaccomplish organizational objectives. These studies were further incorporated into academic researchas distinct from employee satisfaction in the early 1900’s. Engagement theory forms the basis of theeight defined inclusion factors that describe the full acceptance of individuals and groups in anorganization.The DES is designed to identify the workplace conditions that support inclusion of all of its employees.The twenty-two items of the DES assess levels of employee engagement as a means to develop ameaningful inclusion scorecard that characterizes the institution’s progress toward creating aninclusive work environment.Each of the 22 items in the survey is mapped to one of eight inclusion factor, and each of the eightinclusion factor is mapped to one of three engagement clusters as illustrated in Table 1.68Presidential Commission on Race and Diversity: Final Report Appendices
Table J.A1. Relationship of Engagement Cluster Categories to Inclusion FactorsEngagement ClusterInclusion FactorsVision/Purposecommon purpose, access to opportunity, equitable reward and recognition, culturalcompetenceCamaraderietrust, sense of belongingAppreciationAppreciation of individual attributes, respectWhat is Engagement?Definitions of engagement describe a connection between the employee and the goals of theInstitution: Employees’ willingness and ability to contribute to company’s success. Staff commitment and sense of belonging to the organization. Employees’ commitment to the organization and motivation to contribute to the organization’s success. Employee’s exertion of “discretionary effort” going beyond meeting the minimum standards for the job. Creating the sense that individuals are a part of a greater entity.Research suggests that the majority of American workers are not engaged in their jobs with a reportedhigh of 70% as disengaged and only 30% as actively engaged. This is an alarming concept sinceacademic literature points to a strong connection between human achievement and the intellectualand emotional levels of engagement of individuals. People bring their full selves to work. Thus, tomaximize performance individuals must be engaged intellectually and emotionally.Engagement leads to: Loyalty: Employees experience an emotional attachment to the institution and want to remain anemployee.Confidence: Employees perceive that resources are available to help them succeed.Integrity: Employees are consistently treated fairly and respectfully.Pride: Employees experience as sense of belonging and act as good ambassadors for the institution.Passion: Employees believe that the institution is the best place to use their energy and to growprofessionally and personally.Engaged employees are loyal and psychologically committed to the organization and its goals.Employees who are not fully engaged may be productive but are not psychologically connected to theorganization’s goals and mission. Actively disengaged employees are not only psychologically absentbut risk sabotaging the mission and business goals of the institution.Given the benefits of having an engaged employee base, it is imperative to measure the degree ofengagement in the organization and to work toward responding not only to the intellectual needs ofemployees but to address those emotional needs that connect employees to the organization’s visionand purpose; other members of the institution as comrades; and their need to be appreciated asindividual contributors to the organization’s overall mission.69Presidential Commission on Race and Diversity: Final Report Appendices
In sum, Vision/Purpose, Camaraderie and Appreciation are three engagement domains related to theeight defined inclusion factors. An engaged workforce is the foundation upon which an inclusive workenvironment can be built. Diverse groups of engaged employees are a powerful force. They generatemore ideas, make more positive changes and help advance great institutions. To achieve these kinds ofremarkable results an inclusive organization must be created.What is Inclusion?Inclusion is a set of social processes, which influence an individual’s access to information and socialsupport, acquisition of or influence in shaping accepted norms and behavior, security within anidentity group or in a position within the organization, access to and ability to exercise formal andinformal power.Full acceptance of membership in an organization depends on an individual’s ability to be seen as theprototype of that organization. The prototypical member will personify the norms, behaviors, valuesand even appearance seen as important to maintaining the culture of the organization and powerrelations within it. As a result, diversity or divergence from the prototype introduces tensions aroundwho belongs in the organization. When understood and managed effectively this tension can bedescribed as good or creative tension that produces new ideas, new products and new processes.Creative tensions appear and are negotiated through social dynamics that influence inclusion as it isexperienced by individuals. These dynamics are the result of three factors experienced or perceived byindividuals: Inclusion-Exclusion— the quality, frequency, and tone of day-to-day social interactions andinterpersonal experiences that move individuals toward or away from a sense of full membersh
The Diversity Engagement Survey measures and describes the inclusiveness of an academic environment, defines the institutional areas of strengths and areas for improvement, and can help inform a strategic direction for organizational change. This tool draws upon workforce engagement theor