Transcription
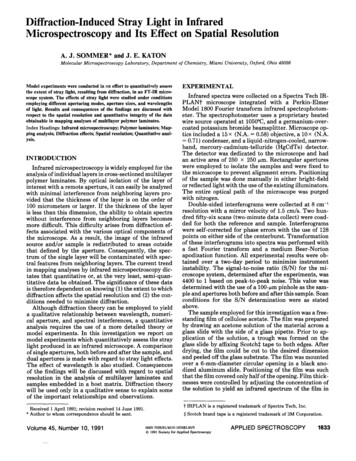
SOME STRAY-LIGHT-REDUCTIONDESIGN CONSIDERATIONS FOR ATSTAndrew Buffington and Bernard V. JacksonCenter for Astrophysics and Space SciencesUniversity of California, San Diego18 April 2002, revised 17 July 2002I.IntroductionWhen the Advanced Technology Solar Telescope (ATST) serves as a coronagraph and is viewingsky just off the solar disk, the design specification requires that stray-light surface brightnesswithin the field of view (FOV) be reduced below 10-6 of the brightness when viewing directly onthe solar disk. The FOV is nominally 2½ arcminutes (0.042 ) in radius. A desired accessible skyregion begins a little beyond one solar radius (R? ) and extends out to 2 R? . The baseline ATSToptical design is off-axis Gregorian with a parabolic main mirror (M1) 4 m in diameter, a heatstop/coronagraph occulter near prime focus, and a secondary mirror (M2) to direct the light to 2ndfocus. Beyond this, the optical design is being evaluated and defined as needed.This memo discusses image quality, and scattering-induced stray-light processes withinthe observatory building and associated with the optics up to 2nd focus, that could degrade data byadding background. Stray light as evaluated here originates as sunlight either within the mainviewing column intercepted by M1, or outside of this due to the requisite larger opening in theroof or wall through which sunlight enters the building. When viewing off the solar disk, someon-disk light enters the FOV anyway, by scattering one or more times from telescope elementsand/or the building’s interior floor, ceiling and walls. Strictly speaking “scattering” here shouldinclude diffraction from the edges of the various optical elements, but we will defer that to a latermemo. This memo includes scattered-light estimates based on solid angles subtended by M1 andthe FOV, and confirming calculations using “ZEMAX”, the optical design program developed byFocus Software, Tucson AZ. Briefly, both the original manufacturing and the subsequentcontamination control of M1 appear to present ATST with great challenges.II.ConfigurationsFigures 1 and 2 show a baseline layout configuration for ATST. This particular one is an f/2version having an 8 m prime focal length and a cylindrical building offset from the verticalparabola axis. Also under consideration for ATST is a larger f/3 design. We analyze both designshere, as a way of bracketing a potential ATST design space.In figure 1, light headed toward the center of the FOV enters through an opening in theroof (top), reflects from M1, passes through prime focus to M2, and from there to 2nd focus. The“coronagraph stop and heat shield” (figure 2) is a solid with conical inside and outside surfaces.Outside, it is a mirror resembling a volcano, with its upper rim close to the prime-focus plane.This rim defines where the FOV ends. Its mirrored surface disposes of unwanted light incidentjust outside of the FOV, deflecting it away from the optical axis at roughly 90 . The mirror coversout to a sky angle of 0.75 from the center of the FOV, large enough to include the whole solardisk when viewing anywhere around the Sun out to 2 R? . The inner surface of this object isblackened, with cone angle just large enough to avoid vignetting light headed towards M2.1
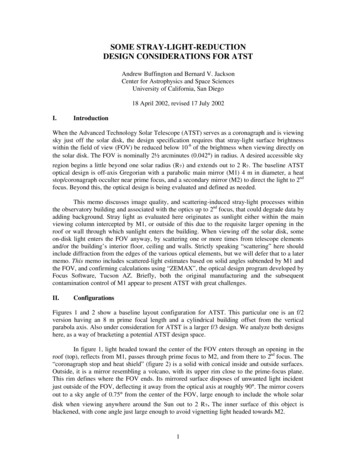
We show later in this memo that disposal of the unwanted light does not requireabsorbing it nearby the cone in a “beam stop”. ATST’s building is sufficiently large and the FOVopening in the heat shield sufficiently small, that dumping stray light onto the inside of thebuilding suffices to control potential multiple scattering into the FOV. Further, for simplicity(although it also benefits keeping the subsequent optics clean) we here assume that all lightultimately reaching ATST detectors optically downstream of prime focus passes through thiscentral hole, and has no other entry path. Thus, all the optical path beyond the prime-focus cone iscovered and made “light tight”.Figure 1. Basic optical layout of the f/2 design with cylindrical observatory “dome”, as drawn bythe non-sequential ZEMAX display (see discussion below and appendix A). Sunlight (blue rays)enters through an opening in the roof (in red at top) and reflects from M1 through the primefocus, and then from M2 to the 2nd focus. To give this figure a size scale, the cylinder height is 18m. The f/3 design is similar, although the building is significantly larger.Table 1 summarizes ATST design parameters used here, both for the above-illustrated f/2configuration and the larger f/3 one. These optical configurations were provided by JimOschmann on 4-1-02 and 3-12-02 respectively, while the building configurations were providedby Mark Warner on 4-1-02. Units are meters except where indicated. Table 2 presents values forthe solid angle subtended by the FOV opening in the heat-stop cone, as viewed from an averagelocation on mirror M1, and similarly from the floor of the building, and of M1 as viewed from theroof. These are used in the next section to estimate stray light scattering into the FOV.2
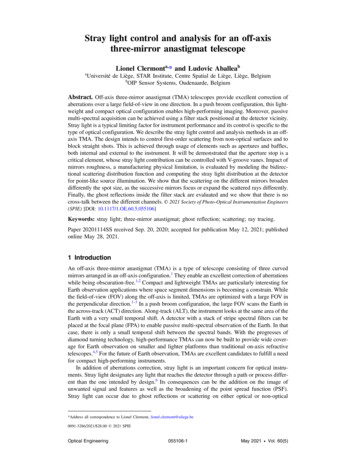
Figure 2. Region near M2, enlarged. The FOV is defined by an opening near the vertex of theConical Mirror (the outside of which is here shown in red): this cone serves as both a heat shieldand a coronagraphic stop. For the scattered-light analysis presented in this memo, the enclosure ofall the optical path beyond this FOV opening is approximated by two structures: one encloses theregion between the heat shield and M2, and the second picks up from this and extends down to2nd focus, out the bottom of this figure. These are reflecting on the outside and absorbing on theinside. The heat shield’s interior conical surface and rear plane are also absorbing black. Finally,the M2 enclosure is capped behind M2 by an absorbing disk. An annular absorbing disk, the “Reimaged M1 Aperture Stop”, extends to just inside the re-imaged edge of mirror M1, and serves asthe main instrument pupil, the “Lyot stop”. M1 itself is assumed to be 4.038 m in diameter whenviewed in projection by incident light; an absorbing annulus placed just in front of it reduces thisdiameter to 4.02 m, and the Lyot stop illustrated above further reduces it to the baseline 4.00 m.ZEMAX analyzes these optical designs in both the sequential format, where lightencounters each element in the specified order, and non-sequential, where light encounters anyobject along its path, until a specified number of segments is reached (typically 15 to 17).Appendix A presents several useful tips we discovered (with significant help from technicalsupport at Focus) using ZEMAX that perhaps were unclear in the manual. Appendices B and Clist prescription data for the two non-sequential designs, and Appendix D presents the shortFORTAN listing which specifies the edges for mirrors M1 and M2, the same in bothconfigurations. Scattering calculations also require augmenting ZEMAX’s “Abg data.dat” file toinclude an appropriate scattering description for mirror contamination (see section VII).3
Building:diameterheightoffsetheight of optical Z 0 above floorM1:diameter *focal lengthoffset of center rel. to parab. axisHeat Stop: FOV opening radius **(prime-focus cone)outer radiuslengthtilt of conical axis rel. to parab. axisM2:diameterradius of curvatureconic constantdistance beyond prime focusoffsetDistance from M2 to 2nd focusf/2 configuration (small)241814.54840.0067, 0.042 0.1267, 0.75 0.12026.565 0.4181.500024-0.765670.80.40412.002f/3 configuration (large)35.527.25-5541240.00905, 0.042 0.148, 0.6 ***0.13918.435 0.4182.1818729-0.6694881.20.40412.002Table 1. ATST configurations employed in the present memo.Notes:*This is the nominal diameter resulting after instrument pupil is imposed. The actualmirror is taken to be larger by 38 mm, and a smaller aperture is placed just above it.**The edge of the FOV is here defined as 50% vignetting of an unresolved image centeredat this radius. The true, unvignetted FOV is about 0.040 in radius (see next section).***The outer radius of the heat stop cone is for the f/3 case restricted due to the closeness ofthe light path between M2 and 2nd focus. A longer and larger cone covering out to thedesired 0.75 could either be partially cut away to accommodate the M2-to-2nd focus lightpath and accompanying enclosure, or the design could perhaps be altered slightly (e.g.,by tipping M2) to increase the clearance.f/2 configurationf/3 configuration2.2 10-61.8 10-69 10-79 10-76.9 10-22.5 10-2Ω PFM1:solid angle (ster.) subtendedby FOV opening, viewed from M1Ω PFfloor : solid angle subtended byFOV opening, from avg. bldg. floor1ΩMroof : solid angle subtended by M1from avg. bldg. roofTable 2. Solid angles subtended by the prime-focus cone opening, as viewed from M1 and fromthe building floor, and of M1 as viewed from the building roof.4
III.Simple stray-light estimationsThe amount of scattered stray light entering the FOV opening at the apex of the prime-focus conePFM1is easily estimated using table 2’s subtended solid-angle values Ω PFM 1 , Ω floor , and Ω roof . Theseestimates immediately show several of this memo’s conclusions.As an example, consider an idealized case where the Sun illuminates only mirror M1, andATST points 0.5 away from the center of the solar disk. Assume further that all of M1’sspecular-reflected sunlight is reflected by the cone and then completely absorbed upon reachingthe building wall or roof. Now only that light scattering from contamination dust, eithersuspended within the viewing column or settled upon the M1 mirror surface, which then headstowards the prime-focus cone’s opening, can enter that opening. Ignore suspended contaminationfor the present. Assume that dust particles are large, scattering a fraction FM 1 of the lightisotropically (Lambertian angular distribution), and distributed uniformly over the M1 surfacearea. In this case the fractional light entering the prime-focus FOV opening is:scatPFRM1 FM 1 Ω M 1 / 2π.(1)Thus, in the case of FM 1 0.1 and the f/2 configuration, 3.5 10-8 of the incident sunlightenters the FOV. Since the 0.084 diameter FOV covers only about 1/40 the area of the Sun’s disk,-6scatthe net surface-brightness reduction is R M1 1.4 10 . An equivalent estimation for the f/3configuration yields 1.1 10-6, a bit smaller. Noting that this light is pretty muchindistinguishable from legitimate light entering from within the FOV, we conclude that an FM 1 0.1 mirror is significantly dirty and marginally fails to deliver the desired coronagraphicspecification. The situation worsens substantially when a typical Mie forward-scattering angulardistribution is included, appropriate for small contamination particles and for “mirror signature”(see section VII). In reality, the specification becomes FM 1 0.1 and M1 contamination controlbecomes a major ATST design challenge.This method can also estimate stray-light scattering into the prime-focus FOV from theinside of the building, where the floor may be illuminated directly by sunlight, or the wallsindirectly by light reflected from the heat-shield conical mirror. HerePFR scatfloor F floor Ω floor / 2π,(2)where F floor is the floor paint reflectivity, typically 0.3 for gray and 0.1 for black, and anisotropic angular distribution for a matte finish. Thus if, say, 10 times more than mirror M1’s area(maybe the roof of the building has a large opening near the viewing column) illuminates a graypainted floor, then 10 0.3 9 10-7 / 2π 4.3 10-7 the equivalent of full sunlight on M1 entersthe cone’s opening. This number roughly doubles when including multiple scattering from therest of the building. If all this light entering the opening in the cone were re-imaged into the FOVat 2nd focus by M2, the resulting surface-brightness reduction (as in the above example) would bean unacceptably large 3.4 10-5. However, this light misses M2 after passing through the FOVopening because it didn’t come from M1. It therefore is easily reduced well below the requisite10-6 by the black surfaces inside the cone and on the inside of the subsequent optics enclosures.5
As a final example, consider that light reflected from the cone scatters off the roof/wall ofthe building back to a dirty M1 surface, where it rescatters into the FOV at prime focus. HerescatM1 Froof Ω roof FM 1 Ω PFR roofM 1 / 2π,(3)where Froof 0.3 for gray paint and FM 1 0.1 as in the above examples. Here, the values fromtable 2 yield a result only several percent of the first example above, negligible.The above estimates are confirmed by ZEMAX calculations described later in this memo.Two major ATST conclusions can quickly be drawn from these examples: Sunlight reflected from the heat shield/coronagraph occulter does not need to be absorbednearby, and can be safely dumped into the interior of the building; and Except maybe close to the M1 mirror mount, the building interior can be typical black oreven gray paint, without generating significant stray light in the FOV.IV.Vignetting near the edge of the FOVSpot diagrams show the transition near the edge of the FOV, as parallel incident light nears0.042 to the optical axis and M1-reflected rays begin to be intercepted by the rim of the conicalheat shield/coronagraph occulter. Figures 3 and 4 show the coma-dominated results for the twoconfigurations. The cone location/orientation may later need adjustment (see next section).Figure 3. Prime-focus image shapes, f/2 design, at incident-light angles of 0.042 separatelyabout the X and Y axes. The light-blue region marks the nominal FOV defined by the 13.4 mmdiameter rim in the conical mirror. The images are about 0.005 in length. Thus the zone withinwhich the FOV is partially vignetted begins at a radius a little larger than 0.039 and extends outto about 0.045 . Beyond this latter the conical mirror acts fully as a coronagraphic occulter.6
Figure 4. Similar to figure 3, but for the f/3 design, again at incident-light angles of 0.042 separately about the X and Y axes. The light-blue region marks the nominal FOV, as defined bythe 18.1 mm diameter rim opening in the heat shield/coronagraph stop. The coma-dominatedimages are about 0.0025 in length; thus the zone where images are partially vignetted by thecone opening begins at a radius of 0.0404 and extends to 0.0428 beyond which geometricalcutoff is complete. The region of transition between no vignetting and fully occulted is reducedhere compared with figure 3, by the expected factor of the focal ratios squared (4/9) that appliesto coma-dominated images (e.g., see Smith 1966, equation 13.19). Figures 3 and 4 are generatedby ZEMAX, nonsequential configuration, as viewed by a “detector” placed in the plane of theopening at the top of the heat-shield conical mirror.V.Revisiting Instrument-Pupil and Heat-shield-Cone Parameters.Although present concepts suffice here, both the location/shape of the aperture at the re-imagedM1 edge (the Lyot stop, see figure 2) and details of the heat-shield/coronagraph-stop cone shouldbe re-done once the ATST design is complete. For example, figure 5 details convergence for thef/2 case, of ray fans at incident angles of 0.042 and 0 , viewing along X near the cone’s rim.This suggests that the vignetting-zone width at the edge of the FOV could be halved if the conewere to be tipped at about 40 rather than 26.565 as used here (table 1), the same as the anglebetween the optical axis and the M1 axis. This latter angle was used both to orient the heat-shieldcone and locate the plane of the re-imaged M1 edge: simple, but maybe not optimum. Details ofthe light-absorbing interior of the heat-shield cone also need specification: the cone’s interior willprobably be machined in a stepped fashion, not smooth. Finally, the detailed cone rim itself maywarrant further careful study and specification (e.g., see Koutchmy 1988, section 3.1).7
Figure 5. Detailed convergence of the 3 ray fans whose corresponding coma-dominated spots areshown in figure 3, above, in the center and below, where they intersect the plane of the opening inthe heat-shield cone. This plane is here shown in red, where the rim of the cone cuts off some ofthe light incident at 0.042 (green) and –0.042 (red) angle about the X-axis. The size of thiscutoff zone at the edge of the FOV would be reduced, if the cone opening were oriented at about40 (purple line above), rather than the 26.565 used here.VI.Geometric Spot Shapes at 2nd FocusFigures 6 and 7 illustrate spot shapes with the ZEMAX sequential format, for center FOV andcardinal-point locations just inside the edge of the FOV. The f/2 and f/3 configurations generatealmost identical 2nd focus spots; in both cases we have relocated the 2nd focus plane a fewmillimeters below the original location, to minimize the spot sizes. Small amounts of aberrationpersist at 2nd focus, but the Gregorian design reduces these to about 10µ in size, while thenominal FOV radius 0.04 spans 84 mm. The spots are ½ 10 –5 degrees in size, about half of anAiry-disk radius RA(λ) 1.22 λ/D, 9.6 10-6 degrees for ATST with λ 0.55µ. Thusgeometrical image size is not a major consideration over the whole FOV for visible light, and isnegligible for longer wavelengths. Moreover, RA(λ 0.55) 10 microdegrees is a handy angularscattering specification for ATST.8
Figure 6. 2nd focus spot diagrams for the f/2 configuration, at center of FOV (upper left) and atfour places near the edges of the FOV. Incident-light angles here are: Blue, on-axis; Red andGreen, -0.04 and 0.04 about the Y-axis; and Brown and Purple, 0.04 and –0.04 about theX-axis. Here the optical folding of M1 and M2 lies in the Y-Z plane, so the images of fields 4 and5 (Brown and Purple) are simply left-to-right reversed one relative to the other (incident light at 0.04 to the Y-Z plane), while those of fields 2 and 3 (Red and Green) differ slightly from oneanother and from fields 4 and 5. The size bar is 30 microns long.9
Figure 7. 2nd focus spot diagrams for the f/3 configuration, at center of FOV (upper left) and atfour places near the edges of the FOV, as in figure 6. The two configurations (f/2 and f/3) differinsignificantly at 2nd focus with respect to plate scale and geometrical-optics spot shapes.VII.Scattering from Manufacture, Contamination, Dust and BugsATST performance will depart from the above calculations due to “Mirror Signatures” for M1and M2, and scattering from contamination. Contamination is here included only for M1, sincethe rest of the optical path is enclosed and is by comparison probably easy to keep clean.A.Mirror Signature“Mirror signature” is defined as the intrinsic deviation of M1 and M2 from their respective idealparabolic and elliptical shapes. Small-scale “microroughness” consists of that portion of thesignature having transverse size scales of, say, a centimeter and less. This is sometimes called“mirror-surface quality”, and is often specified by an arithmetic-average surface roughness (e.g.“20Å or better”), derived perhaps from a direct-probe profile measurement (Stover 1995, §1,2).Sometimes instead rms surface roughness is specified. However, this one number tells only halfof the story: a transverse scale size must also be specified, to evaluate the degradation the ATSTmight suffer due to small-scale signature errors of M1 and M2. We here exclude the larger-scale“mirror figure errors”, which typically take over from “surface roughness” at transverse sizescales larger than a centimeter. These too are important for ATST, but are presently deferred toothers or to a future memo, along with positioning and alignment error.10
An appropriate transverse size scale for a given amount of microroughness may beinferred from reported properties of polished surfaces (Church, 1988). This in turn enables anestimation of total integrated scatter (TIS) from average surface roughness alone (Peterson 1993). 4πσ TIS λ 2(4)where σ is the microroughness. Taking σ 20Å and λ 0.5µ yields TIS 2.5 10-3; this can bethought of a fractional amount of light suffering a “scattering” because of microroughness. Theabove fractional scattering is of minimal importance for disrupting the above spot diagrams(figures 6, 7) but may be of concern if more than several percent of it has a characteristic angle ofapproximately 0.5 . About 1% of this light scattered from the solar disk enters the coronagraphicFOV. Light scattered by much smaller angles doesn’t reach out to the FOV, and scattered bymuch larger angles is “diluted” by being spread over a large area. In any case, careful attentionmust be paid to this aspect of M1, since the coronagraphic specification is 10-6. Specifying,manufacturing, testing and certifying M1 could prove a significant challenge for ATST.B.Dust, Dead Bugs and Animal HairsInevitably, ATST mirrors degrade with time due to contamination settling onto theoptical elements, especially M1 since this is ATST’s most exposed optical element. In anobservatory environment with a large viewing-column opening, dust-particle size ranges fromabout 1 micron up to 0.1 mm. Below this the particles either never settle out or getelectrostatically attached somewhere else. Particles above this range require a strong wind to keepthem aloft; we wouldn’t open the slot anyway during such conditions. In any case, some ofwhatever gets in will settle on M1.Some larger non-dust particles “walk or fly in by themselves”, and may also end up onM1. This includes flying insects that were fried near prime focus or otherwise expired. Similarly,animal (and people) dander and hairs, and other debris, can blow up from the floor and can getdeposited onto M1. An observatory with its traffic and open slot is not much like a clean room!Light directly scattered by large particles on M1 generally is Lambertian and thuspresents little problem for ATST because Ω PFM 1 (table 2) is so small. However, a roughly equalamount of light to the integral of all this wide-angle scattering diffracts around the shadow cast bythe particle upon M1. In most telescopes this diffraction angle is too small to be of concern, butnot with ATST. The characteric diffractive “scatter angle” of a spherical particle having diameterS is ΘS 1.22λ/S. The angle to compare this with is about ¼ degree, 0.005 radians, the anglebetween the Sun’s disk and a typical coronagraphic FOV. For λ ranging from 0.55 5µ, the Stypicaly diffracting at this angle is 0.13 1.2 mm. This range is larger than most wind-blowndust, but typical for contamination particles that “walk in by themselves”. Moreover, ATST’sdesired 10-6 surface-brightness reduction requirement is exceeded when only a tiny fraction( 0.01%) of M1’s area is covered by such particles.C.BRDF CharacterizationsOptical contaminant scattering is often characterized by measuring the bidirectional reflectiondistribution function (BRDF) for a deposit of the particular contaminant of interest on a testmirror. This quantity is an angular distribution of the scattered light, with a geometricalperspective cos θs factor taken out:11
BRDF dPs / dΩ sPi cos θ s,(5)where Pi , Ps are the incident- and scattered-light intensities and θs is the scattering angle. TheBRDF is constant with θ for isotropic scattering, but peaks greatly towards small θ for smallparticle Mie scattering and for the diffraction effect mentioned just above. In the small-angleregime of interest for most ATST applications, the cos θs factor matters little.Spyak and Wolfe (1992) have measured the BRDF for dust-contaminated mirrors, andcompare the result with calculations of a Mie-scattering model. Theory and measurementscorrespond well, although their measurements are restricted to θ 2 , significantly above thescattering angular domain of interest for ATST. Their most-contaminated sample was a mirrorthat became 0.1% covered after being exposed for about 3 months face up in a low-traffic backroom. Figure 10 includes the measurements of BRDF for this mirror. Not surprisingly, S & Wfind that BRDF measurements simply scale with the amount of contamination, and the shape ofthe distribution does not change. The scattering distribution is flat (Lambertian) at very wideangles 30 , but below this increases, growing nearly 100-fold compared with the wide-anglevalue, by a 2 scattering angle. How far this increase continues towards smaller angles isunknown. Their mirror signature predominated below about 3 : below 2 they were not confidentabout a subtraction, which limited the measurement domain.J. Varsik (in a series of reports starting in 1996, also Varsik et al. 1997) observedparticle-size distributions for mirrors exposed to observatory conditions at Apache Peak.Fractional mirror-coverage rates of about 0.07% per hour were typical, although sometimes wereobserved to be much worse. The particle distributions were similar to those reported by Spyakand Wolfe, thus suggesting that S&W’s BDRF measurements apply also to mirrors exposed to anobservatory environment. But note: sometimes the equivalent to S&W’s “3 months mirror” dustcoverage occurs in just a few hours! We’ll show shortly that this much dust is probably of order100 what is acceptable for ATST in coronagraphic mode.Stover (1995) presents numerous BRDF measurements, some extending well below 2 ,but most work was for mirror signature and/or contamination conditions encountered in a cleanroom. Residual contamination within a clean room could well have a different particle-sizedistribution from that at an observatory site. Therefore, the present analysis extrapolates from theSpyak and Wolfe measurements, and employs the Stover small-angle results only as a guide.D.The ABg ModelZEMAX specifies scattering as Lambertian, or gaussian (used above for figures 8 and 9), or moregenerally for BRDF as:BRDF AB xg,(6)where x is the sine of the scattering angle θ, and A,B,g are three parameters which enablespecifying a wide range of BRDF measurements. This formulation extends the earlier HarveyShack model, which exploited the fact that plots of log(BRDF) versus log(x) often follow straightlines. When g 0, equation (6) is Lambertian. When g 0, B determines a (usually) small12
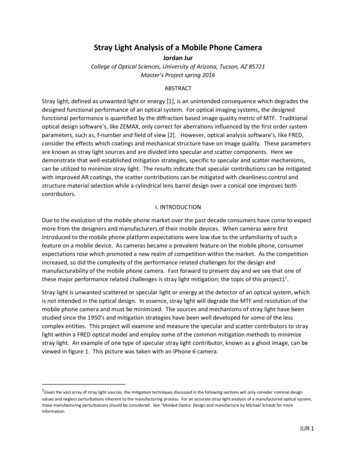
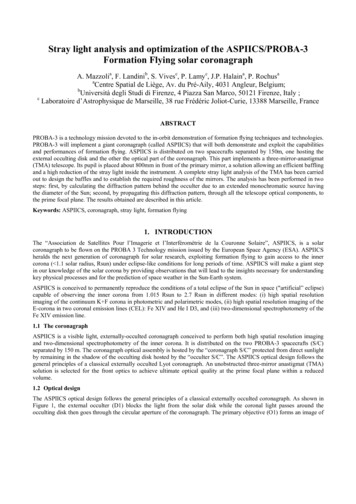
scattering angle below which BRDF stops increasing. When g 2 B limits the “infraredcatastrophe” when integrating the scattered-light BRDF all the way down to x 0.Spyak and Wolfe’s measurements suggest a steep slope of g 3 for 2 4 and λ 0.6328 nm. The question here: what should ZEMAX use to extend this “3 month” mirrormeasurement down to ATST’s 0.1 to 0.01 regime? Looking at figure 8, Spyak and Wolfe’scurve could continue rising with g 3 all the way to 0.001 (black). This is implausible, since theTIS of this curve approaches 100%, while microscope-observed particle coverage was only about0.1%. Perhaps instead the BDRF flattens out at about 0.1 (blue, TIS 2%), or maybe even justbelow 2 (green, TIS 0.1%). On the other hand again, maybe g 3 is too steep and a moregradual g 2, as often observed by Stover (1995), fits a wider range of angles. This slope mightextend to 0.005 (red, TIS 0.2%) or maybe only to 1 (purple, TIS 0.1%) before flattening out.We here take red and purple curves respectively, as pessimistic and optimistic cases.1E 008ABg 2.5 e-6, 1 e-13, 3ABg 2.5 e-6, 1 e-9, 3ABg 2.5 e-6, 1 e-5, 3ABg 4 e-5, 1 e-8, 2ABg 4 e-5, 1 e-4, 2Spyak and Wolfe (1992), 0.6 nm(3 months exposure)1E 0071E 0061E 005BRDF (per steradian)1E 0041E 0031E 0021E 0011E 11Scattering Angle, Degrees10100Figure 8. BRDF distributions, a range of possibilities down to 0.001 that might be inferred fromwider angle data. The present evaluations use red and purple curves to bracket a range ofexpected performance.13
VIII.Results with ZEMAXA. Confirmation of the Estimates of Section III.Table 3 presents results of 5 107 ray non-sequential calculations. Both f/2 and f/3 configurationshad parallel light incident on just M1 at 0.4 (typical for coronagraph operation), ABg scatteringon M1 with figure 8’s red curve, paint reflectivity 0.3 (gray), and rays followed up to 17segments. Any rays passing through the FOV opening in the heat-shield cone were saved for laterexamination. Each calculation took about 30 hours on a 450 MHz PC. Table 3 presents results forincident light at 0 (parallel to the parabola axis) but offset 6.5 m from M1, to illuminate thefloor. Of interest here is fractional energy passing through the cone opening, then absorbed eitherinside cone or enclosures or reaching 2nd focus. Table 3 confirms the estimates in section III.Inc. LightThru cone openingGet past ConeReach 2nd FocusConfiguration-2f/298 rays0.4 about X 137 rays, 2.4 10 W95 rays, 2.2 10-2 Wf/377 rays0.4 about X 103 rays, 1.9 10-2 W73 rays, 1.7 10-2 W-4f/2offset 6 m5 rays37 rays, 1 10 W1 ray, 2 10-6 Wf/3offset 6 m15 rays46 rays, 4 10-4 W1 ray, 1 10-9 WTable 3. ZEMAX calculations of fractional energy passing various points in ATST optics.To interpret this table, note that although total solar intensity is about 13000 W, only 1/40 of this,325 W, enters the FOV even when viewing the solar disk. Thus the 10-6 ATST coronagraphicspecification becomes 3 10-4 W, about 1% of the first two rows of table 3. Light reaching 2ndfocus in these two rows is dominated by direct scatter from M1, discussed in more detail in thenext section. The “bottom line”: to deliver the desired coronagraphic specification, mirror M1must be 100 cleaner than the S & W “3-month mirror” assumed for this calculation, hardto do! The bottom two rows bring better news: though marginally significant stray light scatteringinitially off the floor eventually finds the opening of the conical mirror, most is easily controlledby a suitable black surface placed inside the cone. Some gets past the cone (4th column) butalmost all of this is ea
Apr 18, 2002 · Simple stray-light estimations The amount of scattered stray light entering the FOV opening at the apex of the prime-focus cone is easily estimated using table 2’s subtended solid-angle values PF Ω M1, PF Ω floor, and M1 roof. These estim