Transcription
A Multimodal Corpus for the Assessment of Public Speaking Ability andAnxietyMathieu Chollet1 , Torsten Wörtwein2 , Louis-Philippe Morency3 , Stefan Scherer112Institute for Creative Technologies, University of Southern California, Los Angeles, CA, USAInstitute of Anthropomatics and Robotics, Karlsruhe Institute of Technology, Karlsruhe, Germany3Language Technologies Institute, Carnegie Mellon University, Pittsburgh, PA, USA{mchollet, scherer}@ict.usc.edu, uncwt@student.kit.edu, morency@cs.cmu.eduAbstractThe ability to efficiently speak in public is an essential asset for many professions and is used in everyday life. As such, tools enablingthe improvement of public speaking performance and the assessment and mitigation of anxiety related to public speaking would bevery useful. Multimodal interaction technologies, such as computer vision and embodied conversational agents, have recently beeninvestigated for the training and assessment of interpersonal skills. Once central requirement for these technologies is multimodalcorpora for training machine learning models. This paper addresses the need of these technologies by presenting and sharing amultimodal corpus of public speaking presentations. These presentations were collected in an experimental study investigating thepotential of interactive virtual audiences for public speaking training. This corpus includes audio-visual data and automatically extractedfeatures, measures of public speaking anxiety and personality, annotations of participants’ behaviors and expert ratings of behavioralaspects and overall performance of the presenters. We hope this corpus will help other research teams in developing tools for supportingpublic speaking training.Keywords: Multimodal corpus; public speaking training; virtual audiences1.IntroductionModern life often involves situations where we are requiredto speak in public, both in our professional lives, for instance when presenting results of our work in front of colleagues, and in our personal lives, such as when giving atoast at a wedding. A proficient public speaker mobilizes avast array of skills to perform a good speech, ranging fromthe selection and arrangement of appropriate and convincing arguments to the efficient vocal and non-verbal deliveryof the speech. Considering how prevalent public speakingsituations are in modern professional and personal life, itis only natural some individuals would desire to improvetheir ability to speak in public. Additionally, public speaking anxiety is an extremely common fear (Furmark et al.,2000; Bodie, 2010), and some people experience an unmanageable amount of stress when preparing or undergoingpublic speaking. These two situations warrant for the development of tools and methods to support the assessmentof public speaking ability, the training of public speakingskills and the reduction of public speaking anxiety.Multimodal interaction technologies (e.g. social signalsprocessing, virtual humans) have been deployed in manytypes of social skills training applications, from job interview training (Hoque et al., 2013; Ben Youssef et al., 2015)to intercultural skills training (Lane et al., 2013) or publicspeaking skills training (Damian et al., 2015; Chollet et al.,2015). Moreover, virtual audiences have been used for supporting people suffering from severe public speaking anxiety (North et al., 1998; Pertaub et al., 2002). Finally, recent works have proposed to automatically assess the publicspeaking ability of politicians (Rosenberg and Hirschberg,2005; Scherer et al., 2012; Brilman and Scherer, 2015) orjob applicants (Nguyen et al., 2013). The implementationof such technologies often require the use of multimodalcorpora, either as data for training the models that willrecognize multimodal behaviors (e.g. smiles, gestures) orhigher level variables (e.g. emotions of the user, performance of a speaker), or for building the repertoire of behaviors of a virtual character.In this paper, we present and share a multimodal corpusof public speaking presentations that we collected whilestudying the potential of interactive virtual audiences forpublic speaking skills training. This corpus includes audiovisual data and automatically extracted multimodal features, measures of public speaking anxiety and personality,annotations of participants’ behaviors and expert ratings ofbehavioral aspects and overall performance of the presenters. We hope this corpus will help other research teams indeveloping tools for supporting public speaking training.In the next section, after briefly presenting the interactivevirtual audience framework and the study we conducted togather data, we present our multimodal corpus of publicspeaking presentations. In section 3, we outline previousstudies that were realized using this corpus, on the evaluation of public speaking improvement and the automaticassessment of public speaking ability and public speakinganxiety, in order to demonstrate that this corpus can be usedfor a variety of different purposes. Finally, we present future directions of research as well as current extension workon our corpus.2.Multimodal CorpusOur corpus was collected in the context of a study on theuse of virtual audiences for public speaking training. During that study, we explored different feedback strategies ofvirtual audiences. To this effect, we compared learning outcomes of users training with a virtual audience providingfeedback according to one of three investigated strategiesusing a pre- to post-training test paradigm. We present oursystem and these feedback strategies in the next section.488
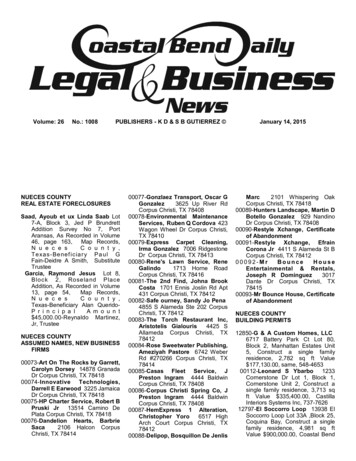
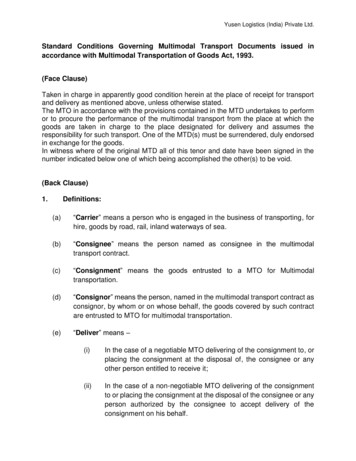
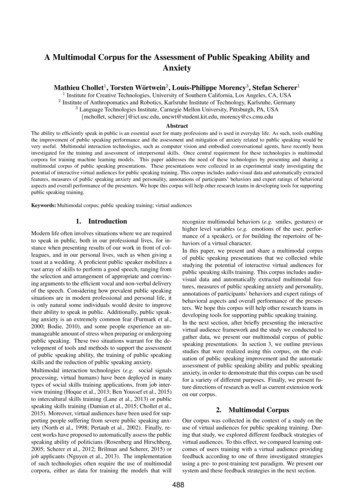
Direct Visual FeedbackLearning FrameworkAudiovisualBehavior SensingWizard of OzLearning FeedbackStrategyAInteractive Virtual AudienceABControl ConditionEvaluation:Q1. Self-AssessmentQ2. Expert AssessmentQ3. Objective AssessmentCFigure 1: (A) Our architecture automatically provides multimodal realtime feedback based on the speaker’s audiovisualbehavior. (B) We evaluated three feedback strategies: (IVA) an interactive virtual audience, (DF) direct visual feedback,and (Non-IVA) a non-interactive virtual audience (control). (C) We evaluated the participants’ performance improvementin a pre- vs. post-training evaluation paradigm with three assessment perspectives: (Q1) the presenters themselves, (Q2)public speaking experts, and (Q3) objectively quantified data.2.1.Public Speaking Training SystemWe developed a public speaking training framework basedon audiovisual behavior sensing and virtual audience feedback strategies: the speaker’s vocal and nonverbal behaviors are detected and feedback is provided in return according to pre-defined strategies (Chollet et al., 2015). We investigated three such strategies, presented in Figure 1B.In the direct visual feedback (DF) strategy, colored gaugeswere configured to give immediate feedback to the speakerabout his/her performance. For instance, when traininggaze behavior (e.g. increase eye contact with the audience),a full green bar would indicate to the participant that his/herperformance is very good. However, the virtual charactersonly adopted a neutral posture and did not provide additional feedback. When using the interactive virtual audience (IVA) feedback strategy, the virtual characters woulddisplay behaviors when specific conditions were met. Inour study, the characters would nod or lean forward whenthe participant’s performance was good, and they wouldlean backwards or shake their head when it was poor. Thethresholds used for triggering these behaviors were configured manually so that the different characters in the audience would not behave simultaneously and so that the ratioof positive vs negative behaviors would reflect the currentperformance of the user (e.g. if the participant was performing very well, all characters would be leaning forward andnodding regularly). Finally, in the control condition (NonIVA), the virtual characters adopted a neutral posture andno gauge was displayed.2.2.Study ProtocolA few days before their participation in the study, participants were instructed that they would have to present twotopics during 5-minute presentations. The first topic was apresentation of Los Angeles, California, the city in whichthe study was performed. The second topic was a salespitch for a beauty product. They were sent material aboutthose presentations (i.e. abstract and slides) in advance toprepare before the day of the study. On the day of thestudy, participants first completed questionnaires on demo-Training ConditionsInteractive VirtualAudience Training (IVA)N 16Pre-Training TestPresentationN 45Direct FeedbackTraining (DF)Post-Training TestPresentationN 14N 45Control ConditionNon-Interactive VirtualAudience Training(Non-IVA) N 151st presentation2nd and 3rd presentations4th presentationFigure 2: Study protocol.graphics, personality, and public speaking anxiety (cf. section 2.4.1.). Each participant then gave four presentations(cf. Figure 2). Presentations (1) and (4) consisted of preand post-training presentations where the participants presented the city of Los Angeles in front of a non-interactivevirtual audience (i.e. configured in the control condition).Between these two tests, i.e. during presentations (2) and(3), the participants trained with our system using the salespitch topic. In presentation (2), the training was targeted atreducing the amount of pause fillers they produced whilespeaking. In the second training presentation, i.e. presentation (3), the aim was to improve the participants’ eyecontact with the audience. Every participant was givenan information sheet with quotes from public speaking experts of the Toastmasters organization1 about how gaze andpause fillers impact a public speaking performance2 . Thesetwo basic behavioral aspects of good public speaking performances were specifically chosen following discussionswith Toastmasters experts. In addition, these aspects canbe clearly defined and objectively quantified using manualannotation enabling our threefold evaluation. During thetraining presentations, i.e. presentations (2) and (3), the au1http://www.toastmasters.org/Written hints provided before training://tinyurl.com/m4t6l622489http:
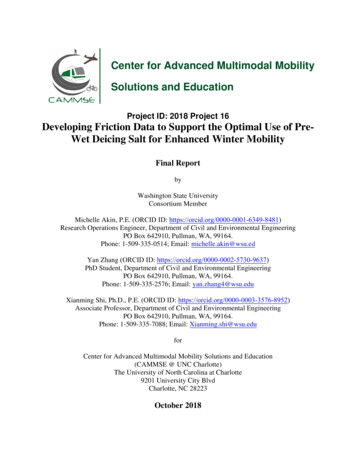
PresentationlaptopAudience screenCamerat ec raniK meCaAudience screenPresentation screenRoom separatorExperimenterPresentation areaFigure 3: Study room setup.dience was configured according to one of the three feedback conditions presented in the previous section, that is theuse of an interactive virtual audience (IVA), direct visualfeedback (DF), and non-interactive virtual audience (NonIVA). The condition was randomly assigned to participants,and a Wizard of Oz setup was used: unbeknownst to theparticipants, a confederate was watching their presentationremotely, and pressed a button when they were uttering apause filler or looking away. This allowed us to providethe virtual audience with real-time information about thespeaker’s performance on the trained behavior After the lastpresentation, participants completed questionnaires abouttheir experience (cf. section 2.4.1.), were debriefed, paid,and escorted out.2.3.Participants and DatasetParticipants were native English speakers of the LosAngeles area recruited from the classified ads websiteCraigslist3 . In total, 47 people participated (29 M, 18 F)with an average age of 37 years (SD 12.05). Tworecordings had technical problems leaving a total of 45 participants, with 15 participants assigned to the control condition, 14 to the direct feedback condition, and 16 to the interactive virtual audience condition. Thus, our multimodalcorpus constitutes a collection of 180 public speaking presentations. On average the pre-training presentations lastedfor 3:57 minutes (SD 1:56 minutes) and the post-trainingpresentation 3:54 minutes (SD 2:17 minutes) respectively,with no significant difference in presentation length.For each presentation, the participants were recorded witha headset microphone, a Microsoft Kinect capturing thewhole scene and two webcams positioned at different angles zoomed on the participant’s upper body. Figure 3 provides an overview of the placement of the sensors.2.4.MeasuresIn addition to the raw audio-visual and depth data recordedby our sensors, our corpus contains measures obtained fromparticipants’ questionnaires, expert assessments, manualannotation and automatic multimodal behavior assessment.2.4.1. Participant QuestionnairesAll participants completed questionnaires before the pretraining presentation: a demographics questionnaire, the‘Big Five Inventory’ personality questionnaire (Rammstedtand John, 2007) and the ‘Personal Report of Confidence asa Speaker (PRCS)’ questionnaire (Paul, 1966), used to estimate public speaking anxiety (Hook et al., 2008). After thelast presentation, participants completed a self assessmentquestionnaire, the ‘Positive and Negative Affect Schedule’questionnaire (Crawford and Henry, 2004), and the immersive experience questionnaire (Jennett et al., 2008).2.4.2. Expert AssessmentsTo compare the pre- with the post-training presentations,three experts of the Toastmasters organization evaluatedwhether participants improved their public speaking skillsafter training. They were presented the pre- and posttraining videos alongside for direct comparison. Each videoshowed both the participant’s upper body as well as facialexpressions (cf. Figure 1 (C)). The position of the preand post-training video, i.e. left or right, was randomizedfor each pair, as well as the order of participants. Additionally, experts were unaware of the participant’s trainingcondition. They assessed whether 10 performance aspects- derived from prior work on public speaking assessment(Schreiber et al., 2012; Batrinca et al., 2013; Scherer etal., 2012; Rosenberg and Hirschberg, 2005) and rated on7-point Likert scales - applied more to the pre- or posttraining presentation, allowing us to evaluate whether theparticipants’ skill improved or not after training4 :1. Eye Contact6. Confidence Level2. Body Posture7. Stage Usage3. Flow of Speech8. Avoids pause fillers4. Gesture Usage9. Presentation Structure5. Intonation10. Overall Performance2.4.3. Objective MeasuresTo complement the expert ratings, two annotators manually marked periods of eye contact with the audience andthe occurrence of pause fillers using the annotation toolELAN (Sloetjes and Wittenburg, 2008). We observed highinter-rater agreement for a randomly selected subset of fourvideos that both annotators assessed: Krippendorff α foreye contact is α 0.751 and pause fillers α 0.957 respectively (α computed on a frame-wise basis at 30 Hz).2.4.4. Automatic Acoustic Behavior AssessmentWe used the freely available COVAREP toolbox, a collaborative speech analysis repository (Degottex et al., 2014),to automatically extract audio features. COVAREP provides an extensive selection of open-source robust andtested speech processing algorithms enabling comparativeand cooperative research within the speech community. Allthe following acoustic features are masked with voicedunvoiced (VUV) (Drugman and Alwan, 2011), which determines whether the participant is voicing, i.e. the vocalfolds are vibrating. After masking, we use the average andthe standard deviation of the temporal information of ourfeatures. Not affected by this masking is VUV itself, i.e.the average of VUV is used as an estimation of the ratio ofspeech to pauses. Using COVAREP, we extracted the following acoustic features: the maxima dispersion quotient43http://www.craigslist.org/Aspect definitions and an online version of the questionnaireare available: http://tinyurl.com/ovtp67x490
(MDQ) (Kane and Gobl, 2013), peak slope (PS) (Kane andGobl, 2011), normalized amplitude quotient (NAQ) (Alkuet al., 2002), the amplitude difference betzeen the firsttwo harmonics of the differentiated glottal source spectrum (H1H2) (Titze and Sundberg, 1992), and the estimation of the Rd shape parameter of the Liljencrants-Fantglottal model (RD) (Gobl and Chasaide, 2003). Besidethese features we also extracted the fundamental frequency(f0) (Drugman and Alwan, 2011) and the first two KARMAfiltered formants (F1, F2) (Mehta et al., 2011). Additionally, we extracted the first four Mel-frequency cepstral coefficients (MFCC 0 - 3) and the voice intensity in dB.2.4.5. Automatic Visual Behavior AssessmentGestures were measured by the change of upper bodyjoints’ angles obtained from the Microsoft Kinect: wesummed the differences in angles from the shoulder, elbow, hand, and wrist joints, and compared them to manually annotated gestures from 20 presentations to automatically detect gesture occurrences. We evaluated eye contactwith the audience using two eye gaze estimations from theOKAO (Lao and Kawade, 2005) and CLNF (Baltrusaitis etal., 2013) softwares. We also extracted the audience eyecontact ratio relative to the length of the presentation as afeature. Emotions, such as anger, sadness, and contempt,were extracted with FACET5 . After applying the confidenceprovided by FACET, we extracted the mean of the emotions’ intensity as another set of features.3.Corpus Use CasesIn this section, we present these 3 studies to demonstratethe breadth of investigations on public speaking that are enabled by our multimodal corpus. Our multimodal corpuswas originally created to evaluate the potential of our interactive virtual audience system for training and the impactof different feedback strategies on training efficacy: wepresent this study in section 3.1. We realized two additionalstudies using the corpus: the first one investigated the automatic assessment of public speaking ability is presented insection 3.2. The second one was focused on the automaticassessment of public speaking anxiety, and is presented insection 3.3.3.1.Evaluation of Virtual Audience FeedbackStrategiesOur original research goal was to investigate if virtual audiences can be beneficial for improving public speaking performance, and which feedback strategy provides the bestimprovement (Chollet et al., 2015). To that end, we had experts assess whether the study participants’s performanceon 10 behavioral categories (cf. section 2.4.2.) was betterbefore training or after training with our virtual audienceBy comparing the performances of pre- and post-trainingpresentations, we can compensate for both the presenters’level of expertise and the experts’ critical opinion. Additionally, the experts were blind to the condition in whichthe participants had trained.We observe that overall, all the considered performanceaspects improved across all training conditions, -IVADFIVAEye ContactBody PostureFlow of SpeechGesture UsageIntonationConfidence LevelStage UsageAvoids pause fillersPresentation StructureOverall Performance0.40 (1.37)0.29 (1.12)0.16 (1.33)0.42 (1.39)0.29 (1.38)0.33 (1.49)0.42 (1.25)0.47 (1.01)0.22 (1.35)0.49 (1.42)0.02 (1.32)0.00 (1.13)0.17 (1.25)0.26 (1.15)-0.02 (1.09)0.05 (1.45)-0.12 (0.99)-0.07 (0.84)0.17 (1.38)0.05 (1.45)0.27 (1.27)0.19 (1.12)0.40 (1.30)0.33 (1.24)0.50 (1.35)0.44 (1.58)0.40 (0.89)0.35 (0.76)0.42 (1.15)0.60 (1.32)Combined Aspects0.35 (1.05)0.05 (0.89)0.39 (0.83)Table 1: Expert Assessments. Mean values and standard deviation (in brackets) for all aspects for all threeconditions, namely non-interactive virtual audience (NonIVA), direct feedback (DF), and interactive virtual audience(IVA).the effect is only moderate. The overall performance improvement was the strongest for the interactive virtual audience condition. The effect is approaching significancewith p 0.059 when compared to the direct feedback condition. When comparing all the assessed aspects together,the interactive virtual audience (µ 0.39, σ 0.83;t(298) 0.86, p 0.001, g 0.395) and control conditions (µ 0.35, σ 1.05; t(288) 0.98, p 0.010,g 0.305) both lead to statistically significantly better expert ratings than the direct feedback condition (cf. Table1).In addition, we found significant differences on some particular aspects across conditions: a significant differenceis observed for the stage usage aspect between conditions(F (2, 132) 3.627, p 0.029). Stage usage improvessignificantly more for the interactive virtual audience condition (µ 0.40; t(88) 0.94, p 0.011, g 0.543)and the control condition (µ 0.42; t(85) 1.13,p 0.029, g 0.473) respectively, when compared tothe direct feedback condition (µ 0.12). For the avoidspause fillers aspect a significant difference is observed between conditions (F (2, 132) 4.550, p 0.012). Participants improve significantly more on average in the interactive virtual audience condition (µ 0.35; t(88) 0.80,p 0.013, g 0.530) and control condition (µ 0.47;t(85) 0.93, p 0.009, g 0.572) respectively as assessed by experts, when compared to the improvement inthe direct feedback condition (µ 0.07).In conclusion, the system generally shows promise for improving presenters’ public speaking skills across all investigated aspects. It seems however that direct visual feedback performed poorly compared to the other conditions.This effect can be explained in a way that the additional visual stimuli (i.e. color coded gauges) proved to be moreof a distraction than a benefit for the participants. Thisfinding is in line with prior findings in related work whereresearchers found that users’ preferred sparse direct visualfeedback that is only available at some instances during apresentation rather than continuously (Tanveer et al., 2015).The interactive virtual audience condition producing nonverbal feedback was not significantly better than the control condition after the investigated minimal training of491
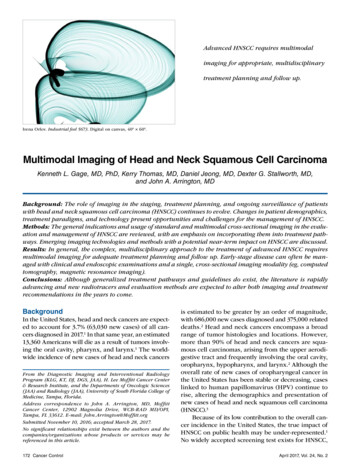
3.2.Automatic Assessment of Public SpeakingPerformanceIn order to study how to automatically evaluate a publicspeaking performance, we conducted extensive unimodaland multimodal experiments and investigated regressionensemble trees to automatically predict the experts’ assessments on the ten behavioral aspects presented in section2.4. with automatically extracted audiovisual features. Fulldetails can be found in (Wörtwein et al., 2015a). For instance, the expert assessed overall performance correlateswith showing less contempt facial expressions (r(43) 0.32, p 0.030) and the following acoustic features:a decrease of the standard deviation of VUV (r(43) 0.46, p 0.002), a decrease of the standard deviation of H1H2 (r(43) 0.31, p 0.039), an increasein PS’ standard deviation (r(43) 0.36, p 0.015),and a decrease of the bandwidth from the second formant(r(43) 0.30, p 0.042). Figure 4 summarizes theobserved correlation performance of our automatic performance assessment ensemble trees. We observe that multimodal features consistently outperform unimodal featuresets. In particular, complex behavioral assessments suchas the overall performance and confidence of the speakerbenefit from features of multiple modalities. Out of the single modalities the acoustic information seems to be mostpromising for the assessment of performance improvement.However, we are confident that with the development ofmore complex and tailored visual features similar successcan be achieved.When compared to a baseline (the mean over all expert ratings for every aspect and all participants as a constant), theensemble tree regression approach significantly improvesbaseline assessment for several aspects including overallperformance: the prediction errors (µ 0.55, σ 0.42)are consistently lower compared to the baseline errors(µ 0.74, σ 0.57) and significantly better (t(898) 0.50, p 0.001, g 0.372) across all aspects. Additionally, for overall performance alone the automatic assessment (µ 0.57, σ 0.46) is also significantly betterthan the baseline (µ 0.88, σ 0.61; t(88) 0.54, p 0.008, g 0.566). For a full comparison of all aspectsbetween our prediction errors and the constant predictionerrors see (Wörtwein et al., 2015a).Ensemble trees enable us to investigate the selected featuresthat achieve optimal regression results, and thus investigatebehavioral characteristics of public speaking performanceimprovement in detail. For the overall performance estimation, the multimodal ensemble tree selected negative facialexpressions, pause to speech ratio, average second and thirdformants, as well as the second formant’s bandwidth. ThisVisualAcoustic Visual AcousticEye contact.431.503.559Body Posture.376.612.540Flow of Speech.463.636.645Gesture 505.554.653Stage Usage.538.636.779Pause Fillers.444.691.691Presentation Structure.358.668.670Overall Performance.493.686.745.8Correlationonly two short presentations. However, we found usingparticipants’ questionnaires that the interactive virtual audience was perceived as more engaging (µIV A 4.50,µN on IV A 3.44; t(30) 0.86, p 0.001, g 1.211)and challenging (µIV A 2.94, µN on IV A 2.00;t(28) 1.02, p 0.025, g 0.801) than the controlcondition, which could prove pivotal in the long run andkeep the learner engaged and present a more challengingtask.3Figure 4: Color coded visualization of the Pearson correlation between the expert assessments of all evaluated aspectsand the automatic prediction using both single modalitiesand both combined.shows the importance of both nonverbal and vocal characteristics for the assessment of performance improvement.Overall the ensemble trees’ output is correlated with the experts’ assessment at r 0.7, which is a considerably highcorrelation and a very promising result.3.3.Prediction of Public Speaking AnxietyIn a third study, we tested whether it is possible to automatically assess public speaking anxiety with acoustic andvisual features. Full details can be found in (Wörtweinet al., 2015b). First, we investigated which features correlated the most with the PRCS anxiety score. The mostcorrelated feature from the acoustic features is the vocalexpressivity measured by the standard deviation of the firstformant: ARMA-filtered (r(43) 0.30, p 0.05),KARMA-filtered (r(43) 0.41, p 0.01). Additionally, the standard deviation of MFCC0 negatively correlates with the PRCS anxiety score (r(43) 0.36,p 0.05). Lastly, the pause time estimated by the ratio ofunvoiced phonemes and voicing correlates positively withthe anxiety score (r(43) 0.35, p 0.05). For the visual features, FACET’s average facial fear expression intensity significantly correlates with the PRCS anxiety score(r(43) 0.41, p 0.01). Furthermore, both automaticallyextracted eye contact scores and the annotated eye contactscore negatively correlate with the PRCS anxiety score: eyecontact score based on CLNF (r(43) 0.41, p 0.01),based on OKAO (r(43) 0.54, p 0.001), and the annotated eye contact score (r(43) 0.32, p 0.05).We then tried to automatically predict the PRCS anxietyscore using a regression approach. We used the samemethod for this as for automatic performance assessment,regression ensemble trees. Regression trees were trainedfor unimodal audio and visual feature sets and for themultimodal features together. We found that using bothacoustic and visual features (r 0.825, M AE 0.118)increased performance compared to using visual featuresonly (r 0.640, M AE 0.154) or audio features only(r 0.653, M AE 0.148) both with respect to meanabsolute error (M AE) and Pearson’s correlation. The features selected by the multimodal regression ensemble treeare comprised of closely related features such as express-492
10.30.20.60.40.1absolute errorPRCS anxiety score0.80.2000.20.40.6predicted PRCS anxiety score0.810Figure 5: Scatter plot of the predicted PRCS anxiety scoreagainst its ground truth.ing sadness, being more quiet, speaking at a slower pace,gesturing less, and a lack of orientation towards to the audience.In addition to comparisons between modalities, we compared our automatic assessment errors with the error ofa constant mean prediction. Our multimodal prediction(µ 0.12, σ 0.09) is significantly more accurate thanthe constant prediction (µ 0.21, σ 0.14; t(88) 0.11, p 0.001, g 0.840). Figure 5 shows a scatterplot of the ground truth against the predicted anxiety withboth modalities.4.Future Research DirectionsOur current work is focused on overhauling the system intoa fully automatic public speaking training framework. Inthe study we presented, the assessment of participants’ behavior during training was done by a confederate using awizard of Oz paradigm. In the future, the assessment of participants’ performance will be done automatically by machine learning trained on our multimodal corpus, using audiovisual features extracted in real-time. Additionally, ourvirtual audience is being improved: more varied charactermodels have been introduced and more animations and behaviors are being added to allow the audience to displayvarious states such as boredom, engagement or disagreement (cf. Figure 6). We plan to use the new system to investigate how training with it improves public speaking abilityover time. We will perform a longitudinal study in whichparticipants will train several times over a few weeks, andthen be evaluated in an actual public speaking presentationin front of the other participants. This will allow us to measure if training with a virtual audience transfers into improvement of public speaking ability in real situations.Additionally, this multimodal corpus will be growing as weperform more studies related to studying public speaking.We present here current extension work on the corpus.4.1.Non-native English Speakers DatasetPerforming a public speaking task is more challenging ina foreign language than in one’s mother tongue. We areinterested in studying how this impacts the different behavioral aspects of public speaking, and whether our interactivevirtual audience system can also help no
of public speaking ability, the training of public speaking skills and the reduction of public speaking anxiety. Multimodal interaction technologies (e.g. social signals processing, virtual humans) have been deployed in many types of social skills training applications, from job inter-vie