Transcription
Center for Advanced Multimodal MobilitySolutions and EducationProject ID: 2018 Project 16Developing Friction Data to Support the Optimal Use of PreWet Deicing Salt for Enhanced Winter MobilityFinal ReportbyWashington State UniversityConsortium MemberMichelle Akin, P.E. (ORCID ID: https://orcid.org/0000-0001-6349-8481)Research Operations Engineer, Department of Civil and Environmental EngineeringPO Box 642910, Pullman, WA, 99164.Phone: 1-509-335-0514; Email: michelle.akin@wsu.edYan Zhang (ORCID ID: https://orcid.org/0000-0002-5730-9637)PhD Student, Department of Civil and Environmental EngineeringPO Box 642910, Pullman, WA, 99164.Phone: 1-509-335-2576; Email: yan.zhang4@wsu.eduXianming Shi, Ph.D., P.E. (ORCID ID: https://orcid.org/0000-0003-3576-8952)Associate Professor, Department of Civil and Environmental EngineeringPO Box 642910, Pullman, WA, 99164.Phone: 1-509-335-7088; Email: Xianming.shi@wsu.eduforCenter for Advanced Multimodal Mobility Solutions and Education(CAMMSE @ UNC Charlotte)The University of North Carolina at Charlotte9201 University City BlvdCharlotte, NC 28223October 2018
ii
ACKNOWLEDGEMENTSThis project was funded by the Center for Advanced Multimodal Mobility Solutions and Education(CAMMSE @ UNC Charlotte), one of the Tier I University Transportation Centers that wereselected in this nationwide competition, by the Office of the Assistant Secretary for Research andTechnology (OST-R), U.S. Department of Transportation (US DOT), under the FAST Act. Theauthors are also very grateful for all of the time and effort spent by DOT and industry professionalsto provide project information that was critical for the successful completion of this study. Theauthors also want to commend and thank the research assistance provided by Lathan Card inrunning the ice melting tests and Mehdi Honarvar Nazari for developing and making the concordgrade-modified salt brine additive.DISCLAIMERThe contents of this report reflect the views of the authors, who are solely responsible for the factsand the accuracy of the material and information presented herein. This document is disseminatedunder the sponsorship of the U.S. Department of Transportation University Transportation CentersProgram and Washington State University in the interest of information exchange. The U.S.Government and Washington State University assumes no liability for the contents or use thereof.The contents do not necessarily reflect the official views of the U.S. Government and WashingtonState University. This report does not constitute a standard, specification, or regulation.iii
iv
Table of ContentsEXCUTIVE SUMMARY .xChapter 1. Introduction.11.1 Problem Statement .11.2 Objectives .11.3 Contributions.21.4 Report Overview .2Chapter 2. Synthesis of Literature .32.1 Introduction .32.2 Benefits of Pre-Wetting .32.3 Pre-Wetting Equipment .32.4 Pre-Wetting Laboratory and Field Studies .42.5 Summary .7Chapter 3. Survey of Pacific Northwest States .83.1 Introduction .83.2 Pre-Wetting Materials .83.3 Pre-Wetting Application Rates .93.4 Summary .11Chapter 4. Laboratory Testing .124.1 Introduction .124.2 Ice Melting Tests.124.3 Snow–Traffic–Plowing–Friction Tests .15Chapter 5. Recommended FOTs .175.1 Introduction .173.1.1.3.1.2.3.1.3.FOT Parameters . 17Pavements and Road Classification . 17Data to be Collected . 185.2 Summary .19Chapter 6. Conclusions and Recommendations.206.1 Introduction .206.2 Summary and Conclusions .206.3 Directions for Future Research .20References .21v
Appendix A: Survey Questionnaire .23vi
List of FiguresFigure 1: US areas affected by snow and ice (FHWA 2017) . 2Figure 2: An on-board pre-wetting system (right) and Zero Velocity Dispensing Unit(left);. . 4Figure 3: Number of survey responses from each state . 8Figure 4: Pre-wetting liquid-to-solid application rates reported by respondents. . 9Figure 5: Grain size distribution of air-dried WSDOT solid salt. 13Figure 6: Ice melting test results at 25 F for 1,000 lb/LM application at 8 gal/ton (left)and 16 gal/ton (right) . 14Figure 7: Ice melting test results at 25 F for 2,000 lb/LM application at 8 gal/ton (left)and 16 gal/ton (right) . 14Figure 8: Ice melting test results at 15 F for 2,000 lb/LM application at 8 gal/ton (left)and 16 gal/ton (right) . 14Figure 9: Summary of all ice melting test results with 1 standard deviation . 15Figure 10: Sequence of steps during snow-traffic-plowing-friction tests. . 16Figure 11: . Friction and snow–pavement bond for pavement #3; NaCl, Beet and Grapewith 16 gal/ton prewet rate . 16Figure 12:: A possible Materials Application Grid for the FOTs of pre-wetting operations . 18vii
viii
List of TablesTable 1: Summary of Pre-Wetting Laboratory Tests . 5Table 2: Summary of Field Pre-Wetting Studies . 6Table 3: Responses to Pre-wetted Material Road Application Rates (typos correctedwithout notation) . 9Table 4: Salt Samples for Ice Melting Tests . 13Figure 1: US areas affected by snow and ice (FHWA 2017) . 2Figure 2: An on-board pre-wetting system (right) and Zero Velocity Dispensing Unit(left);. . 4Table 1: Summary of Pre-Wetting Laboratory Tests . 5Table 2: Summary of Field Pre-Wetting Studies . 6Figure 3: Number of survey responses from each state . 8Figure 4: Pre-wetting liquid-to-solid application rates reported by respondents. . 9Table 3: Responses to Pre-wetted Material Road Application Rates (typos correctedwithout notation) . 9Table 4: Salt Samples for Ice Melting Tests . 13Figure 5: Grain size distribution of air-dried WSDOT solid salt. 13Figure 6: Ice melting test results at 25 F for 1,000 lb/LM application at 8 gal/ton (left)and 16 gal/ton (right) . 14Figure 7: Ice melting test results at 25 F for 2,000 lb/LM application at 8 gal/ton (left)and 16 gal/ton (right) . 14Figure 8: Ice melting test results at 15 F for 2,000 lb/LM application at 8 gal/ton (left)and 16 gal/ton (right) . 14Figure 9: Summary of all ice melting test results with 1 standard deviation . 15Figure 10: Sequence of steps during snow-traffic-plowing-friction tests. . 16Figure 11: . Friction and snow–pavement bond for pavement #3; NaCl, Beet and Grapewith 16 gal/ton prewet rate . 16Figure 12:: A possible Materials Application Grid for the FOTs of pre-wetting operations . 18ix
EXCUTIVE SUMMARYApplying prewet deicers during winter storms is a cost-effective strategy to improve deicerperformance. Prewet deicers have a small amount of liquid product applied to solid salt orsalt/sand which helps activate the ice melting and penetration and significantly reduces bounceand scatter. Prewetting keeps the product on the road and improves the ability of plows to removedcompacted snow and ice. While many agencies use prewet deicers, there is not enough reliabledata to determine optimal prewetting rates or product type.This research presents the results of an in-depth survey of the pacific northwest (Oregon,Washington, Alaska and Idaho) on prewetting practices and laboratory tests that quantified the icemelting, frictional behavior and reduction in snow–pavement bond strength of salt prewet withvarious liquid deicers and prewetting rates. Ice melting tests are an accepted method to gaugebasic chemical performance, but do not adequately predict field performance. More sophisticatedlaboratory tests on asphalt pavement with realistic snow and representative trafficking motion andforces were conducted. Whereas ice melting tests require unrealistically high application rates(over 1000 pounds per lane mile (lb/lm)), the snow/traffic/friction tests were conducted withreasonable application rates (250 lb/lm).For the ice melting tests, pre-wetted salt worked better than dry salt at 1,000 lb/LM at 25 F and2,000 lb/LM at 15 F. The biggest different observed between the types of liquid used for prewetting were at 25 F 1,000 lb/LM tests. At the colder temperature of 15 F the pre-wetting liquidsworked similarly and each better than dry salt. Considering all temperatures and application ratesthe ranked order of liquids from best to worst are: CaCl2, Grape blend, Beet blend, 23% NaCl,MgCl2. For the snow–traffic–plowing–friction tests, pre-wetting reduced the snow–pavementbond compared to dry salt and control tests (no deicer application). The highest friction afterplowing was observed with the dry salt test, although this experiment did not mimic the bounceand scatter that would be expected during application by material spreaders. The best-performingpre-wetting liquid with respect to friction was NaCl and with respect to snow–pavement bond wasbeet-modified salt brine.The laboratory tests confirmed that pre-wetting liquid-to-solid application rates in the range of8–16 gal/ton are reasonable for increasing the speed and total ice melting capacity of solid salt.Furthermore, prewetting significantly reduces the snow–pavement bond, but does not seem toincrease friction more than dry salt. One key limitation of the laboratory tests conducted wasthat bounce and scatter from realistic application speeds was not included. Thus field tests arecritical for expanding the knowledge and identifying specific best practices of pre-wetting.Specific road types and data that should be collected during field operational tests are provided.x
xi
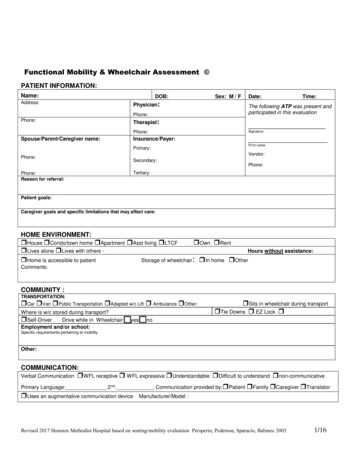
Chapter 1. Introduction1.1 Problem StatementResearch is currently lacking for agencies to understand the influence of pre-wetting product type,pre-wetting ratio, and application rate of pre-wet deicing salt on the friction performance of deicedasphalt pavements. Deicing salts are often selected by DOTs and municipalities as essential toolsfor maintaining roads during winter conditions because of their ability to break the bond ofsnow/ice to pavement and effectively restore a safe driving surface. The relative performance ofthe many products available on the market is a key factor in selection. Salt (sodium chloride),commonly understood to be the most affordable deicer, can exhibit significant improvement bypre-wetting with deicer solutions which are more powerful freezing point depressants. Pre-wettingrefers to the application of liquid products, such as brines, to solid material (primarily salt,abrasives or a combination of these) at the truck just before the pre-wet material hits the road. Prewetting, in combination with optimal vehicle speeds, reduces the bounce and scatter loss thatcauses dry material to disperse beyond its desired location. Pre-wetting can also help activate theice melting, penetration and undercutting mechanisms that help break up snowpack for subsequentmechanical removal. However, limited data is available to support the optimal use of pre-wetdeicing salts for enhanced winter mobility under various road weather scenarios.While field tests would provide the most realistic environment with proper scale andconcentration considerations, they are more expensive and fail to provide highly reproduciblecombinations of air/pavement temperatures, snow precipitation, solar radiation, etc. As such,groundwork in the laboratory (well-controlled conditions) is needed to support the decisionsrelated to the practices of pre-wetting salt and subsequent deicing. Currently only a few standardlaboratory tests for deicers are available, and the most widely known are the three testsdeveloped during the Strategic Highway Research Program (SHRP) and published in theHandbook of Test Methods for Evaluating Chemical Deicers (Chappelow et al. 1992). Theseperformance-based tests measure ice melting, penetration and undercutting of deicers, all ofwhich are limited by the use of small sample size, the lack of control in humidity and ultravioletlight, and the absence of traffic.1.2 ObjectivesThe objectives of this CAMMSE project are: (1) to investigate in the laboratory the effects ofpre-wetting product type, pre-wetting ratio, and application rate of pre-wet deicing salt on thefriction performance of deiced asphalt pavement under typical weather conditions in the PacificNorthwest region; and (2) to develop a plan for field operational tests (FOTs) designed tovalidate or calibrate the laboratory findings and to guide the appropriate use of pre- wet deicingsalt for enhanced winter movements of passengers and freight. This scope is directly relevant tothe CAMMSE theme of “Developing Data Modeling and Analytical Tools to OptimizePassenger and Freight Movements”. The Federal Highway Administration (FHWA) hasestimated that “over 70 percent of the nation’s roads are located in snowy regions and nearly70 percent of the U.S. population lives in these regions” (Figure 1).1
Figure 1: US areas affected by snow and ice (FHWA 2017)1.3 ContributionsTo accomplish these objectives, several tasks have been undertaken.Task 1: Planning for the laboratory investigation—a literature review and survey ofPacific Northwest states’ winter maintenance practitioners were conducted. The survey wasdistributed within the states of Washington, Idaho, Oregon and Alaska to assess this region’s prewetting practices, insights and experiences. Specific information sought included type of solidand liquid pre-wetting products commonly used, the typical range of pre-wetting ratio (liquiddeicer to solid salt), the typical application rates or guidelines for application rates of pre-wetdeicing salts, and the typical road weather scenarios of interest to the snow/ice controlpractitioners in the region. Success stories or lessons learned was also requested.Task 2: Laboratory investigation—Two types of laboratory tests were conducted 1) icemelting tests and 2) snow–pavement bond and friction tests with snow and traffic simulation.The ice melting tests included multiple pre-wet liquids, pre-wet application rates andtemperatures to narrow down the pre-wetting tests conducted with more realistic winter stormparameters. More sophisticated laboratory tests were conducted with select pre-wetting liquidsand pre-wetting ratios using asphalt pavement samples, snow and traffic to measure the effect ofpre-wetting on the snow–pavement bond and friction of the plowed pavement.Task 3: Data analysis and design of FOTs—Comparative and statistical analyses wereconducted and potential correlations between the two types of laboratory tests were explored.The desi
This project was funded by the Center for Advanced Multimodal Mobility Solutions and Education (CAMMSE @ UNC Charlotte), one of the Tier I University Transportation Centers that were . data to determine optimal prewetting rates or product type. This research presents the result