Transcription
Introduction toDifferential CalculusChristopher ThomasMathematics Learning CentreUniversity of SydneyNSW 2006c 1997University of Sydney
AcknowledgementsSome parts of this booklet appeared in a similar form in the booklet Review of Differentiation Techniques published by the Mathematics Learning Centre.I should like to thank Mary Barnes, Jackie Nicholas and Collin Phillips for their helpfulcomments.Christopher ThomasDecember 1996
Contents1 Introduction1.11.21An example of a rate of change: velocity . . . . . . . . . . . . . . . . . . .11.1.1Constant velocity . . . . . . . . . . . . . . . . . . . . . . . . . . . .11.1.2Non-constant velocity . . . . . . . . . . . . . . . . . . . . . . . . . .3Other rates of change . . . . . . . . . . . . . . . . . . . . . . . . . . . . .42 What is the derivative?62.1Tangents . . . . . . . . . . . . . . . . . . . . . . . . . . . . . . . . . . . . .62.2The derivative: the slope of a tangent to a graph7. . . . . . . . . . . . . .3 How do we find derivatives (in practice)?93.1Derivatives of constant functions and powers . . . . . . . . . . . . . . . . .3.2Adding, subtracting, and multiplying by a constant . . . . . . . . . . . . . 123.3The product rule . . . . . . . . . . . . . . . . . . . . . . . . . . . . . . . . 133.4The Quotient Rule . . . . . . . . . . . . . . . . . . . . . . . . . . . . . . . 143.5The composite function rule (also known as the chain rule) . . . . . . . . . 153.6Derivatives of exponential and logarithmic functions . . . . . . . . . . . . . 183.7Derivatives of trigonometric functions . . . . . . . . . . . . . . . . . . . . . 214 What is differential calculus used for?9244.1Introduction . . . . . . . . . . . . . . . . . . . . . . . . . . . . . . . . . . . 244.2Optimisation problems . . . . . . . . . . . . . . . . . . . . . . . . . . . . . 244.2.1Stationary points - the idea behind optimisation . . . . . . . . . . . 244.2.2Types of stationary points . . . . . . . . . . . . . . . . . . . . . . . 254.2.3Optimisation . . . . . . . . . . . . . . . . . . . . . . . . . . . . . . 285 The clever idea behind differential calculus (also known as differentiationfrom first principles)316 Solutions to exercises35
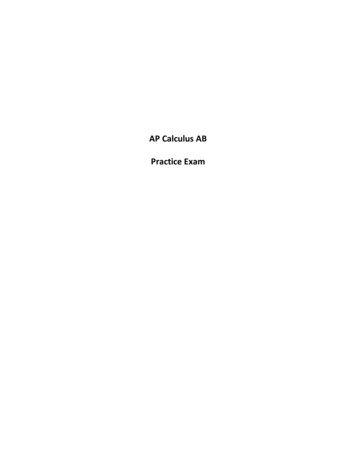
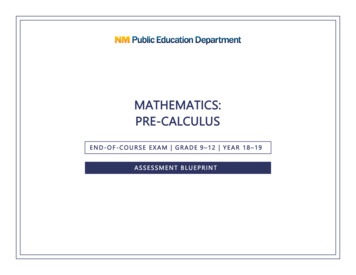
1Mathematics Learning Centre, University of Sydney1IntroductionIn day to day life we are often interested in the extent to which a change in one quantityaffects a change in another related quantity. This is called a rate of change. For example,if you own a motor car you might be interested in how much a change in the amount offuel used affects how far you have travelled. This rate of change is called fuel consumption.If your car has high fuel consumption then a large change in the amount of fuel in yourtank is accompanied by a small change in the distance you have travelled. Sprinters areinterested in how a change in time is related to a change in their position. This rateof change is called velocity. Other rates of change may not have special names like fuelconsumption or velocity, but are nonetheless important. For example, an agronomistmight be interested in the extent to which a change in the amount of fertiliser used on aparticular crop affects the yield of the crop. Economists want to know how a change inthe price of a product affects the demand for that product.Differential calculus is about describing in a precise fashion the ways in which relatedquantities change.To proceed with this booklet you will need to be familiar with the concept of the slope(also called the gradient) of a straight line. You may need to revise this concept beforecontinuing.1.11.1.1An example of a rate of change: velocityConstant velocityFigure 1 shows the graph of part of a motorist’s journey along a straight road. Thevertical axis represents the distance of the motorist from some fixed reference point onthe road, which could for example be the motorist’s home. Time is represented along thehorizontal axis and is measured from some convenient instant (for example the instant anobserver starts a stopwatch).Di stance(metres)3002001002.004.006.008.00t ime (seconds)Figure 1: Distance versus time graph for a motorist’s journey.
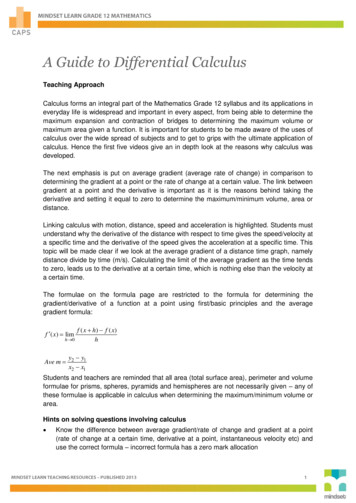
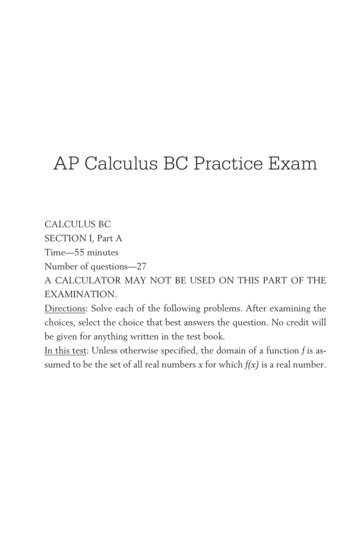
Mathematics Learning Centre, University of Sydney2Exercise 1.1How far is the motorist in Figure 1 away from home at time t 0 and at time t 6?Exercise 1.2How far does the motorist travel in the first two seconds (ie from time t 0 to time t 2)?How far does the motorist travel in the two second interval from time t 3 to t 5? How fardo you think the motorist would travel in any two second interval of time?The shape of the graph in Figure 1 tells us something special about the type of motionthat the motorist is undergoing. The fact that the graph is a straight line tells us that themotorist is travelling at a constant velocity. At a constant velocity equal increments in time result in equal changes in distance. For a straight line graph equal increments in the horizontal direction result in thesame change in the vertical direction.In Exercise 1.2 for example, you should have found that in the first two seconds themotorist travels 50 metres and that the motorist also travels 50 metres in the two secondsbetween time t 3 and t 5.Because the graph is a straight line we know that the motorist is travelling at a constantvelocity. What is this velocity? How can we calculate it from the graph? Well, in thissituation, velocity is calculated by dividing distance travelled by the time taken to travelthat distance. At time t 6 the motorist was 250 metres from home and at time t 2the motorist was 150 metres away from home. The distance travelled over the four secondinterval from time t 2 to t 6 wasdistance travelled 250 150 100and the time taken wastime taken 6 2 4and so the velocity of the motorist isvelocity distance travelled250 150100 25 metres per second.time taken6 24But this is exactly how we would calculate the slope of the line in Figure 1. Take a lookat Figure 2 where the above calculation of velocity is shown diagramatically.The slope of a line is calculated by vertical rise divided by horizontal run and if we wereto use the two points (2, 150) and (6, 250) to calculate the slope we would getslope rise250 150 25.run6 2To summarise:The fact that the car is travelling at a constant velocity is reflected in the fact that thedistance-time graph is a straight line. The velocity of the car is given by the slope of thisline.
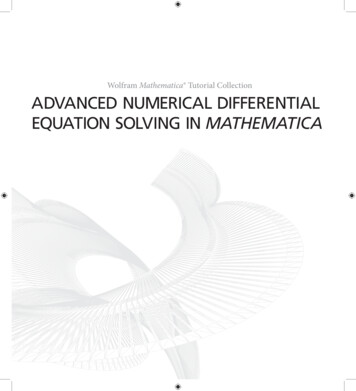
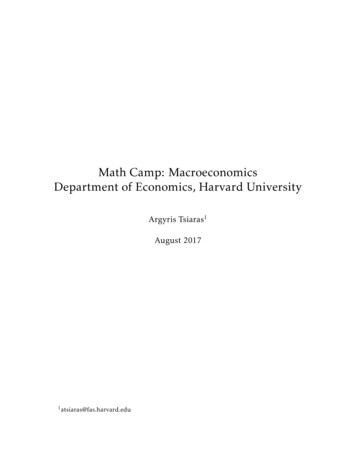
3Mathematics Learning Centre, University of SydneyDi stance(metres)300200250 - 150 1006 - 2 41002.004.006.008.00t ime (seconds)Figure 2: Calculation of the velocity of the motorist is the same as the calculation of the slopeof the distance - time graph.1.1.2Non-constant velocityFigure 3 shows the graph of a different motorist’s journey along a straight road. Thisgraph is not a straight line. The motorist is not travelling at a constant velocity.Exercise 1.3How far does the motorist travel in the two seconds from time t 60 to time t 62?How far does the motorist travel in the two second interval from time t 62 to t 64?Since the motorist travels at different velocities at different times, when we talk aboutthe velocity of the motorist in Figure 3 we need to specify the particular time that wemean. Nevertheless we would still like somehow to interpret the velocity of the motoristas the slope of the graph, even though the graph is curved and not a straight line.Distance in metres108010601040102059606162636465Time in secondsFigure 3: Position versus time graph for a motorist’s journey.
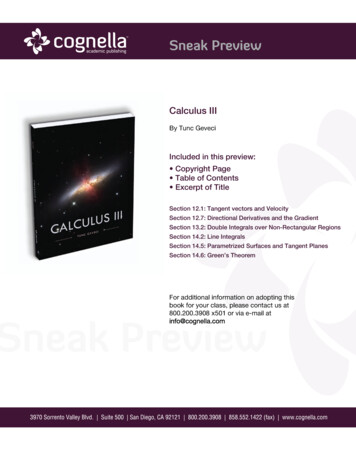
4Mathematics Learning Centre, University of SydneyWhat do we mean by the slope of a curve? Suppose for example that we are interestedin the velocity of the motorist in Figure 3 at time t 62. In Figure 3 we have drawn ina dashed line. Notice that this line just grazes the curve at the point on the curve wheret 62. The dashed line is in fact the tangent to the curve at that point. We will talkmore about tangents to curves in Section 2. For now you can think of the dashed linelike this: if you were going to draw a straight line through this point on the curve, and ifyou wanted that straight line to look as much like the curve near that point as it possiblycould, this is the line that you would draw. This solves our problem about interpretingthe slope of the curve at this point on the curve.The slope of the curve at the point on the curve where t 62 is the slope of the tangentto the curve at that point: that is the slope of the dashed line in Figure 3.The velocity of the motorist at time t 62 is the slope of the dashed line in that figure.Of course if we were interested in the velocity of the motorist at time t 64 then wewould draw the tangent to the curve at the point on the curve where t 64 and we wouldget a different slope. At different points on the curve we get different tangents havingdifferent slopes. At different times the motorist is travelling at different velocities.1.2Other rates of changeThe situation above described a car moving in one direction along a straight road awayfrom a fixed point. Here, the word velocity describes how the distance changes with time.Velocity is a rate of change. For these type of problems, the velocity corresponds to therate of change of distance with respect to time. Motion in general may not always be inone direction or in a straight line. In this case we need to use more complex techniques.Velocity is by no means the only rate of change that we might be interested in. Figure 4shows a graph representing the yield a farmer gets from a crop depending on the amountof fertiliser that the farmer uses.The shape of this graph makes good sense. If no fertiliser is used then there is still somecrop yield (50 tonnes to be precise). As more fertiliser is used the crop yield increases,Crop Yield (Tonnes )200slope 50s lope 2 5150100501423Fer ti l i ser Useage (Tonnes )Figure 4: Crop yield versus fertiliser useage for a hypothetical crop.
Mathematics Learning Centre, University of Sydney5as you would expect. Note though that at a certain point putting on more fertiliser doesnot improve the yield of the crop, but in fact decreases it. The soil is becoming poisonedby too much fertiliser. Eventually the use of too much fertiliser causes the crop to diealtogether and no yield is obtained.On the graph the tangents to the curve corresponding to fertiliser usage of 1 tonne (thedotted line) and of 1.5 tonnes (the dashed line) are drawn. The slope of these tangentsgive the rate of change of crop yield with respect to fertiliser usage.The slope of the dotted tangent is 50. This means that if fertiliser usage is increased from1 tonne by a very small amount then the crop yield will increase by 50 times that smallchange. For example an increase in fertiliser usage from 1 tonne (1000 kg) to 1005 kgwill increase the crop yield by approximately 50 5 250 kg. If we are using 1 tonneof fertiliser then the rate of change of crop yield with respect to fertiliser useage is quitehigh. On the other hand the slope of the dashed tangent is 25. The same increase (by 5kg) in fertiliser useage from 1500 kg (1.5 tonnes) to 1505 kg will increase the crop yieldby about 25 5 125 kg.
6Mathematics Learning Centre, University of Sydney2What is the derivative?If you are not completely comfortable with the concept of a function and its graph thenyou need to familiarise yourself with it before continuing. The booklet Functions publishedby the Mathematics Learning Centre may help you.In Section 1 we learnt that differential calculus is about finding the rates of change ofrelated quantities. We also found that a rate of change can be thought of as the slope ofa tangent to a graph of a function. Therefore we can also say that:Differential calculus is about finding the slope of a tangent to the graph of a function, orequivalently, differential calculus is about finding the rate of change of one quantity withrespect to another quantity.If we are going to go to all this trouble to find out about the slope of a tangent to a graph,we had better have a good idea of just what a tangent is.2.1TangentsLook at the curve and straight line in Figure 5.ABFigure 5: The line is tangent to the curve at point A but not at point B.Imagine taking a very powerful magnifying glass and looking very closely at this figure nearthe point A. Figure 6 shows two views of this curve at successively greater magnifications.The closer we look at the curve near the point A the straighter the curve appears to be.The more we zoom in the more the curve begins to look like the straight line. This straightline is called the tangent to the curve at the point A. If we want to draw a straight linethat most resembles the curve near the point A, the tangent line is the one that we woulddraw. It is pretty clear from Figure 5 that no matter how closely we look at the curvenear the point B the curve is never going to look like the straight line we have drawn inhere. That line is tangent to the curve at A but not at B. The curve does have a tangentat B, but it is not shown on Figure 5.Note that it is not necessarily true that the tangent line only cuts the curve at one pointor that curve lies entirely on one side of the line. These properties hold for some specialcurves like circles, but not for all curves, and certainly not for the one in Figure 5.
7Mathematics Learning Centre, University of SydneyAAFigure 6: Two close up views of the curve in Figure 5 near the point A. The closer we looknear the point A the more the curve looks like the tangent.2.2The derivative: the slope of a tangent to a graphTerminology The slope of the tangent at the point (x, f (x)) on the graph of f is calledthe derivative of f at x and is written f (x).Look at the graph of the function y f (x) in Figure 7. Three different tangent lines haveB (0.5, f (0.5))A ( 0.5, f ( 0.5))C (1.5, f (1.5)) 0.50.51.01.5xFigure 7: Tangent lines to the graph of f (x) drawn at three different points on the graph.been drawn on the graph, at A, B and C, corresponding to three different values of theindependent variable, x 0.5, x 0.5 and x 1.5.If we were to make careful measurements of the slopes of the three tangents shown wewould find that f ( 0.5) 2.75, f (0.5) 1.25 and f (1.5) 0.75. Here the symbol means ‘is approximately’. We can only say approximately here because there is noway that we can make completely accurate measurements from a graph, and no wayeven to draw a completely accurate graph. However this graphical approach to findingthe approximate derivative is often very useful, and in some situations may be the onlytechnique that we have.At different points on the graph we get different tangents having different slopes. Theslope of the tangent to the graph depends on where on the graph we draw the tangent.Because we can specify a point on the graph by just giving its x coordinate (the other
8Mathematics Learning Centre, University of Sydneycoordinate is then f (x)), we can say that the slope of the tangent to the graph of a functiondepends on the value of the independent variable x, or the value of f (x) depends on x.In other words, f is a function of x.Terminology The function f is called the derivative of f .Terminology The process of finding the derivative is called differentiation.The derivative of a a function f is another function, called f , which tells us about theslopes of tangents to the graph of f . Because there are several different ways of writingfunctions, there are several different ways of writing the derivative of a function. Most ofthe ways that are commonly used are expressed in the following table.Functionf (x)Derivativef (x) ordf (x)dxff ordfdxyy ordydxy(x)y (x) ordy(x)dxExercise 2.1 (You will find this exercise easier to do if you use graph paper.)Draw a careful graph of the function f (x) x2 . Draw the tangents at the points x 1,x 0 and x 0.5. Find the slopes of these lines by picking two points on them andusing the formulay2 y1slope .x2 x1These slopes are the (approximate) values of f (1), f (0) and f ( 0.5) respectively.Exercise 2.2Repeat Exercise 2.1 with the function f (x) x3 .
Mathematics Learning Centre, University of Sydney39How do we find derivatives (in practice)?Differential calculus is a procedure for finding the exact derivative directly from the formula of the function, without having to use graphical methods. In practise we use a fewrules that tell us how to find the derivative of almost any function that we are likely toencounter. In this section we will introduce these rules to you, show you what they meanand how to use them.Warning! To follow the rest of these notes you will need feel comfortable manipulatingexpressions containing indices. If you find that you need to revise this topic you may findthe Mathematics Learning Centre publication Exponents and Logarithms helpful.3.1Derivatives of constant functions and powersPerhaps the simplest functions in mathematics are the constant functions and the functions of the form xn .dk 0.Rule 1 If k is a constant thendxRule 2 If n is any number thend nx nxn 1 .dxRule 1 at least makes sense. The graph of a constant function is a horizontal line and ahorizontal line has slope zero. The derivative measures the slope of the tangent, and sothe derivative is zero.How you approach Rule 2 is up to you. You certainly need to know it and be able to useit. However we have given no justification for why Rule 2 works! In fact in these notes wewill give little justification for any of the rules of differentiation that are presented. Wewill show you how to apply these rules and what you can do with them, but we will notmake any attempt to prove any of them.Examples If f (x) x7 then f (x) 7x6 .If y x 0.5 thendydx 0.5x 1.5 .d 3x 3x 4 .dxIf g(x) 3.2 then g (x) 0.11If f (t) t 2 then f (t) 12 t 2 .If h(u) 13.29 then h (u) 0.
10Mathematics Learning Centre, University of SydneyIn the examples above we have used Rules 1 and 2 to calculate the derivatives of manysimple functions. However we must not lose sight of what it is that we are calculatinghere. The derivative gives the slope of the tangent to the graph of the function.For example, if f (x) x2 then f (x) 2x. To find the slope of the tangent to the graphof x2 at x 1 we substitute x 1 into the derivative. The slope is f (1) 2 1 2.Similarly the slope of the tangent to the graph of x2 at x 0.5 is found by substitutingx 0.5 into the derivative. The slope is f ( 0.5) 2 0.5 1. This is illustratedin Figure 8.3.002.00( 1, 1 )1.00( -0.5, 0.2 5 )slope f ' (1) 2slope f ' (-0.5) - 1-1.00-0.500.501.001.50Figure 8: Slopes of tangents to the graph of y x2 .ExampleFind the slope of the tangent to the graph of the function g(t) t4 at the point on thegraph where t 2.SolutionThe derivative is g (t) 4t3 , and so the slope of the tangent line at t 2 is g ( 2) 4 ( 2)3 32.Example1Find the equation of the line tangent to the graph of y f (x) x 2 at the point x 4.Solution1f (4) 4 2 derivative is 4 2, so the coordinates of the point on the graph are (4, 2). The1x 21f (x) 22 x and so the slope of the tangent line at x 4 is f (4) 14 . We therefore know the slope ofthe line and we know one point through which the line passes.Any non vertical line has equation of the form y mx b where m is the slope and b thevertical intercept.
11Mathematics Learning Centre, University of SydneyIn this case the slope is 14 , so m 14 , and the equation is y passes through the point (4, 2) we know that y 2 when x 4.Substituting we get 2 44x4 b. Because the line b, so that b 1. The equation is therefore y x4 1.Notice that in the examples above the independent variable is not always called x. Wehave also used u and t, and in fact we can and will use many different letters for theindependent variable. Notice also that we might not stick to the symbol f to standfor function. Many other symbols are used. Some of the common ones are g and h.Throughout this booklet we will use a variety of symbols for functions and variables toget you used to the fact that our choice of symbols makes no difference to the ideas thatwe are introducing. On the other hand, we can make life easier for ourselves if we makesensible choices of symbols. For example if we were discussing the revenue obtained bya manufacturer who sells articles for a certain price it might be sensible for us to choosethe symbol p to mean price, and r to mean revenue, and to write r(p) to express thefact that the revenue is a function of the price. In this way the symbols we have chosenremind us of their meaning, much more than if we had chosen x to represent price and fto represent revenue and written f (x). On the other hand, because the symbol d has a(x)special use in calculus, to express the derivative dfdx, we almost never use d for any otherpurpose. For this reason you will often see the letter s used to represent diSplacement.We now know how to differentiate any function that is a power of the variable. Examplesare functions like x3 and t 1.3 . You will come across functions that do not at first appearto be a power of the variable, but can be rewritten in this form. One of the simplestexamples is the function f (t) t,which can also be written in the form1f (t) t 2 .The derivative is then1t 21 .f (t) 22 t Similarly, ifh(s) 1 s 1sthenh (s) s 2 Examples111 4If f (x) x 3 then f (x) x 3 .3x331dy3 5If y x 2 then x 2 .x xdx21.s2
12Mathematics Learning Centre, University of SydneyExercises 3.1Differentiate the following functions:a.f (x) x41d. f (t) t 3g.y t 3.8b. y x 7c. f (u) u2.322e.f (t) t 73g(z) z 2f.3h. z x 7Exercise 3.2Express the following as powers and then differentiate: 1a.b. t tc. 3 x2x 1s3 s1 e.f.d.3x2 xx4xs 1xt1h. 2 i. x 2g.3uxt tExercise 3.3 Find the equation of the line tangent to the graph of y 3 x when x 8.3.2Adding, subtracting, and multiplying by a constantSo far we know how to differentiate powers of the independent variable. Many of thefunctions that you will encounter are made up in simple ways from powers. For example,a function like 3x2 is just a constant multiple of x2 . However neither Rule 1 nor Rule 2tell us how to differentiate 3x2 . Nor do they tell us how to differentiate something likex2 x3 or x2 x3 .Rules 3 and 4 specify how to differentiate combinations of functions that are formed bymultiplying by constants, or by adding or subtracting functions.Rule 3 If f (x) cg(x), where c is a constant, then f (x) cg (x).Rule 4 If f (x) g(x) h(x) then f (x) g (x) h (x).Examples If f (x) 3x2 then f (x) 3 d 2x 6x.dxIf g(t) 3t2 2t 2 then g (t) If y 3x 14 2x 3 x 3x 2 2x 3 thenIf y 0.3x 0.4 thend2x0.3dxd 2d3t 2t 2 6t 4t 3 .dtdt 0.6x 0.7 .dydx 0.12x 1.4 .dydx31 32 x 2 83 x 3 .
13Mathematics Learning Centre, University of SydneydWarning! Although Rule 4 tells us that dx(f (x) g(x)) f (x) g (x), the same is nottrue for multiplication or division. To differentiate f (x) g(x) or f (x) g(x) we cannotsimply find f (x) and g (x) and multiply or divide them. Be careful of this! The methodsof differentiating products of functions or quotients of functions are discussed in Sections3.3 and 3.4.Exercise 3.4Differentiate the following functions:a. f (x) 5x2 2 x1d. h(z) z 3 5zg.3.3y 5t 8 tb. y 2x 7 e.3x25f (u) u 3 3u 71tc. f (t) 2.5t2.3 f.g(z) 8z 2 tt5z1h. z 4x 7 2x 2The product ruleAnother way of combining functions to make new functions is by multiplying them together, or in other words by forming products. The product rule tells us how to differentiate functions like this.Rule 5 (The product rule) If f (x) u(x)v(x) thenf (x) u(x)v (x) u (x)v(x).ExamplesIf y (x 2)(x2 3) then y (x 2)2x 1(x2 3).If f (x) x(x3 3x2 7) then f (x) If z (t2 3)( t t3 ) thendzdt 1x(3x2 6x) 12 x 2 (x3 3x2 7). 1 (t2 3)( 12 t 2 3t2 ) 2t( t t3 ).
Mathematics Learning Centre, University of Sydney14Exercise 3.5Use the product rule to differentiate the functions below:a.f (x) (4x3 2)(1 3x)b. g(x) (x2 x 2)(x2 1)c.h(x) (3x3 2x2 8x 5)(x2 2x 4)d. f (s) (1 1 2s )(3s 5)2e. 1g(t) ( t )(2t 1)tf.h(y) (2 y y 2 )(1 3y 2 )Exercise 3.61If r (t )(t2 2t 1), find the rate of change of r with respect to t when t 2.tExercise 3.7Find the slope of the tangent to the curve y (x2 2x 1)(3x3 5x2 2) at x 2.3.4The Quotient RuleThis rule allows us to differentiate functions which are formed by dividing one functionby another, ie by forming quotients of functions. An example is such asf (x) 2x 3.3x 5Rule 6 (The quotient rule)u(x)v(x)v(x)u (x) u(x)v (x)f (x) [v(x)]2vu uv .v2f (x) Warning! Because of the minus sign in the numerator (ie in the top line) it is importantto get the terms in the numerator in the correct order. This is often a source of mistakes,so be careful. Decide on your own way of remembering the correct order of the terms.
15Mathematics Learning Centre, University of SydneyExamplesIf y 2x2 3xdy(x3 1)(4x 3) (2x2 3x)3x2.,then x3 1dx(x3 1)2 1( t 1)(2t 3) (t2 3t 1)( 12 t 2 )t2 3t 1 then g (t) .If g(t) t 1( t 1)2Exercise 3.8Use the Quotient Rule to find derivatives for the following functions:a. f (x) c.h(x) e.f (s) g. f (u) 3.5x 1x 1x2 2x2 5 1 s 1 su3 u 43u4 5b. g(x) 2x 33x 2d. f (t) 2t1 2t2f.h(x) x2 1x3 4h. g(t) t(t 6)t2 3t 1The composite function rule (also known as the chain rule)Have a look at the function f (x) (x2 1)17 . We can think of this function as beingthe result of combining two functions. If g(x) x2 1 and h(t) t17 then the result ofsubstituting g(x) into the function h ish(g(x)) (g(x))17 (x2 1)17 .Another way of representing this would be with a diagram likeghx x2 1 (x2 1)17 .We start off with x. The function g takes x to x2 1, and the function h then takesx2 1 to (x2 1)17 . Combining two (or more) functions like this is called composing thefunctions, and the resulting function is called a composite function. For a more detaileddiscussion of composite functions you might wish to refer to the Mathematics LearningCentre booklet Functions.Using the rules that we have introduced so far, the only way to differentiate the functionf (x) (x2 1)17 would involve expanding the expression and then differentiating. If thefunction was (x2 1)2 (x2 1)(x2 1) then it would not take too long to expand thesetwo sets of brackets. But to expand the seventeen sets of brackets involved in the functionf (x) (x2 1)17 (or even to expand using the binomial theorem) would take a long time.The composite function rule shows us a quicker way.Rule 7 (The composite function rule (also known as the chain rule))If f (x) h(g(x)) then f (x) h (g(x)) g (x).
Mathematics Learning Centre, University of Sydney16In words: differentiate the ‘outside’ function, and then multiply by the derivative of the‘inside’ function.To apply this to f (x) (x2 1)17 , the outside function is h(·) (·)17 and its derivativeis 17(·)16 . The inside function is g(x) x2 1 which has derivative 2x. The compositefunction rule tells us that f (x) 17(x2 1)16 2x.As another example let us differentiate the function 1/(z 3 4z 2 3z 3)6 . This can berewritten as (z 3 4z 2 3z 3) 6 . The outside function is (·) 6 which has derivative 6(·) 7 . The inside function is z 3 4z 2 3z 3 with derivative 3z 2 8z 3. The chainrule says thatd 3(z 4z 2 3z 3) 6 6(z 3 4z 2 3z 3) 7 (3z 2 8z 3).dzThere is another way of writing down, and hence remembering, the composite functionrule.Rule 7 (The composite function rule (alternative formulation))If y is a function of u and u is a function of x thendy dudy .dxdu dxdyand duare not reallyThis makes the rule very easy to remember. The expressions dudxfractions but rather they stand for the derivative of a function with respect to a variable.However for the purposes of remembering the chain rule we can think of them as fractions,dyso that the du cancels from the top and the bottom, leaving just dx.To use this formulation of the rule in the examples above, to differentiate y (x2 1)17put u x2 1, so that y u17 . The alternative formulation of the chain rules says thatdy dudy dxdu dx 17u16 2x 17(x2 1)16 2x.which is the same result as before. Again, if y (z 3 4z 2 3z 3) 6then set u z 3 4z 2 3z 3 so that y u 6 anddy dudy dxdu dx 6u 7 (3z 2 8z 3).You select the formulation of the chain rule that you find easiest to use. They are equivalent.
17Mathematics Learning Centre, University of SydneyExampleDifferentiate (3x2 5)3 .SolutionThe first step is always to recognise that we are dealing with a composite function andthen to split up the composite function into its components. In this case the outsidefunction is (·)3 which has derivative 3(·)2 , and the inside function is 3x2 5 which hasderivative 6x, and so by the composite function rule,d(3x2 5)3 3(3x2 5)2 6x 18x(3x2 5)2 .dxAlternatively we could first let u 3x2 5 and then y u3 . Sody dudy 3u2 6x 18x(3x2 5)2 .dxdu dxExampleFinddydxif y x2 1.SolutionThe outside function isx2 1 so that 11· (·) 2 which has derivative 12 (·) 2 , and the inside function is11y (x2 1) 2 2x.2 1Alternatively, if u x2 1, we have y u u 2 . So1111dy u 2 2x (x2 1) 2 2x.dx22Exercise 3.9Differentiate the following functions using the composite function rule.a.(2x 3)2b.d.(x3 1)5e.f (t) g.y (t3 h.z (x x1 ) 7 t) 3.8(x2 2x 1)12 t2 5t 73c.(3 x)21f.g(z) 12 z 4
18Mathematics Learning Centre, University of SydneyExercis
2.00 4.00 6.00 8.00 100 200 300 (metres) Distance time (seconds) Mathematics Learning Centre, University of Sydney 1 1 Introduction In day to day life we are often i