Transcription
City of Seattle Building EnergyPerformance and Carbon Emissions2016-2017
Table of ContentsSection I. Municipal portfolio energy & GHG emissions performanceBackground Energy performance carbon emissions of City buildings Carbon intensity analysis 237Section 2. Detailed analysis of benchmarked buildingsBuilding energy performance by year-over-year EUI Building emissions by carbon total Building emissions by carbon index 111519Section 3. Analysis of building performance by departmentFinance & Administrative Services Seattle Public Libraries Seattle Parks & Recreation Seattle Center Seattle City Light Seattle Public Utilities Seattle Department of Transportation 25313439404244Section 4. Analysis of building performance by building typePolice precincts Neighborhood fire stations Community centers pools 464750
2016-2017 MUNICIPAL BUILDING PORTFOLIO ENERGY PERFORMANCESection I.Municipal Building Portfolio Energy Emissions Performance1
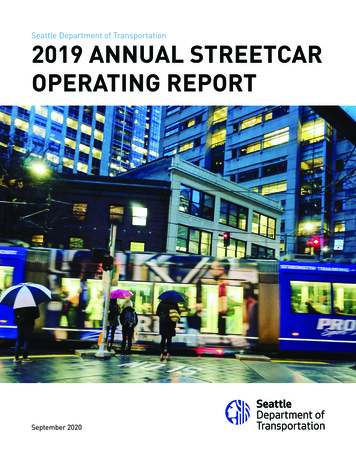
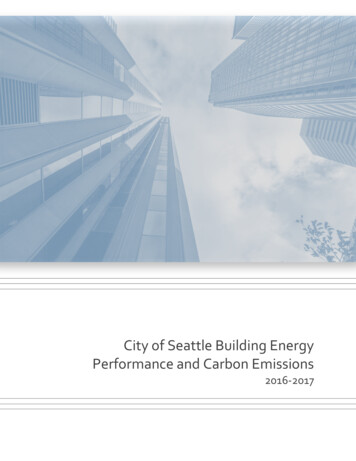
2016-2017 MUNICIPAL BUILDING PORTFOLIO ENERGY PERFORMANCEThe City has the goal of reducing energy use across City-owned buildings 20% by 2020 (from 2008),adopted by Resolution in 2016. Beyond our 2020 goal, in Mayor Durkan’s 2018 Climate Action Strategythe City set a longer-term goal of reducing both energy use and carbon emissions by 40% by 2025. Inaddition, the 2013 Climate Action Plan calls for a community-wide carbon neutrality goal by 2050.This report covers City-owned building energy use and greenhouse gas (GHG) emissions for calendaryears 2016-2017. It includes: An overview of the municipal building portfolio energy and GHG emissions performance. An analysis of benchmarked buildings. An analysis of building performance, by department and by building type.The City owns more than 650 buildings, totaling approximately 10 million square feet. These rangefrom small storage sheds, to libraries, to the Seattle Municipal Tower, an office building of 1.4 milliongross square feet. Offices, community facilities (e.g. performance halls and community centers), andoperations support buildings make up most of the square footage. Libraries, police stations, and firestations are numerous, but each building is relatively small, so they account for a smaller percentage ofthe total building area.Of the 10 million square feet of City buildings, 182 benchmarked buildings account for 80% of the City’stotal building area. This report covers more than 8 million square feet of buildings with at least twoyears of consumption history and weather-normalized results.Figure 1. Benchmarked floor area share, by department.4%1% d results were based on Portfolio Manager weather normalization 1 for all buildings. Thepurpose of normalization is to see the changes in consumption if the weather were held the same forthe two periods being compared.1 Seatacweather was 20% colder in 2017 than in 2016 for the heating season, and 25% warmer for the cooling season.2
2016-2017 MUNICIPAL BUILDING PORTFOLIO ENERGY PERFORMANCEThe total relative energy use in 2017 by department is shown below:Figure 2. Weather-normalized energy use (KBTU) by department, 2017.3%0.5% 3%5%35%13%17%24%FASSPRCENSCLSPLSPUSDOTAQUMetered energy use across the municipal portfolio increased by 3.71% from 2016 to 2017. Adjusted forweather, energy use declined by 2.71%. Each department’s year-over-year energy use is graphed belowon a metered and weather normalized basis.Figure 3. Metered energy use from 2016 to 2017, % SCLSPL10%4.18%-2.21%SPU6.26%4.29%SDOTAQU10.25%3
2016-2017 MUNICIPAL BUILDING PORTFOLIO ENERGY PERFORMANCEFigure 4. Weather-normalized energy use from 2016 to 2017, % .79%The City set a goal of reducing energy use across City-owned buildings 20% by 2020 (from 2008). Basedon this analysis, we have achieved 14.5% reduction in energy use across the municipal portfolio through2017.Figure 5. City of Seattle portfolio energy reductions, plan versus actual, 20% by 2020 progress.20% by 2020 ual4
2016-2017 MUNICIPAL BUILDING PORTFOLIO ENERGY PERFORMANCEApproximately 63% of the benchmarked portfolio saw a reduction in normalized energy use, while 37%used more energy. The focus of the City’s Municipal Energy Efficiency Program in 2017 was on TuneUps in larger buildings, those 200,000 sf and above. The Tune-Ups were completed in the last half ofthe year. They therefore had partial impacts in 2017, but will contribute to additional savings in 2018.Department-led improvements at SMT, Central Library, and community centers, as well as a bevy ofLED lighting projects, helped us secure the 2017 progress towards our savings targets.Figure 6. Seattle municipal portfolio performance, by area share (weather-normalized).5%25%32%38%Decrease more than 10%Decrease 0-10%Increase of 0-10%Increase of more than 10%Year-over-year change in energy use by department – in kbtu, in % change, and as a proportion of the2.71% normalized reduction in energy use across the municipal portfolio – can be seen below.Table 1. Weather-normalized change in energy use from 2016 to 2017.DEPARTMENTFASSPRCENSCLSPLSPU 2SDOTAQUTotal2CHANGE IN ENERGYUSE, udes water treatment plants.5CHANGE INENERGY USE, TFOLIOIMPACT, 71%
2016-2017 MUNICIPAL BUILDING PORTFOLIO ENERGY PERFORMANCEYear-0ver-year change in carbon 3 – in lbCO2e, as a percent change, and as a proportion of the overallreduction in carbon across the municipal portfolio – can be seen below.Table 2. As-metered change in carbon emissions from 2016 to 2017.DEPARTMENTFASSPRCENSCLSPLSPU 4SDOTAQUTotal2016 TOTALCARBON,(lbCO2e)2017 2,553631,58931,966,057CHANGE INCARBON, TFOLIOIMPACT, le as-metered carbon emissions increased by 12% from 2016 to 2017, total carbon emissionsdecreased by 1% when normalized for weather.Table 3. Normalized change in carbon emissions from 2016 to 2017.DEPARTMENTFASSPRCENSCLSPLSPU 5SDOTAQUTotal2016 TOTALCARBON,(lbCO2e)2017 2,282621,13031,209,5243CHANGE INCARBON, %PORTFOLIOIMPACT, arbon factors for the purposes of this analysis are: electric 0.095 lb CO2e/ktbu (average of SCL data reported to the ClimateRegistry 2012-2016), steam 0.1702 lb CO2e/kbtu (2013 data from EPA), gas 0.1171 lb CO2e/kbtu (Portfolio Manager standardvalue for gas emissions). Please see end not for source references.4 Excludes water treatment plants.5 Excludes water treatment plants.6
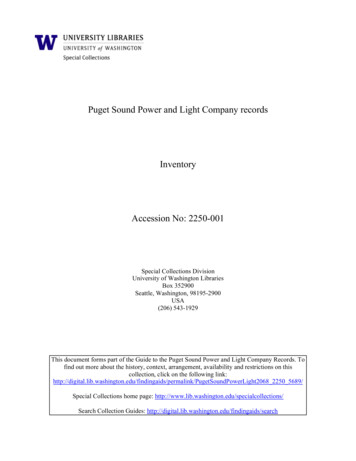
2016-2017 MUNICIPAL BUILDING PORTFOLIO ENERGY PERFORMANCECarbon intensities range from almost zero lb CO2e/sf/yr to nearly 50 lb CO2e/sf/yr. Below, theintensities are plotted by the presence and type of fossil fuel service at each of 156 sites. A site is a pointwhere all of the energy for an entire building or group of buildings is metered. The 156 sites noted onthe graph below represent 182 buildings.Figure 7. Carbon emissions intensity by building energy use intensity (EUI).As depicted above, approximately 75% of our benchmarked portfolio has fossil fuel service, with eithergas at the building or buildings served by a gas-fired district steam system. Carbon intensities forbuildings with no fossil fuels range from 0.2 to 2.0 lbs CO2e/sf/yr, while buildings with fossil fuel servicetypically range from 1.0 to 50 lbs CO2e/sf/yr. There is a strong correlation between the highest EUIs andthe highest carbon intensities, reflecting the historic use of fossil fuels to serve large thermal loads. Thiscan be seen in the higher penetration of fossil fuel service to buildings with site EUIs of over 150kBtu/sf/yr (91%) compared to buildings with EUIs of less than 40 kBtu/sf/yr (67%), as noted above. Forbuildings that utilize fossil fuel, only those with a low fossil fuel load, possibly using fossil fuels just forwater heating or partial space conditioning, can attain comparable emissions to buildings with no fossilfuels.7
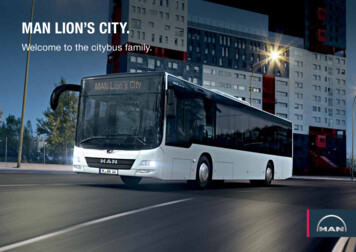
2016-2017 MUNICIPAL BUILDING PORTFOLIO ENERGY PERFORMANCECarbon emission are plotted below versus gross building floor area:Figure 8. Carbon emissions by gross floor area.Each point on the plot is a metering point, representing a building or in a few cases, an entire campus.The plot above is distorted by three large properties. Although none is particularly energy intensive,they each generate over 500,000 lbs CO2e/year. If we remove the Seattle Center and Magnusoncampuses, as well as Seattle Municipal Tower, we can better see other key contributors to our carbonemissions:Figure 9. Carbon emissions of high-impact buildings.8
2016-2017 MUNICIPAL BUILDING PORTFOLIO ENERGY PERFORMANCEIn the plot above, three types of high-impact buildings, those generating over 250,000 lbs CO2e/yr( 1,100 MTCO2e), are highlighted; (1) large buildings (over 100,000 sf), (2) pools, and (3) Other High-usebuildings. Predictably, large buildings emit significant amounts of carbon each year because of theirsize. Pools, although typically smaller buildings, have very high energy use, and all of the municipalpools have fossil fuel service. Similarly, Other High-use buildings have high energy intensities coupledwith fossil fuel use, and are defined here to be less than 100,000 sf. Other High-use buildings aretypically headquarter-type facilities, as well as other specialty buildings. Examples of Other High-usebuildings across the portfolio include: West Precinct Fire Headquarters Fire Station 10/FAC/EOC/ SPU Operations Control Center SCL North Operating Base Charles Street Complex Vehicle Maintenance Conservatory Campus AquariumThese three building types may be priority candidates for conservation action which would in turnreduce carbon emissions, particularly if other upcoming asset preservation or improvement work isplanned. However, significant energy reductions and/or changes to must be achieved at all municipalbuildings served by fossil fuels to achieve required progress on carbon reductions. Collectively, thethree types of high-impact buildings plus Seattle Center Campus, Magnuson Park Campus and SeattleMunicipal Tower account for nearly 75% of the portfolio GHG emissions.9
2016-2017 MUNICIPAL BUILDING PORTFOLIO ENERGY PERFORMANCESection 2.Detailed Analysis of Benchmarked Buildings10
2016-2017 MUNICIPAL BUILDING PORTFOLIO ENERGY PERFORMANCETo help identify the best opportunities to improve efficiency and the largest and the most intensivesources of carbon emissions within the portfolio, this section offers data and analysis on energyintensity and carbon emissions by total carbon emitted per building and by pounds of carbon emittedper square foot. This information will aid in planning and prioritizing future projects to best addressclimate impacts.Below, all buildings in the City’s portfolio are ranked by year-over-year energy performance.Table 4. Building energy performance, 2017, rank ordered by % change in EUI.PropertyGFA (ft²)DeptProperty ASFASSPRSDOTFASFASSPLFASFASFASSCLFASSPRCarkeek Park Environmental Learning CenterLoyal Heights Community CenterFire Station 26Miller Community CenterGeorgetown SteamplantByrd Barr PlaceMontlake Community CenterBelltown Community CenterOld South Transfer StationWestbridgeCentral East HeadquartersUniversity BranchRainier Community CenterWest Court BuildingGreenwood BranchFire Station 29Fire Station 20Delridge Community CenterStreet Car MaintenanceFire Station 39Joint Training Facilities CampusSouth Park BranchPearl Warren BuildingFire Station 24Fire Station 08SCL SSC Building BCSC Vehicle Maintenance (E)Queen Anne Community 0,32067,77225,809EUI changefrom 2016to 2017, 3%13%12%12%11%11%11%11%10%10%10%9%9%9%9%9%2017 65.736.5129.890.065.2103.4110.92017 .965.735.2122.788.563.499.9109.7
2016-2017 MUNICIPAL BUILDING PORTFOLIO ENERGY PERFORMANCEDeptProperty SPUFASSPLSPLSPRSE Seattle Community Health CenterBallard BranchEnvironmental Learning CenterSeattle AquariumWatershed Education CenterFire Station 41Dexter BuildingHigh Point Community CenterWest PrecinctFire Station 34Fire Station 16Diablo PowerhouseRavenna-Eckstein Community CenterFire Station 38Rainier Beach Community Center and PoolConservatory CampusBlue SpruceFire Station 40Queen Anne PoolCity HallFire Station 02West Seattle BranchFire Station 35Southwest BranchCSC Engineering (A)Fire Station 13Rainier Beach BranchLake City BranchBallard PoolNorth SubstationCentral PlantHorticulture BuildingOCC ComplexFire Station 14Fremont BranchMontlake BranchGenesee/SC SE HQPropertyGFA 18,4366,8405,65215,39812EUI changefrom 2016to 2017, %3%2%2%2%2%2%1%1%1%1%1%1%1%1%1%1%0%0%2017 .4107.4111.178.986.527.22017 7.4106.8107.178.584.527.0
2016-2017 MUNICIPAL BUILDING PORTFOLIO ENERGY PERFORMANCEPropertyGFA (ft²)DeptProperty RSPRSPRFASSCLSCLMagnuson, Building 67, MountaineersAnimal ShelterAirport Way Center, Building ASouthwest Teen Life Center and PoolGreen Lake BranchQueen Anne BranchUnion St SubstationMagnolia BranchFairview BuildingFire Station 31Benaroya HallFirst Hill Street Car Maintenance ShopFire Station 30CSC Meter Shop (G)System Operations CenterSCL SSC Building AGarfield Community CenterDelridge BranchSDOT Traffic ShopBoundary ProjectNorth East BranchFire Station 10/FAC/EOCDouglass-Truth BranchHiawatha Community CenterNewhalem Service Center (Machine Shop/Mezz)Justice CenterArmory BuildingAirport Way Center, Building BFire Station 36Newhalem Service Center (Warehouse/Mezz)South Transfer StationVan Asselt Community CenterMedgar Evers PoolHelene Madison PoolFire Station 28Ross PowerhouseGorge 5820,74017,40714,031121,63029,369EUI changefrom 2016to 2017, -3%-4%-4%-4%-4%-4%2017 1534.590.850.8119.92017 5252.2525.986.751.1120.0
2016-2017 MUNICIPAL BUILDING PORTFOLIO ENERGY PERFORMANCEPropertyGFA (ft²)DeptProperty RSPRSCLSPRFASSPRNorthgate CampusEast PrecinctFire Station 17Columbia BranchFire Station 27Fire Station 11Densmore/NW NC HQAirport Way Center, Building DFire HeadquartersAirport Way Center, Building ECentral West HQ / Brown BearGreen Lake Community Center and PoolCSC Fire Garage (C)Broadview BranchBroad St SubstationSouthwest PrecinctMeadowbrook Community Center/PoolSouth PrecinctHigh Point BranchMagnusonLaurelhurst Community CenterFire Station 09Capitol Hill BranchKing Street StationHLF FAS Vehicle Maintenance (A)Landsburg LOC BuildingJefferson Park Golf Clubhouse & Driving RangeBeacon Hill BranchNorth Service CenterBallard Community CenterNorth PrecinctBitter Lake Community CenterSouth Park Community Center157 Roy BuildingCitywide AthleticsFire Station 33Yesler Community 112,1221,2635,97422,347EUI changefrom 2016to 2017, -9%-9%-10%-10%-10%-11%-11%-13%2017 .151.2110.1149.993.299.12017 8.450.1110.2150.093.197.9
2016-2017 MUNICIPAL BUILDING PORTFOLIO ENERGY PERFORMANCEPropertyGFA (ft²)DeptProperty PRAmy Yee Tennis CenterSeattle Municipal TowerFire Station 25Fire Station 21Central LibraryNewhalem Phantom Warehouse/Sickler BldgSeattle Asian Art MuseumCedar River HatcheryFire Station 37Jefferson Community CenterLangston Hughes Performing Arts CenterFire Station 18Canal SubstationFire Station 06Airport Way Center, Building CInternational District/Chinatown CCEUI changefrom 2016to 2017, 9%-20%-22%-23%-23%-27%-28%2017 EUI,metered2017 w, all buildings and campuses in the City’s portfolio are ranked first by total carbon (lbCO2e) andthen by carbon index (lbCO2e/SF). 6Table 5. Total 2017 GHG emissions (lbC02e), rank ordered by total carbon.DeptCENSPRSPRSPRFASFASSPRFASSPRFASSPRTotal roperty NameCentral PlantMagnusonGreen Lake Community Center and PoolRainier Beach Community Center and PoolBenaroya HallJustice CenterHelene Madison PoolWest PrecinctMeadowbrook Community Center/PoolCity HallSouthwest Teen Life Center and Pool6Carbon 616.6This carbon index uses units of lbs CO2e/SF of building area. Most facilities that use fossil fuels will have a high carbon index.15
2016-2017 MUNICIPAL BUILDING PORTFOLIO ENERGY PRSPRSPRSPRFASSPRSPRFASSPRFASSPRSPRFASTotal 4Property NameOCC ComplexConservatory CampusSeattle AquariumCSC Vehicle Maintenance (E)Queen Anne PoolSeattle Municipal TowerArmory BuildingBallard PoolAirport Way Center, Building AWestbridgeFire Station 10/FAC/EOCFire HeadquartersNorth Service CenterMedgar Evers PoolAirport Way Center, Building ECSC Engineering (A)Central LibrarySeattle Asian Art MuseumHLF FAS Vehicle Maintenance (A)Joint Training Facilities CampusLoyal Heights Community CenterQueen Anne Community CenterLangston Hughes Performing Arts CenterAirport Way Center, Building CBoundary ProjectSouthwest PrecinctFire Station 02SCL SSC Building ANorthgate CampusRainier Community CenterYesler Community CenterMiller Community CenterCSC Meter Shop (G)Montlake Community CenterDelridge Community CenterFire Station 17Jefferson Community CenterFire Station 14Bitter Lake Community CenterGarfield Community CenterAnimal Shelter16Carbon .15.11.05.66.17.68.58.29.18.36.78.77.56.76.712.0
2016-2017 MUNICIPAL BUILDING PORTFOLIO ENERGY PRSPLSPRFASFASFASSPRFASSPRFASFASSCLSPLTotal ,72044,59444,337Property NameEast PrecinctSDOT Traffic ShopDexter BuildingFire Station 25Ballard BranchByrd Barr PlaceVan Asselt Community CenterMagnuson, Building 67, MountaineersPearl Warren BuildingCSC Fire Garage (C)Airport Way Center, Building DAirport Way Center, Building BGreenwood BranchFire Station 31Lake City BranchRavenna-Eckstein Community CenterNorth East BranchRoss PowerhouseUniversity BranchColumbia BranchFire Station 08Douglass-Truth BranchFire Station 35South Transfer StationHorticulture BuildingSystem Operations CenterBroadview BranchBallard Community CenterInternational District/Chinatown CCWest Seattle BranchHigh Point Community CenterFire Station 06Fire Station 18Fire Station 37Laurelhurst Community CenterFire Station 38South Park Community CenterFire Station 40Fire Station 28SCL SSC Building BBeacon Hill Branch17Carbon 03.25.42.84.33.05.04.25.03.26.73.20.64.1
2016-2017 MUNICIPAL BUILDING PORTFOLIO ENERGY SPLSCLSDOTFASSCLFASSPRSPRSCLSDOTFASFASSCLTotal ,02913,989Property NameFire Station 11Fire Station 30Fire Station 39Diablo PowerhouseGreen Lake BranchSouthwest BranchFire Station 26Fire Station 33Fire Station 41Fire Station 09Fire Station 34Fire Station 27High Point BranchWest Court BuildingBroad St SubstationFremont BranchGorge PowerhouseQueen Anne BranchDensmore/NW NC HQMagnolia BranchHiawatha Community CenterFairview BuildingFirst Hill Street Car Maintenance ShopFire Station 21Central East HeadquartersFire Station 13SE Seattle Community Health CenterMontlake BranchCapitol Hill BranchEnvironmental Learning CenterKing Street StationNorth PrecinctNewhalem Service Center (Machine Shop/Mezz)Fire Station 29Genesee/SC SE HQJefferson Park Golf Clubhouse & Driving RangeCanal SubstationStreet Car MaintenanceSouth PrecinctFire Station 16Newhalem Service Center (Warehouse/Mezz)18Carbon 1.90.60.31.11.03.31.01.51.11.61.13.50.8
2016-2017 MUNICIPAL BUILDING PORTFOLIO ENERGY USPUSPRFASSCLCENSPLSPLSPRSPRProperty Name157 Roy BuildingAmy Yee Tennis CenterFire Station 20North SubstationCedar River HatcheryWatershed Education CenterGeorgetown SteamplantNewhalem Phantom Warehouse (Sickler Bldg)Belltown Community CenterFire Station 24Rainier Beach BranchLandsburg LOC BuildingOld South Transfer StationCentral West HQ / Brown BearFire Station 36Union St SubstationBlue SpruceDelridge BranchSouth Park BranchCitywide AthleticsCarkeek Park Environmental Learning CenterTotal 0823,6673,2981,8941,288Carbon .30.30.40.80.30.30.70.71.50.7Total 59288,094130,714Carbon .716.614.614.314.112.0Table 6. Total 2017 GHG emissions (lbC02e), rank ordered by total carbon ASProperty NameHelene Madison PoolQueen Anne PoolBallard PoolGreen Lake Community Center and PoolConservatory CampusRainier Beach Community Center and PoolMeadowbrook Community Center/PoolDexter BuildingMedgar Evers PoolSouthwest Teen Life Center and PoolAirport Way Center, Building EWest PrecinctCSC Engineering (A)Animal Shelter19
2016-2017 MUNICIPAL BUILDING PORTFOLIO ENERGY ASFASFASFASSPRSPLSPLFASSPRSPRFASSPLSPLProperty NameArmory BuildingHLF FAS Vehicle Maintenance (A)Montlake Community CenterQueen Anne Community CenterSeattle AquariumJefferson Community CenterMiller Community CenterDelridge Community CenterCSC Vehicle Maintenance (E)CSC Meter Shop (G)Loyal Heights Community CenterFire Station 26Byrd Barr PlaceYesler Community CenterUniversity BranchFire Station 14Fire Station 41OCC ComplexFire Station 11Southwest PrecinctFire Station 08Fire Station 33Langston Hughes Performing Arts CenterFire Station 40Garfield Community CenterBitter Lake Community CenterFire Station 17Fire Station 10/FAC/EOCFire Station 25Fire HeadquartersFire Station 34Fire Station 27Rainier Community CenterGreenwood BranchBallard BranchFire Station 31Northgate CampusVan Asselt Community CenterBenaroya HallWest Seattle BranchGreen Lake Branch20Total 2,673171,86899,874942,71650,73242,300Carbon .76.66.66.66.16.16.05.95.75.65.55.55.45.2
2016-2017 MUNICIPAL BUILDING PORTFOLIO ENERGY ASSPLFASFASCENSPLSPRSPLSDOTFASSPRFASSPRTotal 87195,72927,91851,113Property NameHigh Point BranchFremont BranchFire Station 02Seattle Asian Art MuseumFire Station 38Fire Station 37Columbia BranchAirport Way Center, Building BCSC Fire Garage (C)Fire Station 30Magnolia BranchJoint Training Facilities CampusFire Station 35Ravenna-Eckstein Community CenterFire Station 09Central PlantHorticulture BuildingFire Station 06Queen Anne BranchNorth East BranchLaurelhurst Community CenterCentral East HeadquartersBeacon Hill BranchMontlake BranchAirport Way Center, Building ANorth Service CenterFire Station 39Airport Way Center, Building DCity HallLake City BranchEast PrecinctFire Station 16West Court BuildingDouglass-Truth BranchWestbridgeBroadview BranchFairview BuildingFire Station 29Magnuson, Building 67, MountaineersFire Station 21International District/Chinatown CC21Carbon 3.63.53.53.53.53.53.43.43.43.33.33.23.2
2016-2017 MUNICIPAL BUILDING PORTFOLIO ENERGY FASSCLSCLSCLSPRSCLFASSPUFASFASSCLSPLSPRProperty NameFire Station 28South Park Community CenterBallard Community CenterSDOT Traffic ShopFire Station 18Justice CenterSouthwest BranchHigh Point Community CenterMagnusonPearl Warren BuildingCapitol Hill BranchDiablo PowerhouseBoundary ProjectSystem Operations CenterHiawatha Community CenterDensmore/NW NC HQFire Station 13Street Car MaintenanceBroad St SubstationJefferson Park Golf Clubhouse & Driving RangeFire Station 24Citywide AthleticsAirport Way Center, Building CFirst Hill Street Car Maintenance ShopLandsburg LOC BuildingBelltown Community CenterGorge PowerhouseSouth PrecinctNorth Precinct157 Roy BuildingCanal SubstationNewhalem Service Center (Machine Shop/Mezz)Genesee/SC SE HQSCL SSC Building AFire Station 20Watershed Education CenterSE Seattle Community Health CenterFire Station 36Newhalem Service Center (Warehouse/Mezz)Central LibraryCarkeek Park Environmental Learning Center22Total 276,9451,288Carbon 1.11.11.11.01.01.01.01.00.80.80.80.80.7
2016-2017 MUNICIPAL BUILDING PORTFOLIO ENERGY RSPUCENSDOTSCLSCLSPRProperty NameSouth Park Bra
Seattle Public Libraries 31 . Seattle Parks & Recreation 34 . Seattle Center 39 . Seattle City Light 40 . Seattle Public Utilities 42 . Seattle Department of Transportation 44 . Section 4. Analysis of building performance by building type Police precincts 46 . Neigh