Transcription
A Forrester Total Economic Impact StudyCommissioned By MicrosoftMarch 2020The Total EconomicImpact Of Power AppsOne In A Series Of Total Economic Impact AnalysesLooking At Microsoft Power Platform Solutions
Table Of ContentsExecutive SummaryKey Findings11TEI Framework And Methodology4The Power Apps Customer JourneyInterviewed And Surveyed Organizations55Key Challenges5Key Results6Composite Organization7Analysis Of BenefitsReduced Application Development CostsStreamlined Activities10Unquantified Benefits11Flexibility14Analysis Of CostsDevelopment CostsCorporate IT Solution And Code ManagementProject Director:Jonathan LipsitzProject Contributor:Adrienne Capaldo88151516Financial SummaryPower Apps: OverviewPower Apps171818Appendix A: Total Economic ImpactAppendix B: Endnotes1920ABOUT FORRESTER CONSULTINGForrester Consulting provides independent and objective research-basedconsulting to help leaders succeed in their organizations. Ranging in scope from ashort strategy session to custom projects, Forrester’s Consulting services connectyou directly with research analysts who apply expert insight to your specificbusiness challenges. For more information, visit forrester.com/consulting. 2020, Forrester Research, Inc. All rights reserved. Unauthorized reproductionis strictly prohibited. Information is based on best available resources.Opinions reflect judgment at the time and are subject to change. Forrester ,Technographics , Forrester Wave, RoleView, TechRadar, and Total EconomicImpact are trademarks of Forrester Research, Inc. All other trademarks are theproperty of their respective companies. For additional information, go toforrester.com.
Executive SummaryKey BenefitsReduced app development andcosts:74%Revenue uplift linked to more andfaster development efforts:4.3%Worker hours saved fromstreamlined and automatedactivities (Year 3):132,000Microsoft provides no-code/low-code application development solutionsthat help its customers speed up application development and empowerboth pro developers and non-developers (citizen developers) to createapplications better and faster. Microsoft commissioned ForresterConsulting to conduct a Total Economic Impact (TEI) study and examinethe potential return on investment (ROI) enterprises may realize bydeploying Power Apps. The purpose of this study is to provide readerswith a framework to evaluate the potential financial impact of Power Appson their organizations.To better understand the benefits, costs, and risks associated with thisinvestment, Forrester interviewed six customers and surveyed anadditional 53 using Power Apps either with or without other PlatformSolutions — Power Automate and Power BI. Regardless, this study looksspecifically at the benefits and costs associated with Power Apps as astandalone solution. Interviewees said that by reducing applicationdevelopment time and empowering developers to create customapplications, they were able to greatly reduce development costs andincrease worker efficiencies. These improvements delivered businessbenefits such as reduced time-to-market, better customer service, andincreased revenues.Prior to using Power Apps, organizations used traditional tools for allapplication development, and only “high-code” developers were engagedin these activities. This meant that there was a large backlog of IT projects,and developers never translated many business ideas into systemimprovements because the cost and effort was too high. Adopting PowerApps transformed the IT function from one perceived as a blocker to anenabler. One interviewee said: “The business is not waiting for ITanymore, which was their most common complaint. [Power Apps] takesthat off the table. We are now seen as an enabler, not a roadblock.”Key FindingsQuantified benefits. The following risk-adjusted present value (PV)quantified benefits are representative of those experienced by thecompanies interviewed and surveyed and applied to a compositeorganization with 2,000 employees who have access to Power Appsthrough their Office 365 and/or Microsoft Dynamics licenses:› The average cost to develop an application is 74% less with PowerApps. For applications that can be developed using these new tools andincluded connectors, the internal development effort, professionalservices fees, and/or vendor applications purchase costs are muchlower. Additionally, the effort to maintain code and manage applicationsis less. Over the life of the study, the composite avoids 4.9 million inapplication development and management costs.› Developing additional applications in-house eliminates vendorlicense costs. Interviewees provided examples of external applicationsreplaced by in-house developed applications using Power Apps. For thestudy, the composite replaces two applications with a total savings of 742,449.› Power Apps increase activity efficiencies. The applications that arecreated digitize existing, manual, and often paper-based activities. Theefficiency gains can vary widely by role, and mobile workers especially1 The Total Economic Impact Of Power Apps
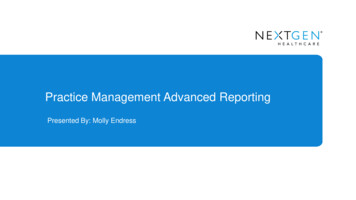
benefit from these improvements. Overall, 1,650 users save 1.6 hoursper week by Year 3 of the study. Applying a 50% productivity capture,because not all productivity gains translate into additional work, thecomposite achieves 3.7 million in efficiencies.ROI188%Unquantified benefits. The interviewed organizations experienced thefollowing benefits, which are not quantified for this study:Benefits PV 9.4 millionNPV 6.1 millionPayback 6 months› Better applications enable business transformation and improvedbusiness outcomes. Interviewees described many ways that theirbusinesses have improved. This includes happier customers, reducedtime-to-market, and increased revenue (4.3% according to the survey).Because these benefits can vary greatly from one organization to thenext, Forrester did not include them in the financial analysis.› Employees can make better and faster decisions from betteraccess to information. Much of the development work completed withPower Apps enables faster collection of information from first-lineworkers and transferal to decision makers in a more usable format. This,in turn, means that better decisions are made based on data sets thatare larger and closer to real time.› Power Apps empowers users, which increases employeesatisfaction. Both IT and business users can now more efficiently andeffectively create applications that deliver business value. In manycases, these applications would never have been built without thesetools. This gives users more control over their work and enables them toeliminate repetitive and annoying manual activities.› Organizations realize additional value with other Power Platformand other Microsoft solutions such as Dynamics CRM and Teams.Interviewees described how these solutions, being part of the Microsoftstack, enable them to build on prior investments to create more value.› Mobile applications developed with Power Apps are more securethan would likely otherwise have been developed. Because theseapplications and workflows tie into Azure Active Directory and otherMicrosoft security solutions, IT can control permissions at the data andapplication levels. Additionally, users building in these tools reducesshadow IT. All Power Apps that are built on the Common Data Servicefor Apps are automatically GDPR-compliant.Costs. The interviewed organizations experienced the following riskadjusted PV costs, modeled by the composite organization:› Internal and professional application development costs average 45,000 per application. The average cost per application developedwith Power Apps can vary widely based on its functionality and howexperienced users are with the tools. Subtracting these costs from theavoided application development costs in the Benefits section results inthe net savings that the composite organization realizes. Theorganization develops a total of 33 applications over the life of the study,and the total development costs are 2.0 million.› Ongoing corporate IT management and development of PowerApps code and business user training costs 1.2 million. The effortto manage the Power Apps solution is very low at 0.1 FTE. Thecorporate IT department is also involved in maintaining and developingcode. IT also spends time training business users on how to developwith Power Apps. The centralized development and training functiongrows to four FTEs by Year 3 of the study (the 0.1 for solution upkeep is2 The Total Economic Impact Of Power Apps
included in here) as the number of Power Apps increases. Users whorequire premium connectors for things like enterprise resource planning(ERP) integrations require premium licenses. The number of paidlicenses depends on the number of users leveraging the paid features intheir apps.Forrester’s interviews with six existing customers, survey of an additional53 customers, and subsequent financial analysis found that anorganization based on these organizations experiences benefits of 9.4million over three years versus costs of 3.3 million, adding up to a netpresent value (NPV) of 6.1 million and an ROI of 188%.Benefits (Three-Year)Financial Summary 4.9M 3.7MTotalbenefitsPV, 9.4M 742.4KTotalcosts PV, 3.3MInitialYear 1Year 23 The Total Economic Impact Of Power AppsYear 3ReducedAvoided third-partyapplicationapplicationsdevelopment costsStreamlinedactivities
TEI Framework And MethodologyFrom the information provided in the interviews, Forrester has constructeda Total Economic Impact (TEI) framework for those organizationsconsidering implementing Power Apps.The objective of the framework is to identify the cost, benefit, flexibility, andrisk factors that affect the investment decision. Forrester took a multistepapproach to evaluate the impact that Power Apps can have on anorganization:DUE DILIGENCEInterviewed Microsoft stakeholders and Forrester analysts to gather datarelative to Power Apps.The TEI methodologyhelps companiesdemonstrate, justify,and realize thetangible value of ITinitiatives to bothsenior managementand other keybusinessstakeholders.CUSTOMER INTERVIEWS AND SURVEYInterviewed six organizations and surveyed an additional 53 using PowerApps to obtain data with respect to costs, benefits, and risks.COMPOSITE ORGANIZATIONDesigned a composite organization based on characteristics of theinterviewed and surveyed organizations.FINANCIAL MODEL FRAMEWORKConstructed a financial model representative of the interviews and surveyusing the TEI methodology and risk-adjusted the financial model based onissues and concerns of the interviewed organizations.CASE STUDYEmployed four fundamental elements of TEI in modeling Power Apps’impact: benefits, costs, flexibility, and risks. Given the increasingsophistication that enterprises have regarding ROI analyses related to ITinvestments, Forrester’s TEI methodology serves to provide a completepicture of the total economic impact of purchase decisions. Please seeAppendix A for additional information on the TEI methodology.DISCLOSURESReaders should be aware of the following:This study is commissioned by Microsoft and delivered by Forrester Consulting.It is not meant to be used as a competitive analysis.Forrester makes no assumptions as to the potential ROI that otherorganizations will receive. Forrester strongly advises that readers use their ownestimates within the framework provided in the report to determine theappropriateness of an investment in Power Apps.Microsoft reviewed and provided feedback to Forrester, but Forrester maintainseditorial control over the study and its findings and does not accept changes tothe study that contradict Forrester’s findings or obscure the meaning of thestudy.Microsoft provided the customer names for the interviews but did not participatein the interviews.4 The Total Economic Impact Of Power Apps
The Power Apps Customer JourneyBEFORE AND AFTER THE POWER APPS INVESTMENTInterviewed And Surveyed OrganizationsFor this study, Forrester conducted six interviews with Power Appscustomers. Interviewed customers include the following:INDUSTRYREGIONUSERS WITH ACCESSTO POWER APPSINTERVIEWEESIndustrial equipmentservicingNorth America-VP of IT and purchasing430Beverage distributorUS regional-Cloud services manager1,600Power generationNorth America and Australia-Enterprise architect2,200Financial servicesUK-Head of CRM solutions-Chief data officer3,500Field servicesGlobal-Director-IT operations-Digital transformation manager10,000BankHQ in Africa-BI specialist3,000There were 53 survey respondents using Power Apps. The top threeindustries were IT professional services, business professional services,and financial services. The average number of Power Apps users was1,044.Key ChallengesThe interviewed companies faced common challenges around deliveringmodern IT, supporting more users and growth, and managing increasingcosts.› IT had to support more first-line and mobile workers. Moving toOffice 365 can significantly increase the number of users who areconsuming IT services. Additionally, companies are putting more effortinto making mobile workers more effective and efficient. Together,these two trends meant that IT struggled to deliver the necessary toolsto a greatly expanded number of users. One interviewee said: “Whenwe switched to Office 365, we all of a sudden had lot more users tosupport, and we had to figure out a way to deliver everything mobilefirst. Now, a guy on a forklift has access to these applications.”› IT systems did not meet current needs, and there was limitedbudget to make changes. Interviewees described an IT estate thatcould not support new initiatives. When it comes to ERP systems, thecost to upgrade or replace was larger than available budgets. Therewas also a shortage of application development skills in-house, as wellas a lack of budget to outsource development. The interviewed VP ofIT and purchasing said: “We have an antiquated ERP system that isthe market leader in our industry. We were looking at replacing it butwere told there wasn’t budget to do that. We identified some of thebiggest limitations and fixed those using Power Apps.”5 The Total Economic Impact Of Power Apps“We needed to switch to amobile-centric delivery modelto support merchandizers inthe stores. We also needed toget information back fromthem that didn’t require emailor driving back to the office.”Cloud services manager,beverage distribution
› The lack of internal and customer-facing applications hurtbusiness performance. Existing applications did not fully meet theneeds of employees or the increased desire for customer self-service.This resulted in low user satisfaction and hurt the business in terms ofinnovation and growth. One interviewee explained how Power Appswas needed as part of a larger digital transformation initiative: “Wewere trying to make employees more digitally adept so they can bemore relevant. Office 365 is at the center of this, and citizendevelopment takes it even further.”The top four adoption drivers from the survey included: Deliver more actionable insights. Reduce system complexity. Replace paper-based process steps. Address IT’s inability to keep up with development requests.Key ResultsThe interviews and survey revealed several key results from the PowerApps investment:› Power Apps streamlines activities and enables businesstransformation. Interviewees provided many examples of activitiesand of reworking old processes that no longer made sense in a mobilefirst world. This applies to Power Apps as a standalone solution, but itcan be even greater when coupled with Power Automate. Increasedstandardization also had a large impact. One interviewee said: “Lowcode is the best way to get something out quick and dirty. By far, thebiggest benefit is productivity. We can digitize and try things we nevercould before.”› Development in Power Apps saves money. The financial analysissection of the study includes many examples of cost savings. Theoverall reduction, including development and centralized ITmanagement costs, is 45%. One interviewee said: “We would not havebeen able to do any of this development work the old way. We couldnot have justified the investment. The Power Apps work we did wouldhave cost 750,000.”› IT organizations are now more responsive to business needs.Interviewees described how utilizing Power Apps helped them tocreate modern IT organizations that can deliver better and fastersolutions to the business. One interviewee said: “We can now buildonce and deploy to different places. The organization didn’t want toinvest in traditional application development anymore. We can nowmake changes on the fly and support a very dynamic business.”The top five business benefits from the survey included:› Improved IT team productivity.› Increased revenue.› Faster time-to-market with new products/services/solutions.› Better customer service.› Faster solution quoting.6 The Total Economic Impact Of Power Apps“Traditionally we could dosomething either right, fast, orcheap. With Power Apps, wecan do all three.”Cloud services manager,beverage distribution
Composite OrganizationBased on the interviews, Forrester constructed a TEI framework, acomposite company, and an associated ROI analysis that illustrates theareas financially affected. The composite organization is representativeof the five companies that Forrester interviewed, as well as the survey,and is used to present the aggregate financial analysis in the nextsection.The composite organization is a services company with 2,000 PowerApps users. Knowledge workers are predominantly on Office 365 E3licenses. First-line workers are on a mix of Office 365 E1 and F1licenses. These licenses give users access to Power Apps. There are 50users with premium licenses because they are building apps that requirepremium connectors into ERP solutions.7 The Total Economic Impact Of Power AppsKey assumptions2,000 Power Apps users33 development projects
Analysis Of BenefitsQUANTIFIED BENEFIT DATA AS APPLIED TO THE COMPOSITETotal BenefitsREF.BENEFITINITIALYEAR 1YEAR 2YEAR 3TOTALPRESENTVALUEAtrReduced applicationdevelopment costs 90,000 1,278,000 2,160,000 2,538,000 6,066,000 4,943,779BtrAvoided third-partyapplications 0 270,000 315,000 315,000 900,000 742,449CtrStreamlined activities 0 662,019 1,544,712 2,427,404 4,634,135 3,702,201Total benefits (risk-adjusted) 90,000 2,210,019 4,019,712 5,280,404 11,600,135 9,388,429Reduced Application Development CostsAll interviewees provided many examples of Power Apps reducingdevelopment cost and effort. The level of savings varies greatly based onthe scope of the development efforts. A large contributor to the effortreduction is using off-the-shelf connectors that are included with PowerApps — especially connectors into ERP systems. Interviewees sharedthe following regarding pro and citizen development efforts:The table above shows the total of allbenefits across the areas listed below,as well as present values (PVs)discounted at 10%. Over three years,the composite organization expectsrisk-adjusted total benefits to be a PVof nearly 9.4 million.› “In the first year, we saved 500,000 in external developer costs. Weexpect similar savings in future years. There is no shortage of projectsfor these tools because people are coming up with all sorts of ideas.”› “We built a warehouse picker app that was one simple screen. WithoutPower Apps, it would have cost us thousands of dollars to build. Wehave a lot of flexibility in testing ideas because the costs are so low.”› “We built an app as a PoC [proof of concept] in less than six weeks,including building some custom APIs. Most of it was done in .NET andC#. We could do this because the tools are so simple to use.”› “We were looking at custom development work for a corporatecommunications mobile app on [the two main mobile platforms]. Thecost from the vendor was getting out of control. We used the Microsofttools and completed it in one week. Otherwise, it would have takenmonths more. We threw away 70,000 in previous work and saved anadditional 30,000.”› “We just completed another substantial project for the wind generationpeople. The initial savings was 200,000 per year based on twomonths of development for 1.5 FTEs. We anticipate an additionalsavings of 1 million to 2 million per year as it is rolled out wider.”› “Low code is a huge benefit for UI [user interface] development ofsimple apps. It is 2x to 3x faster.”› “We conduct regular hackathons. A lot of ideas and apps come out ofthose.”› “Power Apps helps us avoid a lot of professional services forapplication development.”The survey asked about different IT-related cost savings. Ninety-four8 The Total Economic Impact Of Power Apps“A recent web app we builtwould have cost 3x to 4x moreusing traditional tools. That isa good, long-term ratio for costsavings.”Enterprise architect, powergeneration“The biggest benefit is thatnon-developers, both IT andbusiness, can build their ownsoftware.”Director, field services
percent of Power Apps users agreed that costs had been reducedbecause they are no longer “managing and maintaining multiplesolutions.” Ninety-one percent agreed that moving to the cloud hasenabled them to reduce costs.For the financial analysis, Forrester assumed:› The composite completes one development project using Power Appsas a PoC during the initial period. It completes eight more in Year 1,and IT and business users undertake 12 in Years 2 and 3.› The average development cost using traditional tools and a mix ofinternal and external resources was 175,000 per project. In the initialperiod, this was 100,000 because the PoC was a smaller scope.Subtracting the Power Apps development effort in the Analysis OfCosts section of the study provides the net benefit.Impact risk is the risk that the businessor technology needs of theorganization may not be met by theinvestment, resulting in lower overalltotal benefits. The greater theuncertainty, the wider the potentialrange of outcomes for benefitestimates.› An ongoing cost to manage and update code equal to 20% of thedevelopment cost also decreases.The avoided costs can vary greatly based on the number of developmentprojects that are completed with Power Apps as well as the scope. Costswill also vary depending on the mix of internal and external resources. Toaccount for these risks, Forrester adjusted this benefit downward by10%, yielding a three-year risk-adjusted total PV of 4.9 million.Reduced Application Development Costs: Calculation TableREF.METRICCALC.INITIALYEAR 1YEAR 2YEAR 3A1Number of development projects181212A2Average avoided traditionaldevelopment cost 100,000 175,000 175,000 175,000A3Reduced development costsA1*A2 100,000 1,400,000 2,100,000 2,100,000A4Reduced IT management andmaintenanceA3 [throughprevious year]*20% 20,000 300,000 720,000AtReduced application developmentcostsA3 A4 100,000 1,420,000 2,400,000 2,820,000Risk adjustment 10% 90,000 1,278,000 2,160,000 2,538,000AtrReduced application developmentcosts (risk-adjusted)Avoided Third-Party ApplicationsApplications built with Power Apps can replace existing and/or future,third-party applications that have license and maintenance costs.Interviewees provided several examples:› Replacement of an expense reporting solution that cost 25,000 peryear.› Avoided risk control application. “The solution under considerationwould have cost GBP 250,000 plus 20% maintenance and not fullymet our needs.”› A timesheet solution that cost GBP 25 per user per month.For the financial analysis, Forrester included an avoided riskmanagement solution and an avoided timesheet solution (for 1,0009 The Total Economic Impact Of Power Apps“Someone was going to buy atimesheet app that cost GBP 25 per user per month. Webuilt it in 50 days. There is atleast one example of this peryear.”Chief data officer, financialservices
employees) similar to the examples provided by the interviewees.Forrester encourages readers to think about existing third-partysolutions, such as the examples provided above, that could be retired orpossible future expenditures that could be avoided.The savings will vary depending on if the development effort replacesthird-party applications versus development of bespoke functionality thatwould have been built in-house. To account for these risks, Forresteradjusted this benefit downward by 10%, yielding a three-yearrisk-adjusted total PV of 742,449.Avoided Third-Party Applications: Calculation TableREF.METRICCALC.B1Timesheet application1,000 users* 25*12 monthsB2Risk and control application 250,000 [maintenance at20%]BtAvoided third-party applicationsB1 B2Risk adjustment 10%BtrINITIALAvoided third-party applications(risk-adjusted)YEAR 1YEAR 2YEAR 3 300,000 300,000 300,000 50,000 50,000 300,000 350,000 350,000 270,000 315,000 315,000Streamlined ActivitiesIncreasing user efficiency and effectiveness, along with the unquantifiedimproved business outcomes described later in this study, were the mostimportant benefits according to the interviewees. In this section,Forrester looked at specific business improvement examples thatinterviewees were able to quantify. The efficiencies gained vary basedon the existing business activities being streamlined with Power Appsand by a user’s role. Some examples include:› “We had a person driving around in one region collecting paper forms.That’s gone away.”› “The mileage reporting app we built is used by over 150merchandizers. That time savings alone is equivalent to 1.5 FTEsacross the company.”› “Salespeople are saving a lot of time through better insights. Twohundred out of 400 workers are saving time because they no longerhave to attach pictures to an Excel spreadsheet.”› “In one territory, three or four salespeople cut the time to completesurveys in half. That’s 30 to 60 minutes per week.”Power Apps survey respondents said that “line-of-business employeeproductivity” improved by 3.2 hours per week. For the financial analysis,Forrester assumed:› In total, three development projects are completed using Power Apps.Each project impacts, on average, 50 users.› The average time savings across all affected workers is 1.6 hours perweek, half of the survey findings to be conservative.› An average fully burdened cost (including all taxes and benefits) for allworkers across the composite organization is 90,000.10 The Total Economic Impact Of Power Apps“We were able to reduce thenumber of people writing upquotes from two to one in eachshop. We have 20 locations.”VP of IT and purchasing,industrial equipment servicing
Because this benefit was calculated from a productivity increaseperspective instead of an elimination of specific roles and headcount,Forrester adjusted it downward by 50% because not all time savingsresults in additional work being completed.Forrester encourages readers to think about how improved businessactivities can reduce costs in their organizations. Where possible, otherimproved business outcomes, which were not included in the financialanalysis, should be calculated.The benefit will vary based on how many workers are impacted, the sizeof the efficiency gains, and the type of workers. To account for theserisks, Forrester adjusted this benefit downward by 15%, yielding a threeyear risk-adjusted total PV of 3.7 million.Streamlined Activities: Calculation TableREF.METRICCALC.INITIALYEAR 1YEAR 2YEAR 3C1Total number of projects A1 [sumthroughcurrent year]192133C2Number of affected workersC1*50 workers504501,0501,650C3Hours saved808080C4Average hourly fully burdenedcost (rounded value shown)1.6 hours*50weeks[excluded from 90,000/2,080Initial Period]hours 43.27 43.27 43.27 43.27C5Total efficiency gainsC2*C3*C4 0 1,557,692 3,634,615 5,711,538C6Productivity capture50%50%50%50%CtStreamlined activitiesC5*C6 0 778,846 1,817,308 2,855,769Risk adjustment 15% 0 662,019 1,544,712 2,427,404CtrStreamlined activities (riskadjusted)Unquantified BenefitsInterviewees described other business benefits that were not included inthe financial analysis. This could be due to the fact that there was toogreat a variation, e.g., business transformation, or it was impossible toadd a realistic financial value to the business benefit, e.g., increasedemployee satisfaction.Improved Business OutcomesRelated to the efficiencies benefit described above, companies sharedmany examples of how the business is transformed and benefits fromPower Apps. This included making IT more of an enabler rather than anunintentional bottleneck and improving collaboration between IT andlines of business to increase innovation. Examples included:› “Overall service quality is getting better through standardized forms,and warranty claims are down. The work we have done [with PowerApps] is a part of this. So far, warranty claims are down 260,000 inthe first five months.”11 The Total Economic Impact Of Power Apps
› “We created a customer self-service portal so our salespeople can getreports faster. This resulted in better customer service and happiercustomers.”› “We are getting paid faster because reports are being generatedfaster.”› “These new apps allow us to react to critical out-of-stock events. Thismakes our customers happier, and they say that we care about theconditions of their stores.”› “We now provide better customer experiences. Our Net PromoterScore has gone up six to eight points since launching the WelcomeApp.”1The survey revealed the following business outcome related findings:“Time-to-market savings ishuge, but I can’t necessarilyquantify it. We’ve gone frompeople saying that we can’tdeliver anything on time to,‘Wow, this fast delivery time isexactly what we want.’”Enterprise architect, powergeneration› Power Apps helped reduce time-to-market for new products andservices from 21 months to 13 months.› Revenues increased by 4.3%.› Data input and user action errors decreased by 21.1%.Better Decision MakingMany of the pro
› Ongoing corporate IT management and development of Power Apps code and business user training costs 1.2 million. The effort to manage the Power Apps solution is very low at 0.1 FTE. The corporate IT department is also involved in maintaining and developing code. IT also spends time training business