Transcription
Developer Satisfaction Survey2017Summary Report8 January 2018 2017, 2018, International Game Developers Association igda.org
Developer Satisfaction Survey 2017 - Summary ReportAUTHORSJohanna WeststarAssociate Professor, DAN Department of Management and Organizational StudiesWestern University, Ontario, CanadaVictoria O’MearaPhD Candidate, Faculty of Media and Information StudiesWestern University, Ontario, CanadaMarie-Josée LegaultProfessor, École des sciences de l'administrationTÉLUQ, Québec, CanadaACKNOWLEDGEMENTSThe International Game Developers Association (IGDA) would like to thank the tremendoussupport of their actively engaged volunteer community for their contributions to this report.From all the survey respondents to the many Chapter and Special Interest Group leaders whohelped disseminate the survey, as well as studio affiliates and media partners – the IGDAappreciates your help in making this research possible.The authors would like to thank John R. J. Thompson for his research assistance.This research was made possible through a grant from the IGDA Foundation.1 Page
Developer Satisfaction Survey 2017 - Summary ReportCONTENTSAUTHORS . 1ACKNOWLEDGEMENTS . 1CONTENTS . 2INTRODUCTION. 4OVERVIEW . 5DEMOGRAPHICS . 8Snapshot: Country of Origin & Country of Work . 8Snapshot: Marital Status . 8Snapshot: Children & Elder Care . 8Snapshot: Educational Background . 10Snapshot: Specialized Degree in a Game Related Discipline . 10DIVERSITY . 11Snapshot: Age . 11Snapshot: Gender. 11Snapshot: Race/Ethnicity/Ancestry . 11Snapshot: Sexual Orientation . 12Snapshot: Disability . 12Snapshot: Attitudes toward Diversity . 12Snapshot: Discrimination . 13TRENDS AND OUTLOOK ON THE GAME INDUSTRY . 15Snapshot: Game Genres . 15Snapshot: Important Platforms for the Future . 15Snapshot: Common Distribution Platforms . 16Snapshot: The Future of Game Development . 17Snapshot: Localized Versions of Games . 17Snapshot: Society’s Negative Perceptions of Industry . 17Snapshot: Preferred Employer . 18EMPLOYMENT OVERVIEW . 19Snapshot: Employment Status . 19Snapshot: Games as Primary Business . 19Snapshot: Employment Volatility . 19Snapshot: The Unemployed . 20A PROFILE OF EMPLOYEES . 20Snapshot: Demographics . 202 Page
Developer Satisfaction Survey 2017 - Summary ReportSnapshot: Experience and Job Security . 20Snapshot: Company Type . 21Snapshot: Job Role . 21Snapshot: Company and Team Size . 21Snapshot: Salaries . 22Snapshot: Incentives and Overtime . 22Snapshot: Benefits and Time Off . 22Snapshot: Hours of Work . 23Snapshot: Career Path and Advancement . 23A PROFILE OF FREELANCERS/CONTRACTORS . 24Snapshot: Demographics . 24Snapshot: Experience and Job Security . 24Snapshot: Company Type . 25Snapshot: Job Role . 25Snapshot: Company Size and Composition . 25Snapshot: Salaries . 25Snapshot: Incentives and Overtime . 26Snapshot: Benefits and Time Off . 26IP and Credit . 26Hours of Work . 26Snapshot: Why Freelance? . 27A PROFILE OF THE SELF-EMPLOYED . 28Snapshot: Demographics . 28Snapshot: Experience and Job Security . 28Snapshot: Company Type . 29Snapshot: Job Role . 29Snapshot: Company Size and Composition . 29Snapshot: Salaries . 30Snapshot: Incentives and Overtime . 30Snapshot: Benefits and Time Off . 31Snapshot: Benefits and Time Off for Employees . 31Hours of Work . 31CONCLUSION . 32LIMITATIONS AND NEXT STEPS . 343 Page
Developer Satisfaction Survey 2017 - Summary ReportINTRODUCTIONAs part of its mission to support game developers around the world, the IGDA regularly conducts aDeveloper Satisfaction Survey in partnership with Western University and TÉLUQ. We’re releasing theresults from our fifth survey, conducted in the first quarter of 2017, and while we’re encouraged to seepositive movement in some areas, the DSS should be troubling for every person who loves the creation,business, or play experience of games.Game developers continue to recognize the need for diversity in the workplace, in the industry, and ingame content, with developers scoring these items as important in higher rates than ever before.However, while the overwhelming majority of game developers recognize the importance of diversity,game development as a profession can still be unwelcoming, with half of survey respondents assertingthat they do not believe there is equal treatment of developers, and half of respondents witnessing orexperiencing inequity.Also concerning are the statistics around tenure in the industry, number of employers over the past fiveyears, and intent to stay with current employers. Respondents report an average of 2.2 employers inthe past 5 years, and self-employed contractors report working the most hours and also receiving theleast compensation. Put simply, game development is at risk of losing the most experienced talent inthe industry, and without proper support and protection, freelancers may bear the burden of theindustry’s changing talent profile.The results of the DSS are a call to action for the IGDA, and for game developers around the world. Ibelieve that there is a greater need for the IGDA than ever before, both to support developers as theymanage their careers and to advocate on issues that impact developer satisfaction and the quality of thegames that we create.Using data from the DSS and our members, studio affiliates, and partner affiliates as a guide, the IGDAwill expand its programs in 2018 to help game developers find long-term satisfaction in their chosencareers, including expanded professional and personal support for individual developers, studios, andour 150 Chapters and Special Interest Groups.I hope that you’ll join us as we continue to work towards a better industry for game developers aroundthe world, and to support fulfilling and sustainable careers in game development for anyone with thedesire and aptitude to pursue it.Jen MacLeanExecutive Director, IGDA4 Page
Developer Satisfaction Survey 2017 - Summary ReportOVERVIEWThe 2017 IGDA Developer Satisfaction Survey was live from February to March, 2017. Itaccrued 963 valid responses.The survey was targeted broadly and captured responses from people with variousconnections to the industry (Table 1). Most of the survey respondents said that they makegames in core creation or development roles. This was followed by a smaller proportion whomake games as a portion of their work (i.e., academics, those in transmedia companies,students concurrently making games). A third group of respondents work in studios insupportive or ancillary roles to game creation. These three respondent groups were askedthe most survey questions regarding the nature of their work and form the core of thisreport. Other respondents answered select question sub-sets (i.e. for students or theunemployed) and/or answered general questions about demographics, diversity and industrytrends.Table 1: What is your connection to the game industry?% of respondentsMakes games in a core development role (includes QA)64.8Portion of work is games-related or to make games (includes academics who makegames); or makes games for commercialization on the side14.4Supports the development of games in administrative, support or ancillary rolesthat are not game creation (e.g., admin, HR, technical support)8.9Currently unemployed3.5Looking for first job in the industry3.1Makes games as a hobbyist1.6Academic studies/teaches about the game industry1.2Fine artist using games as a medium0.9Involved in the production of game-related events0.7Game journalist or critic0.7External investor0.4Total100Student studying to make games or about games/game industry16.5*Source: IGDA DSS 2017;*Studentscounted separately; those working on games for pay or goal of pay are included in main figures here5 Page
Developer Satisfaction Survey 2017 - Summary ReportMost answered the survey in English (71%). Other languages were represented as follows:Taiwanese Chinese (20%), Japanese (2%), Spanish (2%), German (2%), French (1%), SimplifiedChinese (1%), Italian ( 1%).A large portion of respondents were working in the United States (42%) and participantsfrom North America make up more than half the sample. While North America plays a largerole in the global video game industry, developers in this part of the world are likelyoverrepresented in the picture painted here while some important regional and nationalvariation cannot be summarized accurately. The distribution of the sample on someadditional key dimensions are included in Table 2.This report is a summary of the primary observations from the 2017 survey data and, outsideof a few select occasions, does not attempt to compare this data to prior IGDA surveys. Thefirst part of the report includes sections answered by all respondents: Demographics,Diversity, Education, and Business Trends and Future Outlook. The second part of the reportpaints a profile of the work experiences of particular groups of workers who are makinggames for pay (employees, freelancers, and the self-employed) as well as the currentlyunemployed and students.6 Page
Developer Satisfaction Survey 2017 - Summary ReportTable 2: Key Sample Characteristics% of respondentsCompany Typest9nd24rd3 Party19Independent33Other141 Party2 PartyCompany Size 103811-501851-1009101 udio3QA2Admin4Other5Employment TypeEmployee66Self-employed19Freelancer10Source: IGDA DSS 20177 Page
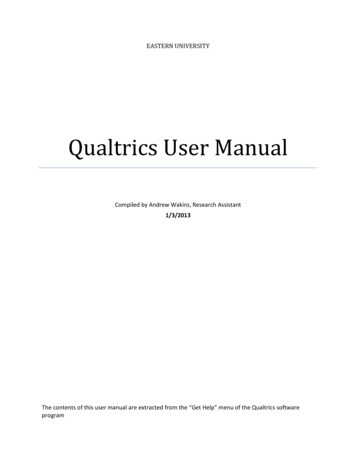
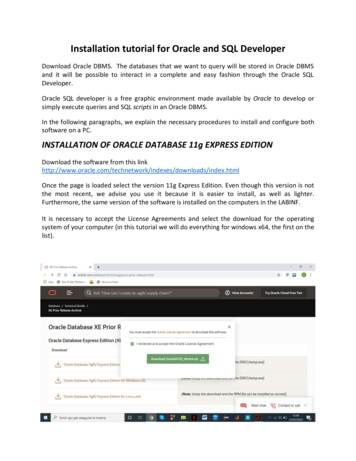
Developer Satisfaction Survey 2017 - Summary ReportDEMOGRAPHICSThis data presents the prototypical game industry worker as being a 32 year old white malewith a university degree who lives in North America and who does not have children. Moredemographic characteristics are discussed in the diversity section below.Snapshot: Country of Origin & Country of WorkMany respondents were born in the United States. They made up 40% of the sample (Figure1). Canada had 9%, and Mexico had less than 1%, bringing the overall North Americanrepresentation to 49%. Asia represented 22% of survey respondents with Taiwan listed as thesecond most common country of birth (16%), overall. It should be noted that there wassignificant engagement with the survey from the Taiwanese game development communitythis year; a volunteer translated the survey into Taiwanese Chinese and this with publicitythrough localized networks greatly increased participation from that region. Europeaccounted for 19% of respondents, Australia and Oceania accounted for 5%, Latin America(including Mexico) made up 4%, and Africa represented 1%.Many respondents also worked in the United States (42%). This was followed distantly bythose working in Taiwan (15%), Canada (10%) and Australia (4%). Country of work is shownalongside country of origin in Figure 1 to give a rough indication of the international mobilityof game developers. For the most part national labour markets seem to be serving their ownpopulations. Only 14% of respondents consider themselves to be immigrants. Somecountries, such as the US and Canada seem to import game developer labour while others,such as the United Kingdom and Germany seem to export labour.Snapshot: Marital StatusSlightly more respondents reported being married or partnered (50%) than single (44%).Another 4% were separated or divorced and 3% responded ‘Other’.Snapshot: Children & Elder CareOnly 29% of respondents had children. Most said they had school aged children (13%), orpre-school aged children (12%), while 5% said they had adult children. Note that thesestatistics include respondents who said they were students in the game industry. The rate ofchildren among employed developers is higher (see employment profiles below).Most were not responsible for elder care (84%). There was, however, a notable group of 16%that was responsible for their older family members who either lived with them or livedseparately.8 Page
Developer Satisfaction Survey 2017 - Summary ReportFigure 1: Countries of Origin and Work (rounded to nearest 0.5%)United Austria12.52.53.5GermanyUnited Kingdom2Japan22Finland21.5New Zeland132Sweden1.50.5Poland1.51The Netherlands11Denmark11Peru0Country of workCountry of origin14Other05510152025% of respondents30354045Source: IGDA DSS 2017Note: Country included if it represented 1.0% or more of the respondents for ‘Country of Work’9 Page
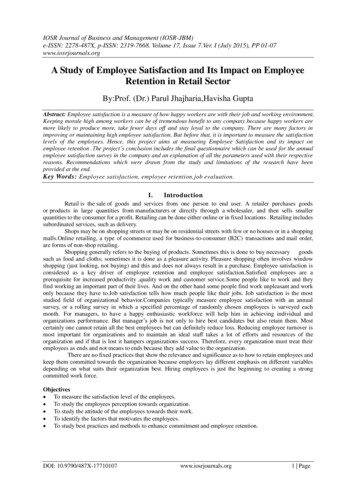
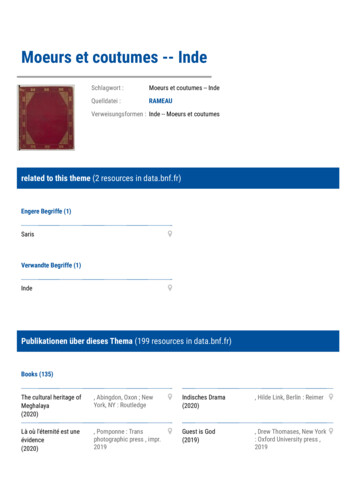
Developer Satisfaction Survey 2017 - Summary ReportSnapshot: Educational BackgroundWith the increase in formal academic programs targeted to game development studies, it isnot surprising that people who work in the game industry are highly educated. A full 95% ofrespondents had some college/vocational/trade school or above (Figure 2). The remaining5% had professional certification, an apprenticeship or less than college.Figure 2: Highest Educational ge11%Some postgraduate6%Someuniversity9%University42%Source: IGDA DSS 2017Snapshot: Specialized Degree in a Game Related DisciplineNearly one half of survey respondents (44%) had a specialized degree that was somewhatrelevant to game development and another third (34%) had a degree that was directlyrelated to game development. The remaining 22% had educational backgrounds that theysaid were not relevant to game development. It is important to remember that a number ofsurvey respondents did not work directly in game development, but rather worked inoccupations related to the game industry more broadly.Aside from a degree or diploma, half of the respondents had also taken supplementaltraining in game development, including courses at the high school (4%), college (8%),university (10%), and post-graduate (6%) levels, professional certifications (10%), internships(9%), as well as training by their employers (10%). An additional 2% said they had completedonline courses for their game related training. Half of the group reported that the trainingwas accredited in some way.10 P a g e
Developer Satisfaction Survey 2017 - Summary ReportDIVERSITYRespondents were instructed when taking the survey to “consider diversity in terms ofdemographic characteristics such as sex, gender, race, ethnicity, sexual orientation, etc.”Throughout this section we occasionally make reference to US population statistics. Peoplewho were either born in the US (40%) or who worked in the US (42%) made up a largeportion of the DSS 2017 sample. However, it is important to note that the populationdistribution in the other countries represented in this data will differ quite substantially andmany who would be identified as minority groups in the North American or WesternEuropean context would not be so in their country of origin (recall for instance that only 146identified as immigrants and there was a large group of respondents who were born in andworking in Taiwan).Snapshot: AgeSurvey respondents ranged in age from 18 to 67. The 30 to 34 age bracket made up 24% ofthe sample, followed by the 25 to 29 age bracket (20%). Only 17% of respondents identifiedas being in their 40s and 5% said they were older than 50 years. This is strikingly differentfrom the general labour force in the US (mean age 42) and other industrialized countries.Note that this statistic includes students but they are a small proportion of the sample. Seethe employment type profiles below for the average age of employed developers.Snapshot: GenderSurvey respondents were predominately male (74%). Only 21% identified as female, 2%identified as male to female transgender and fewer than 1% identified as female to maletransgender. An additional 2% selected ‘Other’ as their response. This is in contrast to thebiological sex distribution of the 2016 United States Census where 49% were reported menand 51% were reported women. The US census only considered biological sex; however arecent study from the University of California estimated that 0.6% of adults in the US aretransgender.Snapshot: Race/Ethnicity/AncestryThe majority identified as white/Caucasian/European at 68%. Respondents were able toselect up to 3 options for this question. As such, when respondents who only selectedwhite/Caucasian/European were calculated this statistic dropped to 61%. The next mostfrequently selected category was East/South East Asian (18%), followed by Hispanic or Latino(5%). Pacific Islanders constituted 3% of respondents, Arabian or West Asian made up 2% ofrespondents, Aboriginal or Indigenous peoples also represented 2% of the group, and11 P a g e
Developer Satisfaction Survey 2017 - Summary ReportBlack/African American or African made up 1%. This is inconsistent with the 2016 US censusdata which reported that 61% of the US population was white, 13% was black, 18% wasHispanic, and 6% was Asian.Note that the decreased percentage for white/Caucasian/European developers (from 81% in2016) and the rise in respondents from East/South East Asia (from 8% in 2016) should not beinterpreted as a rapid decline and a rapid rise in these populations among game developers.Rather these statistics mean that more people from East/South East Asia took the survey in2017 (which we can confirm due to the high response rate from Taiwan and the knownengagement of that population with the survey this time around). Therefore, they contributeto a larger percentage of the total sample of participants. This is a limitation in surveyresearch when the total population is not known and we cannot engage in non-randomsampling that would be representative of each group or region.Snapshot: Sexual OrientationRegarding sexual orientation, 81% of respondents identified as heterosexual, 5% ashomosexual, 11% as bisexual and 3% as other. These numbers are slightly higher thanreported statistics for the United States where an estimated 3.5% of adults identify aslesbian, gay or bisexual.Snapshot: DisabilityIn the 2017 DSS, 25% of respondents identified as having a disability. The most frequentlyselected category of disability was psychiatric or mental illness (7%). The next two mostcommonly selected categories were visual impairment (4%) and intellectual or learningdisability (3%). This is slightly higher than the total population, where 19% of adult Americanshave some type of disability.Snapshot: Attitudes toward DiversityThe number of respondents who felt that diversity in the workplace was very or somewhatimportant was at its highest in the history of the DSS; 81% of respondents felt that it was‘very important’ or ‘somewhat important’ compared to 78% in 2016, 63% in 2015 and, 75% in2014. Similarly 84% felt that diversity in the game industry was important, compared to 80%in 2016, 66% in 2015, and 79% in 2014. Slightly less than half of respondents (42%) felt thegame industry had increased in diversity over the past two years. This is a small decreasefrom 2016 where 47% felt that the industry had become more diverse in the two years prior.One third (33%) reported that diversity had stayed the same. This is consistent with the 2016and 2015 data (30% and 31% respectively). A small group felt that the industry had becomeless diverse (3%), and this was the same in 2016 and 2015 (3% and 2% respectively). The ‘not12 P a g e
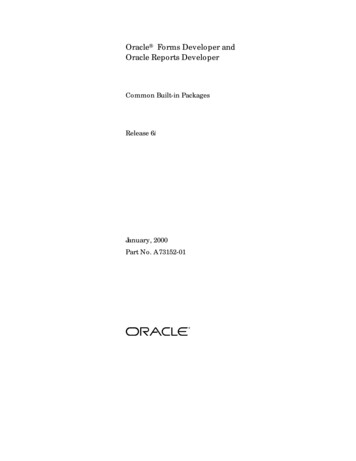
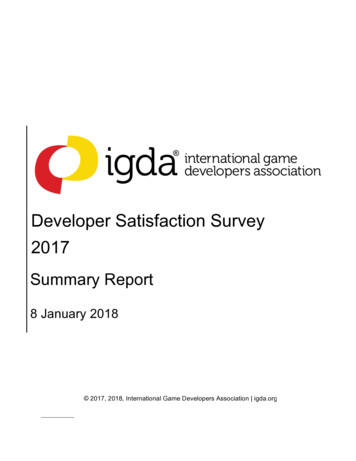
Developer Satisfaction Survey 2017 - Summary Reportsure’ option was selected by 22% of respondents, a slight increase from 2016 (19%), althoughmuch less than 2015, where 30% were unsure.Diversity in game content was also deemed important; 85% of respondents indicated that itwas either ‘somewhat’ or ‘very’ important to the game industry compared to 82% in 2016and 71% in 2015.Snapshot: DiscriminationFourteen percent of respondents reported that their company had no policies whatsoeverdirected toward diversity or equality. Among those whose company did have some form ofpolicy, most said that their company had a ‘general non-discrimination policy’ (57%), an‘equal opportunity hiring policy’ (49%) or a ‘sexual harassment policy’ (48%). Only 26% saidthat their company had a ‘formal complaint procedure’, and 21% reported a ‘formaldisciplinary process’ related to equality and diversity policies. These numbers were similar in2016. It is also worth noting that one quarter of respondents (25%) did not know if theircompany had these or other types of diversity related policies.That said, only about half of respondents felt that these policies were adequately enforced(56%), and another 34% were not sure. The efficacy of these policies or other informalinitiatives is also called into question by responses to the question, ‘Do you feel there is equaltreatment and opportunity for all in the game industry?’ In the 2017 DSS, 50% ofrespondents answered ‘no’, 33% said ‘yes’, and 17% were not sure. This was a slightimprovement over the 2016 data, where 58% answered ‘no,’ and only 26% answered ‘yes’.Figure 3 shows the responses to two questions that asked, ‘Have you perceived inequitytowards yourself or towards others on the basis of gender, age, ethnicity, ability, or sexualpersuasion in any of the following areas?’ Similar to 2016, the majority of respondents (56%and 44%, respectively) answered ‘none’ to both questions. Of those who did report inequitytowards themselves or others, social, or microaggressions were the most commonly reported(see Figure 3 below). Overall, respondents reported witnessing inequity towards others atgreater rates than directly experiencing it themselves.13 P a g e
Developer Satisfaction Survey 2017 - Summary ReportFigure 3: Perceptions of Inequity toward Self and Others% of respondents605056Perceived inequity toward YOURSELF44Perceived inequity toward OTHERS403130202120121310129181320213221138128 92 10% of respondentsSource: IGDA DSS 201714 P a g e
Developer Satisfaction Survey 2017 - Summary ReportTRENDS AND OUTLOOK ON THE GAME INDUSTRYSnapshot: Game GenresAction games were the genre being developed the most across those who identified as beingemployees (49%), self-employed (52%), and freelancers/contractors (43%). The second mostselected genre differed across employment type. Among employees this was strategy games(34%), among the self-employed this was casual games (40%), and among freelancers thiswas role-playing games (38%).Table 3: Game Genres Being Developed by Employment Type% Respondents by Employment TypeEmployedSelf-EmployedFreelance/ContractAction Game505243Action Adventure262718Adventure Game193133Role Playing Game293538Sports Game13618Strategy Game343620Simulation Game202530Serious Game121633Casual Game324035Art Game51215Party Game8713Exercise Game325Other868Source: IGDA DSS 2017Snapshot: Important Platforms for the FutureWhen asked to rank the importance of a long list of development platforms to the futuregrowth of the game industry, PC was selected as ‘very important’ by the most respondents;consoles, and both Android and iOS devices followed. The top ten responses were similar in2016 and 2017 with one exceptio
that are not game creation (e.g., admin, HR, technical support) 8.9 Currently unemployed 3.5 Looking for first job in the industry 3.1 Makes games as a hobbyist 1.6 Academic studies/teaches about the game industry 1.2 Fine artist using games as a medium 0.9 Involved in the production of game-related