Transcription
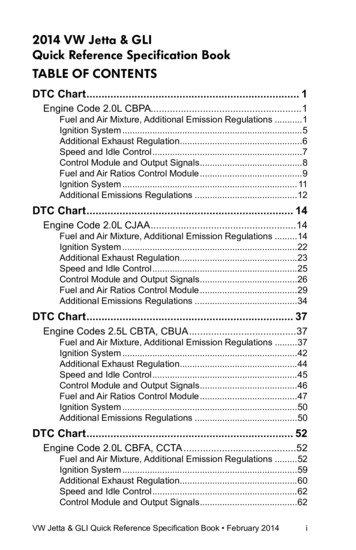
QUIC K RE F E REN C E C AR DSelecting the RUNiconwill allow you to performgeneral computations andarithmetic.“The Basics” Reference Cardfx-9750GIICASIOfx-9750 SeriesThe function keys allow you toaccess the tab (soft key) menus thatwill come up at the bottom of theappears abovescreen. When anthe ukey, selecting u will offermore on-screen choices.The pkey displays every mode thecalculator has. To select a mode,you may B to the desired iconand press l or press the number orletter in the lower right hand cornerof the icon.The d key operates like the backarrow on a web browser; it will takeyou back one screen each time youselect it. The d key will not takeyou to the icon menu.The x key is a toggle key that willchange answers or entered numbersback and fourth from decimal tofraction form.The O key will power the unit on.To turn the unit off, press the yellowLkey, then Okey.The z key is used to obtain afraction bar. To obtain a mixednumber, press z after inputtingthe whole number.The l key executes operations.When data is entered, the l buttonmust be pressed to store the data.
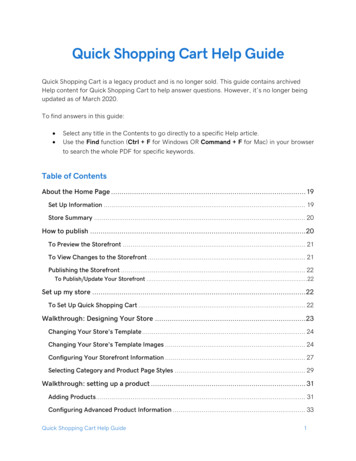
BASIC F U NC TI O NAL IT Y“The Basics”fx-9750GIICASIO fx-9750GIIThe following explains the meaning of each icon on the fx-9750GII main icon menu.ICONMenu NameDescriptionRUNThis icon menu is used for general computations, includingbinary, octal, decimal, and hexadecimal functions and matrices.STATISTICSThis icon menu is used to perform single-variable (standarddeviation) and paired variable (regression) statisticalcalculations, to perform tests, to analyze data and to drawstatistical graphs.GRAPHThe icon menu is used to draw, store and calculate informationof functions.DYNAMICGRAPHThis icon menu is used to draw multiple versions of a graph bychanging the values in a function.TABLERECURSIONCONICSEQUATIONThis icon menu is used to store functions, to generate a numerictable of different solutions as the values assigned to variables ina function change, and to draw graphs.This icon menu is used to store recursion formulas, to generate anumeric table of different solutions as the values assigned to thevariables in a function change, and to draw graphs.This icon menu is used to graph parabolas, circles, ellipses, andhyperbolas. You can input a rectangular or polar coordinatefunction or a parametric function for graphing.This icon menu is used to solve linear equations with twothrough six unknowns, and high-order equations from 2nd to 6thdegree.PROGRAMThis icon menu is used to store programs in the program areaand to run programs.TIME VALUEOF MONEYThis icon menu is used to perform financial calculations and todraw cash flow and other types of graphs.DataAnalyzerLinkThis icon menu is use to control the optionally available EA-200Data Analyzer. For information about this icon menu, downloadthe E-CON2 manual from http://edu.casio.com.LINKThis icon menu is used to transfer memory contents or back-updata to another unit or PC.MEMORYThis icon menu is used to manage data stored in memory.SYSTEMThis icon menu is used to initialize memory, adjust contrast, resetmemory, and to manage other system settings.1
RUNThis section is an overview of the RUN·MAT Icon. To select an icon from the icon menusystem, use the ! BNto highlight the desired icon, then press l or press thenumber/letter in the lower right corner of the icon. For the Run menu, press 1to displaythe initial Run screen.1.When performing general computations, select z to enter fractions and mixed51numbers. To solve the problem 2 input the following:83 5z8 2z1z3l2.To change the answer3.To change the answer to decimal form, press x. x is a toggle key that willswitch entered data or answers from fraction to decimal form or decimal to fractionform.4.To change the number of decimal places displayed, enter the set up menu bypressing Lp. Nto Display, select q(Fix) and enter the desired amount ofdecimal places followed by l. For this example, 3 decimal places are used. 71to a mixed number, press LxX.24LpNNNNNNNNNNNq3ldlxCasio “The Basics fx-9750GII”3
From the Run menu many calculations can be entered by selecting i. For example:hyperbolic, probability/distribution, numeric (including differential and integration),conversion, engineering, complex number and binary, octal, decimal and hexadecimalcalculations.5.To calculate the possible number of different arrangements using 4 items selectedfrom among 10 items, enter the following from the Run home screen: iue10w4lNote: The fixed decimal setting was changed back to Norm1.6.To calculate 103 2 , enter the following from the Run home screen: iewjn10 3 2klNote: Calculations can be performed with complex numbers andanswers can be displayed in a bi form.7.To calculate 3 4i ; enter the following from the Run home screen: 8.iewj3 4qklTo calculate ( 3 2i) 15i ; enter the following: iejn3 2qk 15qlCasio “The Basics fx-9750GII”4
GRAPHVarious icon (Run, Table, Dynamic, Recursion & Conics) will allow you to graph or analyzethe graphs of given information. This section is an overview of the GRAPH Icon and willhighlight some basic features of this mode.The initial screen allows immediate input of function set equal to zero. You may begininputting data into Y1: and press lto store. To draw your function, select u.You can change the type of graph (r polar coordinate, parametric functions, x , and xand y-inequalities) by select the corresponding function button and then press the tobegin inputting information.1.To draw the graph of the function y 2x 2 5x 3 from the Icon Menu system, inputthe following: 32fs-5f-3lTo analyze features of this graph (roots, maximum and minimums, y-intercepts,intersections, determine coordinates, and integrals) select y(G-Solve).2.Note:q(Root):The left-most root will always display first. Select to display the nextroot.Casio “The Basics fx-9750GII”5
3.Note:e(Minimum):As long as the x-value of your vertex is in the viewable domain; you do notneed to see the vertex to calculate the minimum value. However, you canchange the viewing window by selecting ein the graph window. You canalso change the window manually by using the! BN.4.r(y-intercept):5.q(y-calculation):What is the value of y when x is 5 ?6.w(x-calculation):What is the value (s) of x when y is 1?7.e(integral): Determine the integral value at (0,3) for the function Y 1 2x 2 5x 3 .Casio “The Basics fx-9750GII”6
TABLEThe section is an overview of the TABLE Icon. To select this icon, you may highlight it andpress lor press 5.The initial screen allows immediate input of functions that are set equal to 0. To changethe type of expression to be entered, select wfor polar coordinates, efor parametricfunctions or rto change a previously entered function to an inequality.1.To see a table for the function y 2x 4 , highlight Y1: and input the following32z3f-4lu2.The default setting for tables is: X starts at 1, ends at 5, and increases by incrementsof. You change this by pressing dor q(FORM) to return to the initial screenand then select y(SET).3.However, you can manually enter a number anywhere in the x-column of the tableand presslto see the corresponding y-value (including fractions, decimals, even ). You can insert and delete rows in this view by pressing e(ROW).4.From the table view screen, you can press y(G-CON) to see a linear graph oru(G-PLT) to see a plot graph for the function you entered.Casio “The Basics fx-9750GII”7
5.To see a split screen of your table and graph, press Lp to enter the setupmenu for the table icon and Nto Dual Screen, select q(T G), d, and thenu.Casio “The Basics fx-9750GII”8
STATISTICSThis section is an overview of the STAT icon; it will highlight just a few of the features forsingle-variable data and paired-variable data. To select this icon, you may highlight it andpresslor press2.The initial List Editor Screen that allows input of statistical data and performs numerousstatistical calculations. To input a list of single-variable data, highlight the first cell underList 1 and enter each number followed by l.1.For this example, input this set of data: 1, 0.5, 1.2, 4, -1, 1, 3, 5, 6, 3.42.From this screen you display various graphs depending on whether you single orpaired-variable data (scatter-plot, line, normal probability, histogram, median box,mean box, normal distribution, broken line, and regression: linear, quadratic, cubic,quartic, logarithmic, exponential, power, sinusoidal and logistic).3.The initial default graph is a scatter-plot. To change the type of graph you wouldlike to use, press q(GRPH), then u(SET), Nto Graph Type:, for this set of data,we will make a histogram, press u, and then qfor histogram.Casio “The Basics fx-9750GII”9
4.Press dto take you back to your list of data and select q(GPH1) and then ltosee your graph.5.The following screen shots show what one-variable calculations can be obtained bypressing q.6.To delete this set of data, press duntil you return to the initial List Editor screen.Select ufor more options, arrow up until List 1 is highlighted, select r(Del-A),then q.7.For paired variable data, use the following:List 1:List 2:0.5, 1.2, 2.4, 4.0, 5.2-2.1, 0.3, 1.5, 2.0, 2.4Enter List 1 first, and then to begin entering List 2.8.To see a scatter-plot of these data, you can go through and change back GPH 1using the process above, or select w(GPH 2) from the List Editor screen whosedefault is also a scatter-plot.Casio “The Basics fx-9750GII”10
9.From the scatter-plot screen, pressing qwill show all the calculation that can beobtained from this set of data.10.To calculate linear regression, select wfrom the first set of options and then pressqfor y ax b form.11.From this screen, you select y(COPY) to copy and then paste the equation intothe initial graph screen or select u(DRAW) to show the linear regression.Casio “The Basics fx-9750GII”11
EQUATIONThis section is an overview of the EQUATION Icon. To select this icon, highlight it andpress l or press 8.The initial Equation Editor screen has three modes to choose from, Simultaneous,Polynomial, and Solver; this section will give an overview of each mode.The Simultaneous mode allows you to solve simultaneous linear equations with two to sixunknowns.1. Solve the following system of equations: 4x y 2z 1 x 6y 3z 1 5x 4y z 7 Press q to select the Simultaneous mode and press wfor three unknowns. Thecalculator will display a matrix where the coefficients and constants can be enteredin to as long as each equation is in standard form. To enter this system of equations(already in standard form) input the following: 4l1ln2ln1l 1l6l3l1l n5l4l1ln7lThere are four options at the bottom of the screen, press q(SOLV). The solutionto this system is (1, -1, 2).Casio “The Basics fx-9750G12
Press dto return to the previous screen, press q(REPT) to edit this problem orcontinue solving simultaneous equations with three unknowns. To edit just one of thenumbers in the system, arrow to the number to be edited and press r(EDIT) or highlightthe number to be edited and input the new number, then press l.Press duntil the Equation Editor screen is displayed. The second mode is Polynomialw and can be used to solve high-order equations (in standard form) from the 2nd to the6th degree.2.To solve the equation x3 – 2x2 – x 2 0, input the following: ww1ln2ln1l2lq3.4.To change the equation to x3 2x2 3x 2 0, select q(REPT) and change the bvalue to 2, the c-value to 3 and press q(SOLV).The default setting is for real numbers, to change the display to a bi form, pressLp for the Polynomial Set-Up menu, select w(a bi), d, and thenq(SOLV).The third function, Solver e, allows you to determine the value of any variable in aformula or equation. You can input any formula exactly as it appears using a for anyvariables. We will take a look at solving a linear equation and a formula.5.To find the value of x in the following equation, 2(x 5) 3x 2, input thefollowing starting from the Equation Editor Screen: e2jf-5kL.n3f 2luCasio “The Basics fx-9750GII”13
In the last screen, “Lft” and “Rgt” represent the values of the left and right sides that havecalculated using the solution; this is the calculator’s way of checking the solution.You can also enter a formula, assign values and solve for specific variable using the Solverfunction of the Equation Editor.6.Find the radius (to the nearest hundredth) of sphere, whose volume is 3705.97 cm3.4To enter the formula V r3 input the following in to the calculator:3 qBa2L.4z3Lca6 3lNote: Selecting q will take you back to the previous screen where you can edit and resolve the previous equation or begin a new problem.Casio “The Basics fx-9750GII14
CONICSThis section is an overview of the CONICS Icon. To select this icon, you may highlight itand press l or simply press 7.The initial screen allows you to choose from various conic functions, including rectangular,polar or parametric form. You may use the BNto select the equation of the function inaccordance with the type of graph you want to draw. Once you have chosen the conicfunction that you would like to graph, you will need to enter the coefficients of thefunction and then press DRAW u.1.To view the graph of the conic: y 2x 2 5x 3 , select the Y AX 2 BX C formfrom the Conics formula menu.In the Conics modes, when you press y(G-Solv), although you are still graphing aparabola like in the graphing section, notice how the vocabulary and options havechanged.2.For example, you can now examine the line of symmetry for this parabola and theequation of that line will be displayed.You can continue to analyze different areas of this graph and the line of symmetrywill still be displayed.Casio “The Basics fx-9750GII”15
fx-9750GII. QUICK REFERENCE CARD “The Basics” Reference Card CASIO . fx-9750. Series . The. O. key will power the unit on. To turn the unit off, press the yellow . L. key, then Okey. The. l . key executes operations. When data is entered, the . l . button must be pressed to store the da