Transcription
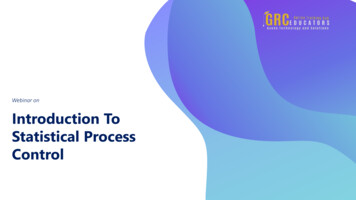
Webinar onIntroduction ToStatistical ProcessControl
Learning ObjectivesKnow how variation (as reflected by theprocess standard deviation) and accuracy(process mean) affect quality, and howthese parameters are reflected visually onSPC charts. Undesirable changes in theprocess are often announced by pointsoutside the control limits long before theycan result in the production ofnonconforming work.SPC tells us when the process needsadjustment, and when it should be leftalone. This allows production workers toreact to processes that are out of controlbut avoid over-adjustment (tampering) ofprocesses that are performing correctly.
Apply the concept of the rational subgroupto ensure that the sample reflects all thevarious sources in the process. Batchprocesses and autocorrelated processes doNOT meet the underlying assumptions andmust be treated appropriately.Know how to handle processes that do notfollow the normal (bell curve) assumption.Textbook control charts will often haveexcessively high false alarm risks for suchprocesses. Generally accepted methodsare, however, available for such processesto create control charts whose false alarmrisks are the same as Shewhart controlcharts for normally-distributed qualitycharacteristics.
This webinarwill introduceattendees tothe foundationsof statisticalprocess control(SPC), includingthe effects ofvariation andaccuracy onprocess quality.PRESENTED BY:William A. Levinson, P.E.,FASQ, CFPIM is the principalof Levinson ProductivitySystems, P.C. He is an ASQCertified Quality Engineer,Quality Auditor, QualityManager, ReliabilityEngineer, and Six Sigma BlackBelt, and the author ofseveral books on quality,productivity, andmanagement.On-Demand WebinarDuration : 60 MinutesPrice: 200
Webinar DescriptionThis webinar will introduce attendees to the foundations of statistical processcontrol (SPC), including the effects of variation and accuracy on process quality.The definition of a Six Sigma process will be illustrated. Attendees will learnhow to construct SPC charts that provide visual controls (easily understoodsignals) that tell production workers when the process requires adjustment toprevent the manufacture of nonconforming work. The issue of non-normal(non-bell-curve) processes also will be addressed with control charts thatreflect accurately the underlying statistical distribution.Attendees will receive a Visual Basic control chart simulator that works inWindows 7 (it has not been tried in other versions) that illustrates variation andaccuracy side by side with the corresponding control charts. This is useful forteaching the underlying concepts to production workers and technicians veryquickly.Statistical process control (SPC) is a widely used and well-established qualitymanagement method whose purpose is to detect undesirable process changesand allow corrective action before the process generates nonconforming work.It is a basic part of the body of knowledge for the quality managementprofession, and it is sufficiently important in the automotive sector that theAutomotive Industry Action Group publishes a manual on the subject. Mostreferences omit, however, the issue of non-normal (non-bell-curve) processesthat do not follow the textbook normality assumption, although the AIAGmanual does address this issue.
Who Should Attend ?Quality engineers, technicians, andinspectors with responsibilities forstatistical process control.
To register please 740 870 0321
Statistical process control (SPC) is a widely used and well-established quality management method whose purpose is to detect undesirable process changes and allow corrective action before the process generates nonconforming work. It is a basic

