Transcription
Value Stream Mapping (VSM)Workshop
Agenda IntrosWhat is VSM?Benefits of VSMVSM ElementsExerciseBreakVSM ProcessVSM SymbolsSummaryResourcesQ&A
Introductions 30 seconds each Where do you work? Why do they pay you? What value do youprovide? Where are you from? What is your background on Lean?
What is a Value Stream Map? VSM Value Stream Map VSM is a visual means to depict and improvethe flow of processes, as well as theinformation that controls the flow of materialsand information through the process Starts from customer request for product orservice, to delivery of item back to customer Developed in an event format, usually 3-5 dayswith a cross-functional team
VSM tml?id lean clean5
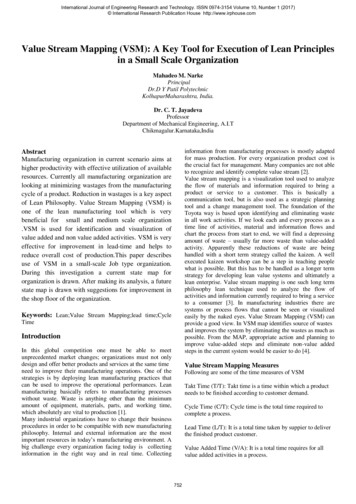
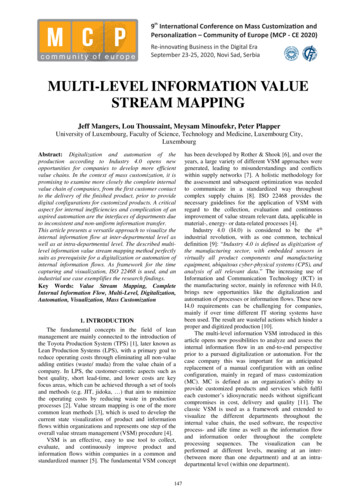
CONFUSION AROUND VALUE STREAM MAPPING TIMELINELead Time 38 minsCycle Time 30 minsExample: Review Design ChangesWaiting:Busy with othertasks8 minsNVA: LoadingProgramValue Added 10 minsNVA: Inspecting, fixing typos, print out file, complete paperwork16 mins4 minsVA: ReviewingchangesVA: Make Decisionand Submit6 mins4 minsSetupcompleteSend email withapprovalRequest arrivesfor design change Work starts ondesign changeReview DesignChangeProcess NameLead Time38 minsCycle (Working) TimeValue Added Time30 mins10 mins
Benefits of a VSM Looking horizontally across a company at thesystem level, similar to how a customer wouldview the process Highlights areas where the product or serviceflow stops or is constrained Reduces sub-optimizing Team building and networking Improved communication
VSM Videohttps://www.youtube.com/watch?v YYsn0X0EVRI (10 mins)
Others having success Woodfold Manufacturing reduced volatileorganic compound (VOC) emissions by nearly1,000 lbs per year and diverted 6 tons per yearof solid PVC waste from the landfill throughopportunities identified in a value streammapping event.EPA The Environmental Professional’s Guide to Lean & Six Sigma
And more chapter-3
Traditional VSM with Water DataData ter/resources/lean-water-toolkit.pdf
Water VSM using water not ts/environment/ch3.htm
Focus on Customer Response Time The largest obstacle is the fact that wasteoften hides in plain sight, or is designed intoactivities We cannot eliminate the waste of material,labor, or other resources until we recognizeit as waste– A job can consist of 99% waste 1 hour task that takes 1 week to provide customerwhat they asked for
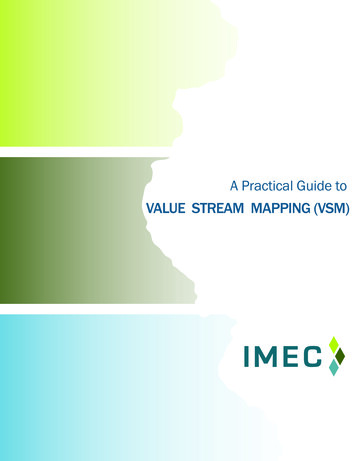
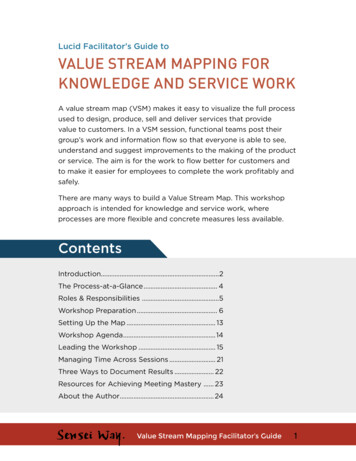
Value vs non-value addedCustomer View: Before and After Lean24 mins of work1 day responseBefore24 mins of work1 hour responseAfter0100200300400500MinutesRemove delays (red) first, before reducing value time (green)600
VSM BeforeAdd Material Usage to Address Environmental Impact
Review: TIM WOODS (8 Wastes) Waste Non-value added Find and eliminate these 8 forms of waste inyour processes
VSM After
VSM tie to Process MapsEHS»Painting3 peopleC/T 7 minC/O 4 hrUptime 48%»Breaks VSM process boxes intospecific process stepsHelps Lean teams see how thecurrent process works and locatewasteProcessStep 1ProcessStep 2ProcessStep 3ProcessStep 1.1ProcessStep 1.2ProcessStep 1.3
ExerciseMaking Pizza
Pizza Exercise Watch the videoCapture major process stepsCollect inventory dataCollect cycle time data– Lead time and yield will be provided
Pizza Making VSM ExerciseDOUGHSAUCETOPPINGSIIITRAYSSCREENSPIZZASC/T C/T C/T V/A Time V/A Time V/A Time
VSM from Video
15 MINUTE BREAK
VSM Process Steps
Steps to creating a VSM Define key product or serviceDefine product familyDetermine improvements neededSchedule event with key team membersGather data (preparation)Conduct eventDevelop Action PlanFollow up (30/60/90 days)Schedule VSM refresher
Define key product or service Most frequent requestsHighest volume of workMost critical product/serviceArea with most issues/problemsFuture growth areasHigh visibility to customersOther strategic reasons
Define product family
Determine improvements needed Customer complaints and issues Financial issues– Overtime, margin, inventory, scrap, warranty Flow issues– Bottlenecks, missed deliveries, shortages, rework Employee complaints and issues– Absenteeism, tools, training, interruptions
Schedule event with team Identify key resources across the value stream– Use SIPOC diagram (next slide) Find people with most experience– Delay event if not available Confirm attendance and expectations Review their responsibilities and who theyrepresent
SIPOC – Community ry storeFood and drinksPurchase ItemsTrashLandfillDepartment storeGiftsRemove frompackagingRecycled MaterialsResidentsFarmer’s MarketHousehold itemsCompost DirtCommunityGreenhouse GasEmissionsEarth /EnvironmentGas stationToolsSort out waste intobinsDepartment storeCity websiteBins collectedLecheteRestaurantCity OfficialsContents droppedoff to correctlocationMake sure Earth is included as a Customer!31
Gather data (preparation) Issues and complaints Interviews and focusgroups Observations and timings Historical data Inventory levels Scorecard and financialperformance
Conduct event Typically 3-5 days Major phases– Training– Gemba Walk– Current State Map– Identify waste and opportunities– Ideal State– Future State Map
Training Overview only to get everyone on same page,not expert level Most learning will be hands-on during event Focus on tools used in event Interactive with simulations and videos is ideal
Gemba Walk Japanese word for “the realplace” Go to where the actual work isbeing done, interact with theworkers to improve decisionmaking and problem solving Shows respect for the workersto understand what they do Referred to as “Gemba Walk”or “Go and See”Courtesy aria-automobile-nord.com
Current State What is happening today (snapshot) 80% of what is typically done– not exceptions and one-off situations Based on data gathering and interviews duringevent Capture problems, not solutions Must thoroughly understand current statebefore making improvements Identify opportunities with burst symbol
Identify waste and opportunities Customer satisfaction8 forms of wasteLongest lead timesLongest cycle timesMost inventory (bottlenecks)Frustration areasOverburden (muri)Instability/variation (mura)
Ideal State How would you setup this process if you werestarting from scratch, with no boundaries, all themoney, all the people, all the resources youwanted, along with the following principles inplace?–––––––Defect-freeJust in timeOne piece flowMinimal inventoryLowest costAll value added processesMinimal space
Future State Come back from reality from Ideal State How close can be get to Ideal State, given:– Limited time (6-12 months)– Limited budget (low cost solutions)– Limited resources– Current limitations (regulations, agencies,customers, procedures/policies)
VSM States1CurrentState3FutureState2IdealState
Develop Action Plan Identify potential solutionsDetermine impact and ease of implementationVote on best ideasCreate action plan with names, dates, anddeliverables
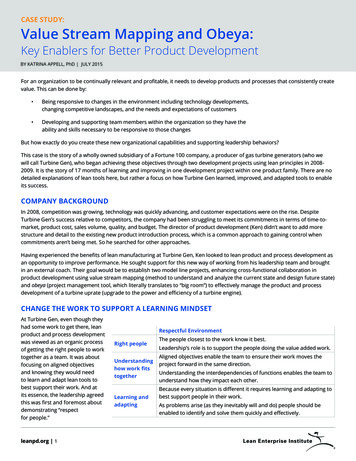
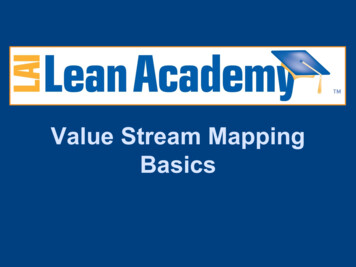
Impact and Ease MatrixHigh97IMPACT8Low15261043HardEASE OF IMPLEMENTATIONEasy1. Turn down water temp onpart wash machine2. Dry sweep implementation3. Water flow in bathroom sinks4. Drip irrigation in landscaping5. Reuse water in stress testingequipment6. Water flow in toilets7. Part wash machine pipeinsulation8. Water pipe leak fixed9. Upgrade chiller10. Plug water pipe at end ofeach shift
Multivoting (3-5 dots each)1. Turn down water temp on partwash machine2. Dry sweep implementation3. Water flow in bathroom sinks4. Drip irrigation in landscaping5. Reuse water in stress testingequipment6. Water flow in toilets7. Part wash machine pipeinsulation8. Water pipe leak fixed9. Upgrade chiller10. Plug water pipe at end of eachshift
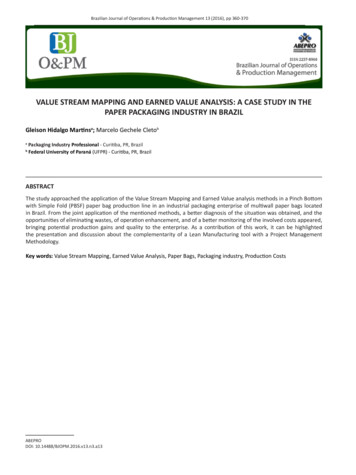
Action Item Tracker#ActionAssigneeDue DateDeliverableStatusNotes1Update procedureVera12/1/17Procedurereleased andavailable insystemIn Process Neednew repfrom HR2Email photos fromeventBrion8/1/17Email withphotosattached sentto teamComplete3Kaizen event onhiring processUma1/15/18Report outfrom eventNotstarted
Follow up (30/60/90 days) Don’t wait for 30 days to follow-up Schedule immediately the week after event,and each week for first month Suggest meeting weekly for first 90 days Some actions may require kaizen events tocomplete– Schedule and help facilitate events Track progress after improvements– May be delayed due to backlog of work and metrics
Schedule VSM refresher Typically updated every 6-18 months– Depends on how much improvement is made Put on calendar immediately, including preptime Captures benefits since last event Start from beginning, don’t update maps– Unless nothing has changed
Symbols
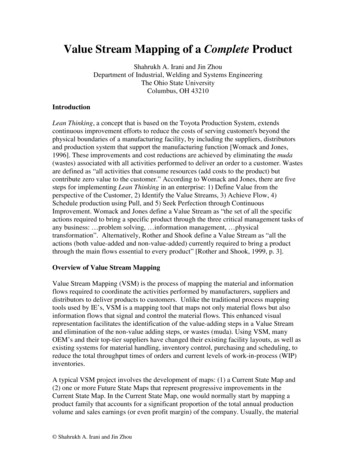
VSM SymbolsData BoxSupplier/CustomerProblem/OpportunityProcess StepTruck DeliveryManual Information FlowElectronic Information FlowInventoryPushPullSupermarket
VSM SymbolsKanban Arrivingin BatchesSupermarketWithdrawalFirst In, First OutSignal KanbanLoad LevelingWithdrawal KanbanBuffer or Safety StockProduction KanbanGo and SeeProductionSchedulingKanban Post
Summary VSM is a good tool for getting teams aligned,focused on the customer, looking at systemoptimization and reducing flow inhibitors Leads to plans that can reduce lead time by50% or more! Takes significant effort, but very valuable Conduct current, ideal and future state maps Key is the follow-up with the action plan (byprocess owner, not facilitator)
ResourcesLearning to See: Value StreamMapping to Add Value and EliminateMUDAMike Rother and John ShookValue Stream Mapping: How toVisualize Work and AlignLeadership for OrganizationalTransformationKaren Martin and Mike Osterling
Q&A
Plus/Delta Plus ( )– What did you like?– What did you learn? Delta (Δ)– What could have gone better?– What was least valuable?
What is BPI?BUSINESS PERFORMANCE IMPROVEMENTHelping businesses and organizations achieve “triple bottom line” performanceusing Lean and Six SigmaThink GloballyAct Locally
Services Mentor Current LSS ExpertsAnalyze DataResearch, Advise and TeachFacilitate EventsManagement CoachingNetwork
Training Classes and Workshops Intro to Lean and SixSigma Lean and GreenWorkshop 5S WorkplaceOrganization Personal Lean Statistical ProcessControl (SPC) Capability Analysis(Cpk/Ppk) Variable and AttributeGage R&R Regression and ANOVA Design of Experiments Advanced SPC Value Stream Mapping(VSM) Advanced StandardWork More coming soon http://www.biz-pi.com/PDX/
Other Websites Business Performance Improvement– BIZ-PI.com Earth Consultants - Lean Six Sigma and theEnvironment (Planet)– LeanSixSigmaEnvironment.org Lean Six Sigma for Good– LeanSixSigmaForGood.com Lean Portland– LeanPDX.org
ContactBrion HurleyLean Six Sigma Master Black BeltPortland, Oregon nhurley
VSM Value Stream Map VSM is a visual means to depict and improve the flow of processes, as well as the information that controls the flow of materials and information through the process Starts from customer request for