Transcription
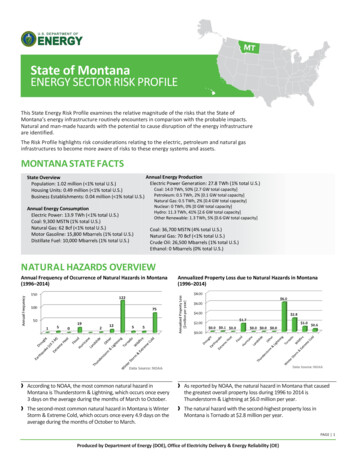
State of MontanaENERGY SECTOR RISK PROFILEThis State Energy Risk Profile examines the relative magnitude of the risks that the State ofMontana’s energy infrastructure routinely encounters in comparison with the probable impacts.Natural and man-made hazards with the potential to cause disruption of the energy infrastructureare identified.The Risk Profile highlights risk considerations relating to the electric, petroleum and natural gasinfrastructures to become more aware of risks to these energy systems and assets.MONTANA STATE FACTSAnnual Energy ProductionState OverviewElectric Power Generation: 27.8 TWh (1% total U.S.)Population: 1.02 million ( 1% total U.S.)Coal: 14.0 TWh, 50% [2.7 GW total capacity]Housing Units: 0.49 million ( 1% total U.S.)Petroleum: 0.5 TWh, 2% [0.1 GW total capacity]Business Establishments: 0.04 million ( 1% total U.S.)Annual Energy ConsumptionElectric Power: 13.9 TWh ( 1% total U.S.)Coal: 9,300 MSTN (1% total U.S.)Natural Gas: 62 Bcf ( 1% total U.S.)Motor Gasoline: 15,800 Mbarrels (1% total U.S.)Distillate Fuel: 10,000 Mbarrels (1% total U.S.)Natural Gas: 0.5 TWh, 2% [0.4 GW total capacity]Nuclear: 0 TWh, 0% [0 GW total capacity]Hydro: 11.3 TWh, 41% [2.6 GW total capacity]Other Renewable: 1.3 TWh, 5% [0.6 GW total capacity]Coal: 36,700 MSTN (4% total U.S.)Natural Gas: 70 Bcf ( 1% total U.S.)Crude Oil: 26,500 Mbarrels (1% total U.S.)Ethanol: 0 Mbarrels (0% total U.S.)NATURAL HAZARDS OVERVIEWAnnual Frequency of Occurrence of Natural Hazards in Montana(1996–2014)Annualized Property Loss due to Natural Hazards in Montana(1996–2014)❱ According to NOAA, the most common natural hazard inMontana is Thunderstorm & Lightning, which occurs once every3 days on the average during the months of March to October.❱ As reported by NOAA, the natural hazard in Montana that causedthe greatest overall property loss during 1996 to 2014 isThunderstorm & Lightning at 6.0 million per year.❱ The second-most common natural hazard in Montana is WinterStorm & Extreme Cold, which occurs once every 4.9 days on theaverage during the months of October to March.❱ The natural hazard with the second-highest property loss inMontana is Tornado at 2.8 million per year.PAGE 1Produced by Department of Energy (DOE), Office of Electricity Delivery & Energy Reliability (OE)
ENERGY SECTOR RISK PROFILEState of MontanaELECTRICElectric Power Plants: 47 ( 1% total U.S.)Coal-fired: 6 (1% total U.S.)Petroleum-fired: 2 ( 1% total U.S.)Natural Gas-fired: 6 ( 1% total U.S.)Nuclear: 0 (0% total U.S.)Hydro-electric: 23 (1% total U.S.)Other Renewable: 10 ( 1% total U.S.)Transmission Lines:High-Voltage ( 230 kV): 3,710 MilesLow-Voltage ( 230 kV): 6,946 MilesPAGE 2Produced by Department of Energy (DOE), Office of Electricity Delivery & Energy Reliability (OE)
State of MontanaENERGY SECTOR RISK PROFILEElectric Transmission❱ According to NERC, the leading cause of electric transmission outages in Montana is Faulty Equipment/Human Error.❱ Montana experienced 29 electric transmission outages from 1992 to 2009, affecting a total of 263,605 electric customers.❱ Transmission Line Faults and Overloads affected the largest number of electric customers as a result of electric transmissionoutages.Electric Customers Disrupted by NERC-Reported Electric TransmissionOutages by Cause (1992–2009)Number of NERC-Reported Electric TransmissionOutages by Cause (1992–2009)Electric DistributionElectric Utility Reported Power Outages by Month (2008–2013)Causes of Electric-Utility Reported Outages (2008–2013)❱ Between 2008 and 2013, the greatestnumber of electric outages in Montana hasoccurred during the month of October.❱ The leading cause of electric outages inMontana during 2008 to 2013 wasWeather/Falling Trees.❱ On average, the number of people affectedannually by electric outages during 2008 to2013 in Montana was 44,163.❱ The average duration of electric outages inMontana during 2008 to 2013 was 6,663minutes or 111.1 hours a year.Electric Utility Outage Data (2008–2013)❱ NOTE: # of Incidents – The number within each pie slice isthe number of event incidents attributable to each cause.PAGE 3Produced by Department of Energy (DOE), Office of Electricity Delivery & Energy Reliability (OE)
ENERGY SECTOR RISK PROFILEState of MontanaPETROLEUMPetroleum Infrastructure OverviewRefineries: 4 (3% total U.S.)Terminals: 25 (1% total U.S.)Crude Pipelines: 1,278 Miles (3% total U.S.)Product Pipelines: 10,560 Miles (2% total U.S.)Bio-Refineries (Ethanol): 0 (0% total U.S.)PAGE 4Produced by Department of Energy (DOE), Office of Electricity Delivery & Energy Reliability (OE)
State of MontanaENERGY SECTOR RISK PROFILEPetroleum TransportTop Events Affecting Petroleum Transport by Truck and Rail (1986–2014)❱ The leading event typeaffecting the transport ofpetroleum product by railand truck in Montana during1986 to 2014 was IncorrectOperation for rail transportand Incorrect Operation fortruck transport, with anaverage 0.7 (or one incident1.4 years) and 1.9 incidentsper year, respectively.Top Events Affecting Crude Oil and Refined Product Pipelines in Montana (1986–2014)❱ The leading event typeaffecting crude oil pipelineand petroleum productpipelines in Montana during1986 to 2014 wasEquipment Failure for crudeoil pipelines and EquipmentFailure for product pipelines,with an average 1.07 and0.52 (or one incident 1.9years) incidents per year,respectively.Petroleum Refinery❱ The leading cause of petroleum refinery disruptions in Montana from 2003 to 2014 was Fire and/or Explosion. Montana's petroleumrefineries experienced 45 major incidents from 2003 to 2014. The average production impact from disruptions of Montana's refineriesfrom 2003 to 2014 is 15.7 thousand barrels per day.Top-Five Causes of Petroleum Refinery Disruptions in Montana(2003–2014)Average Production Impact (thousand barrels per day) fromPetroleum Refinery Outages in Montana (2003–2014)PAGE 5Produced by Department of Energy (DOE), Office of Electricity Delivery & Energy Reliability (OE)
ENERGY SECTOR RISK PROFILEState of MontanaNATURAL GASNatural Gas Infrastructure OverviewGas Wells: 5,754 (1% total U.S.)Processing Plants: 5 (1% total U.S.)Storage Fields: 4 (1% total U.S.)Interstate Pipelines: 7,200 Miles (1% total U.S.)Local Distribution Companies: 13 (1% total U.S.)PAGE 6Produced by Department of Energy (DOE), Office of Electricity Delivery & Energy Reliability (OE)
State of MontanaENERGY SECTOR RISK PROFILENatural Gas Transport❱ The leading event type affecting natural gas transmission and distribution pipelines in Montana during 1986 to 2014 wasOutside Force for Transmission Pipelines and Outside Force for Distribution Pipelines, with an average 0.35 and 0.29 incidentsper year (or one incident every 2.8 and 3.4 years), respectively.Top Events Affecting Natural Gas Transmission and Distribution in Montana (1986–2014)Natural Gas Processing❱ Insufficient public data are available on major incidents affecting natural gas processing plants in this state.PAGE 7Produced by Department of Energy (DOE), Office of Electricity Delivery & Energy Reliability (OE)
Bcf – Billion Cubic FeetGW – GigawattkV – KilovoltMbarrels – Thousand BarrelsMbpd – Thousand Barrels per DayMMcfd – Million Cubic Feet per DayMSTN – Thousand Short TonsTWh – Terawatt hoursDATA SOURCESOverview Information❱ NOAA (2014) Storms Events Database [www.ncdc.noaa.gov/data-access/severe-weather]❱ Census Bureau (2012) State and County QuickFacts[http://quickfacts.census.gov/qfd/ download data.html]Production Numbers❱ EIA (2012) Table P1 Energy Production Estimates in Physical Units [http://www.eia.gov/state/seds/sep prod/pdf/P1.pdf]❱ EIA (2013) Natural Gas Gross Withdrawals and Production [http://www.eia.gov/dnav/ng/ng prod sum a EPG0 VGM mmcf a.htm]❱ EIA (2012) Electric Power Annual, Table 3.6. Net Generation by State, by Sector, 2012 and 2011 (Thousand Megawatt pa.pdf]❱ EIA (2012) Electric Power Annual, Existing Nameplate and Net Summer Capacity by Energy Source, Producer Type and State e/]Consumption Numbers❱ EIA (2012) Electric Power Annual, Fossil Fuel Consumption for Electricity Generation by Year, Industry Type and State (EIA-906, EIA-920, andEIA-923) [http://www.eia.gov/electricity/data/state/]❱ EIA (2013) Prime Supplier Sales Volumes [http://www.eia.gov/dnav/pet/pet cons prim dcu nus m.htm]❱ EIA (2012) Adjusted Sales of Fuel Oil and Kerosene ]❱ EIA (2012) Annual Coal Consumption [http://www.eia.gov/coal/data.cfm]Electricity❱ EIA (2013) Form-860 Power Plants [http://www.eia.gov/electricity/data/eia860/]❱ Platts (2014 Q2) Transmission Lines (Miles by Voltage Level)❱ Platts (2014 Q2) Power Plants (Production and Capacity by Type)Petroleum❱❱❱❱❱Argonne National Laboratory (2012) Petroleum Terminal DatabaseArgonne National Laboratory (2014) Ethanol PlantsEIA (2013) Petroleum Refinery Capacity Report MS (2011) Petroleum Product Pipeline (Miles of Interstate Pipeline)NPMS (2011) Crude Pipeline (Miles of Interstate Pipeline)Natural Gas❱❱❱❱EIA (2013) Form-767 Natural Gas Processing Plants [http://www.eia.gov/cfapps/ngqs/ngqs.cfm?f report RP9]EIA (2013) Number of Producing Gas Wells [http://www.eia.gov/dnav/ng/ng prod wells s1 a.htm]NPMS (2011) Natural Gas Pipeline (Miles of Interstate Pipeline)Platts (2014 Q2) Local Distribution Companies (LDCs)Event Related❱ DOE OE (2014) Form 417 Electric Disturbance Events [http://www.oe.netl.doe.gov/OE417 annual summary.aspx]❱ DOE OE (2014) Energy Assurance Daily (EAD) [http://www.oe.netl.doe.gov/ead.aspx]❱ Eaton (2014) Blackout and Power Outage Tracker ault.asp?id &key &Quest userid &leadg Q QRequired &site &menu &cx 3&x 16&y 11]❱ DOT PHMSA (2013) Hazardous Material Incident System (HMIS) sSearch/search.aspx]❱ NERC (2009) Disturbance Analysis Working Group px]**The NERC disturbance reports are not published after 2009.Notes❱ Natural Hazard, Other, includes extreme weather events such as astronomical low tide, dense smoke, frost/freeze, and rip currents.❱ Each incident type is an assembly of similar causes reported in the data source. Explanations for the indescribable incident types are below.❱ Outside Force refers to pipeline failures due to vehicular accident, sabotage, or vandalism.❱ Natural Forces refers to damage that occurs as a result of naturally occurring events (e.g., earth movements, flooding, high winds, etc.)❱ Miscellaneous/Unknown includes releases or failures resulting from any other cause not listed or of an unknowable nature.❱ Overdemand refers to outages that occur when the demand for electricity is greater than the supply, causing forced curtailment.❱ Number (#) of Incidents – The number within each pie chart piece is the number of outages attributable to each cause.FOR MORE INFORMATION CONTACT:Office of Electricity Delivery and Energy ReliabilityU.S. Department of EnergyPhone: 202-586-2264Email: energyresponsecenter@hq.doe.gov
from 2003 to 2014 is 15.7 thousand barrels per day. Top-Five Causes of Petroleum Refinery Disruptions in Montana (2003–2014) Average Production Impact (thousand barrels per day) from Petroleum Refinery Outages in Montana (2003–2014) Top Events Affecting Petroleum Trans