Transcription
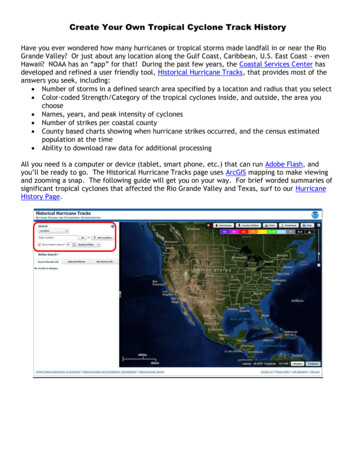
Create Your Own Tropical Cyclone Track HistoryHave you ever wondered how many hurricanes or tropical storms made landfall in or near the RioGrande Valley? Or just about any location along the Gulf Coast, Caribbean, U.S. East Coast - evenHawaii? NOAA has an “app” for that! During the past few years, the Coastal Services Center hasdeveloped and refined a user friendly tool, Historical Hurricane Tracks, that provides most of theanswers you seek, including: Number of storms in a defined search area specified by a location and radius that you select Color-coded Strength/Category of the tropical cyclones inside, and outside, the area youchoose Names, years, and peak intensity of cyclones Number of strikes per coastal county County based charts showing when hurricane strikes occurred, and the census estimatedpopulation at the time Ability to download raw data for additional processingAll you need is a computer or device (tablet, smart phone, etc.) that can run Adobe Flash, andyou’ll be ready to go. The Historical Hurricane Tracks page uses ArcGIS mapping to make viewingand zooming a snap. The following guide will get you on your way. For brief worded summaries ofsignificant tropical cyclones that affected the Rio Grande Valley and Texas, surf to our HurricaneHistory Page.
Step 1: Navigating the Tracking PageThe map above greets you when entering the Historical Hurricane Track Page. Before continuing,ensure that no pop-up blockers are active. Using the GUI in the red outline above, the first choiceunder Search (Location) can be changed to Storm Name/Year, where you can enter a specificstorm and year of interest, or to Ocean Basin, which will open a global map showing all tropicalbasins.For our purposes, we’ll stick with Location. In the “Enter Location” box, type in your location. Besure to spell out in as much detail (i.e. Brownsville, Texas is better than Brownsville). Beforepressing the “Go” button, determine your search area. This is a radius that will be used todetermine how many storms tracked in the vicinity of Brownsville. The larger the radius, the morecyclones you’ll see. For example, if you use the default of 65 nautical miles (nm), the gray circle(below) highlights an area extending 65 nm around Brownsville. If a storm did not move throughthat circle, it will not be shown. At 65 nm, Hurricanes Dolly, Allen, and Bret will appear, butHurricane Alex and Hurricane Emily will not. To ensure that most, if not all, storms that impactedthe Rio Grande Valley are shown, increase your search area. Scale options include nautical miles,statute miles, or kilometers.Once you’ve completed your location and search area selections, press the “Go” button. A pop-upwindow will show alternate locations for Brownsville. The first option will be Brownsville, Texas,United States. Click it. A map similar to the one below will appear (the example is set for a 65 nmsearch area). Now you’re ready to interrogate the data.Step 2: Interrogating the DataThe map and information are fairly intuitive to use. The default zoom is rather “spaghetti” like, sothe first thing to do is move your mouse onto the map (or finger click the map on a Flash-enabledtablet or smart phone) and click on an area away from any track lines. Use the mouse scroll wheel(computer) or two-finger zoom (Flash-enabled tablet/smart phone) to zoom, or you may use theslider bar (upper right corner of the page) to zoom. Panning left, right, up, and down is done byholding the left mouse button down and moving in the direction you desire. Similar to GIS-based
programs (Google Earth ), the closer you zoom, the more information is revealed on the map, suchas counties and cities (below). At this point, you may uncheck the “Show search area” to removethe gray circle, which may be distracting.Now, the “cool” part. The window left of the map now shows search results of all named (since1950) and unnamed (1851 to 1949) cyclones, (tropical storm to hurricane), that tracked throughyour specified search area. The default list is sorted by Year (latest to earliest), but may be sortedby ascending year, name (A to Z and Z to A) Storm Intensity, and revised Storm Intensity. On themap, as you mouse over each track line, it will be highlighted, as will the storm information in thetext window.Highlighted Storm (Hurricane Allen), 1980.
Hurricane Allen was highlighted above, on the map and text window (blue). Please note thedifferences in the listed intensity on the table with the track intensities on the map. On themap, the “best track” intensity is provided, shown by changing colors (legend in upper right) as astorm strengthens or weakens. On the table, the peak intensity is shown. Peak intensity may ormay not have occurred in your zoomed map area. Further interrogation provides the details.Clicking on the highlighted track will focus on the particular storm, and open a window of stormdetails in text and chart form. Full track information at each iteration for the storm’s life cycle isshown in a table (blue outline) and a pressure and wind speed chart (maroon outline) below.Further details on the storm can be accessed by clicking on “Storm Details” and “Storm Report”(above the life cycle table). “Storm Details” shows more track information and “Storm Report”links to the National Hurricane Center storm wallet specific to your selection, in this case,Hurricane Allen.
For some decision makers, a history of county-by-county landfalls is important for infrastructureand evacuation planning, among other reasons. By selecting “County Strikes” (highlighted in blue),the map of coastal counties will change colors, with a scale indicating the number of strikes since1851, per county (below).Click on a county with a color scale to show strike details. The chart on the following page showshurricane strikes vs. population for Cameron County, listed by peak category at landfall. The chartshould be used with care, since it does not match track with population centers. For example,Hurricane Allen, a rapidly weakening Category 3 storm at landfall, largely affected rural Cameronand Willacy County with strongest winds and coastal surge.And More This guide is just an overview of some of the available information you need to answer thequestion: “How many hurricanes have passed within xx miles of Brownsville in history?” Foradditional help, just click on the “Help” button on the upper right of the map. Consider theinterrogation process a fun expedition to find out more about past cyclones, from the LagunaMadre Bay to the Bay of Bengal (India/Bangladesh). Discovery is a great learning tool. If you havefurther questions, be sure to contact us.
differences in the listed intensity on the table with the track intensities on the map. On the map, the "best track" intensity is provided, shown by changing colors (legend in upper right) as a storm strengthens or weakens. On the table, the peak intensity is shown. Peak intensity may or may not have occurred in your zoomed map area.