Transcription
Cost and Schedule UncertaintyAnalysis of Growth in Support of JCL2014 NASA Cost SymposiumLaRC, August 13, 2014Presenter(s): Darren Elliott – Tecolote ResearchCharles Hunt – NASA OoE/CAD1PRT – 183 , AUGUST 2014APPROVED FOR PUBLIC RELEASE
AbstractNASA formal probabilistic estimating guidance was first mentioned in February 2006 and later codified in2009 Joint Cost and Schedule Confidence Level (JCL) policy. NASA has been continually making stridesto hone the associated best practices and understanding for JCL analysis. One of the issues identifiedwithin the JCL construct is the lack of data-driven uncertainty guidance.Typically uncertainty is modeled using a three point estimate at an activity or summary level. The lowvalue represents the low extreme of uncertainty, the middle value represents the “most likely” value ofthe cost or duration, and the high value represents the high extreme of uncertainty. In general, thereis not a consistent set of practices or guidelines for how to determine the boundaries or distributions ofthe “natural” variation of cost and schedules in project development. This has primarily been due to alack of data, however over the past 7 years through the CADRe initiative NASA has been building a robustarchive of project cost, schedule, and technical data at various points in a projects technical maturity.This data provided an opportunity to assess and determine if cost and schedule growth metrics could bedeveloped for use in JCL analysis.This presentation will provide insight into the analysis process and discuss the data challenges thatexisted within the study. Initial results of cost and schedule distributions will be provided as well asinsight into the impact of complexity and technical maturity. This study provides direct benefits toanalysts in developing or reviewing JCL models.2PRT – 183 , AUGUST 2014APPROVED FOR PUBLIC RELEASETECOLOTE RESEARCH
The JCL Modeling Challenge How do I separate riskfrom uncertainty?How do I identifythe bounds?How do I apply tomy level of detail?3PRT – 183 , AUGUST 2014APPROVED FOR PUBLIC RELEASETECOLOTE RESEARCH
The Wild Wild West?Source: Butts, Glenn, “Uncertainty Approach, “ NASA Cost Symposium 2013, August 2013In general, NASA projects have little consistency in setting the boundaries ordistributions of the “natural” variation of cost and schedulesFurthermore, projects have difficulty distinguishing epistemic (discrete risks) in theirrisk registers from those that are included in natural uncertaintyOur community needs specific data, methodologies, and guidelines to help themdetermine appropriate levels of task duration and cost variation4PRT – 183 , AUGUST 2014APPROVED FOR PUBLIC RELEASETECOLOTE RESEARCH
Goal of the NASA OoE/CAD directed study was to determine a set ofdistributions based on historical data for duration and cost that couldbe applied to all levels of a project JCL model and account for risk
Key Thoughts at the Beginning of our Journey6 Create DATA DRIVEN guidelines Account for topology/level/behavior Address risk/uncertainty “double accounting”Don’t recreate the wheelEstablish framework that is easily understoodand can evolvePRT – 183 , AUGUST 2014APPROVED FOR PUBLIC RELEASETECOLOTE RESEARCH
Our Path 1Conduct literary review2Develop concept fordistribution frameworkCollect andnormalizeCADRe dataAnalyze cost andduration growthCalibrate for TI, TD, levelof application, and risks7PRT – 183 , AUGUST 2014APPROVED FOR PUBLIC RELEASE345TECOLOTE RESEARCH
Cost and Schedule Uncertainty GuidelinesStep 1 – Literary Research8PRT – 183 , AUGUST 2014APPROVED FOR PUBLIC RELEASETECOLOTE RESEARCH
Wide Range of Documents ResearchedAACEI17R-97Christensen, P., et. al., "Cost Estimate Classificat ion," AACE InternationalRecommended Practice No. 17R-97, American Association for Cost EngineeringInternational, November 2011.Garvey, 2006Garvey, P., "Introduction to Systems Cost Uncertainty Analysis," M ITRE Paper MP05B0000012, presented at the National Institute of Ae rospace Distinguished l ectureSeries, May 2005.AACEI18R-97Christensen, P., et . al., " Cost Estimate Classification: As Applied in Engineering,Procurement, and Construction for the Process Industries," AACE InternationalRecommended Practice No. 18R-97, American Association for Cost EngineeringInternational, February 2005.Granli, 2009Granli, 0 ., " Project Uncertainty Management," MIT Open Courseware, Spring 2009.Hulett, 2009Hulett, D., "Integrated Cost-Schedule Risk Ana lysis using Risk Drivers and PrioritizingRisks," NASA Cost Symposium 2009.AFCRUH, 2007U.S. Ai r Fo rce, U.S. Air Force Cost Risk and Uncertainty Handbook, 2007.l aser lightWonica, D., "Estimating Cost Uncertainty when only Baseline Cost is Avai lable,"laserlight Networks, Inc., unknown publication date.ASTM E2516-llASTM , " Standard Classification for Cost Estimate Classification System,"Subcommittee E06.81 on Building Economics, ASTM International, 2011.l each, 2005leach, P., "Modeling Uncertai nty in Project Scheduling," Proceedings of the 2005Crystal Bal l User Conference, 2005.Baccarini, D.," The concept of project complexity - a review," International Journal ofProject Management Vol. 14, No. 4, pp. 201-204, 1996.Leising, 2011Leising, C., "Concept Maturity Levels," NASA PPMB, April 2011.Little, 2006Little, T., " Schedule Estimation and Uncertainty Surroundi ng the Cone ofUncertai nty," IEEE Software, Published by IEEE Computer Society, May/June 2006.McConne ll, 1996McConnell, S., "Rapid Development: Taming W i ld Software Schedules" MicrosoftPress, 1996.MDA, 2012u.s. Missile Defense Agency, " Cost Estimating and Analysis Handbook," MDA Directorfor Operations Cost Estimati ng and Analysis Directorate, June 2012.NASA CEH, 2008National Aeronautics and Space Administration (NASA). " NASA Cost EstimatingHandbook," 2008.Neatrour,2009Neatrour, J. et al., " Fat -Tai led Distributions for Cost and Schedule Risk Analysis,"Baccarini, 1996Bearden, 2000Bearden, David A., MA Complexity-based Risk Assessment of Low-Cost PlanetaryMissions: When is a Mission Too Fast and Too Cheap?", Fourth IAA InternationalConferen ce on Low-Cost Planetary Missions, JHU/ APL, Laurel, MD, May 2000.Book, 2002Book, S., " Schedule Risk Analysis: Why It is Important and How to Do It," presented atthe Ground System Architectures Workshop (GSAW), The Aerospace Corporation, ElSegundo, CA, March 2002.Butts, 20139Butts, G., " Uncertainty Approach," NASA Cost Symposium 2013, August 2013.Cleden, 2009Cleden, D., " Managing Project Uncertainty," Gower Publishing Company, 2009.Cretu, 2009Cretu, 0 ., Berends, T., Stewart, R., " Reflections about Base Cost Uncertainty," Societyfor Risk Analysis Annual Meeti ng 2009, Risk Ana lysis: The Evolution of Science,Baltimore, MD, December 2009.presented at t he NASA Cost Symposium, Kennedy Space Center, Florida, May 2009.Nair, 2013Nai r, P., "Advo cate Joint Confidence Level (JCL) Combined Resources Forum," JuneCSRUH, 2013Naval Center for Cost Analysis, " Joint Cost Risk Uncert ainty Handbook," 2013.DOE, 2011U.S. Department of Energy, " Cost Estimating Guide," DOE G 413.3-21, May 2011.EPA, 2000u.s. Environmental Protection Agency, " A Guide to Developing and DocumentingApplication of Complexity-Based Cost Indices," I EEE Aerospace Conference, MarchCost Estimat es During the Feasibility Study," EPA 540-R-00-002, July 2000.2008.2013.Peterson, 2008Peterson, C., et. al, "Rapid Cost Assessment o f Space Mission Concepts throughFAA Biz, 2013U.S. Federal Aviation Administration, " Business Case Analysis Guidance," Office ofInvestment Planning and Analysis (AFI-1), July 2013.RAND, 2008Fox, B., et. al., " Guidelines and Metrics for Assessing Space System Cost Esti mates,"RAND Technical Report, prepared for the U.S. Ai r Force, 2008.FAA Cost, 2013U.S. Federal Aviation Administration, " Business Case Cost Est imating Guide," Office ofInvestment Planning and Analysis (AFI-1), July 2013.Raymond,1999Raymond, F., " Quantify Risk to Manage Cost and Schedule, " Acquisition ReviewQuarterly, Spr ing 1999.Filippazzo, 2004Filippazzo, G., " Complexity Based Cost Estimating Relationships for Space Systems,"IEEE Aerospace Conference, 2004.Smart, 2011Smart, C., " Covered With Oil: Incorporating Real ism in Cost Risk Analysis, present edat the Joint An nuai iSPA/ SCEA Conference, Albuquerque, June, 2011.GAO, 2009Government Accountability Office, " GAO Cost Estimating and Assessment Guide:Best Practices fo r Developing and Managing Capital Program Cost s," GAO ReportGA0-09-3SP, 2009. GAO Cost Estimating and Assessment GuidePRT – 183 , AUGUST 2014APPROVED FOR PUBLIC RELEASETECOLOTE RESEARCH
Research Findings10PRT – 183 , AUGUST 20141.Data driven metrics derived based onpercentage growth from a specificreference point – typically award2.Metrics developed at a commodity orspecific hardware level (e.g.,subsystem)3.Metrics categorized by level oftechnical challenge/complexity4.Ranges decrease as technicalunderstanding (design maturity)increases5.No current tables are directlyapplicable to NASA PDR /CDR JCL’sAPPROVED FOR PUBLIC RELEASETECOLOTE RESEARCH
Cost and Schedule Uncertainty GuidelinesStep 2 – Framework Concept11PRT – 183 , AUGUST 2014APPROVED FOR PUBLIC RELEASETECOLOTE RESEARCH
Premise 1 – Uncertainty Decreases with MaturityGrowthIncreased Maturity decreases the uncertaintyregarding cost and/or schedule growthMaturity12PRT – 183 , AUGUST 2014APPROVED FOR PUBLIC RELEASETECOLOTE RESEARCH
Premise 2 – Increased Complexity has Higher GrowthGrowthIncreased Complexity increases thecost growth and/or schedule growthComplexity13PRT – 183 , AUGUST 2014APPROVED FOR PUBLIC RELEASETECOLOTE RESEARCH
Premise 3 – Increased Complexity has HigherUncertaintyGrowthIncreased Complexity increasesthe uncertainty regarding costand/or schedule growthComplexity14PRT – 183 , AUGUST 2014APPROVED FOR PUBLIC RELEASETECOLOTE RESEARCH
Aerospace CoBRA methodology and RAND study identified relationship between cost andtechnical complexity Ability to include both discrete and continuous attributes Fairly intuitive process with results traceable to inputs Successfully demonstrated for small spacecraft and other spacecraft applications RAND study indicated potential subsystem drivers CoBRA is a system level modelPursued path to develop subsystem complexity model Derivative of Aerospace Corporation CoBRA methodology Approach and attribute selection informed by literature review, SEI SME, Tecolote datafindings, and feedback from peer reviews (December 2013, March 2014) Complexity scoring at the subsystem level Complexity index results based only on attributes available from CADRe’s16PRT – 183 , AUGUST 2014APPROVED FOR PUBLIC RELEASETECOLOTE RESEARCH
Guideline Tables Developed at specific hardware or work areas, based on data availability Meant as a reference point (anchor) for which project specificdistributions can be generated Flexible to allow updates and expansion with additional data and/orresearchI Technical ComplexityLowCSR/SRRMediumHighIIIImean- Xu* Estimatemean - X11 * Estimatemean - Xu * Estimatestd deviation- Y11 *Esti matestd deviation- Y11 * Esti matestd deviation - Yn * Estimatemean- X21 *Esti matemean - X21 * Estimatemean - X21 * Estimatestd deviation- Y21 *Esti matestd deviation- Y21 *Esti matestd deviation - Y21 *Estimatemean - X31 *Estimatemean - X31 * Estimatemean - X31 * Estimatestd deviation- Y31 * Esti matestd de vi at ion - Y31 * Esti matestd deviation - Y31 * Estimate . ro PDRc::ODIIVI lJ0CDRII Maturity aligns with CADRe capture point Challenge is in defining “complexity”15PRT – 183 , AUGUST 2014APPROVED FOR PUBLIC RELEASETECOLOTE RESEARCH
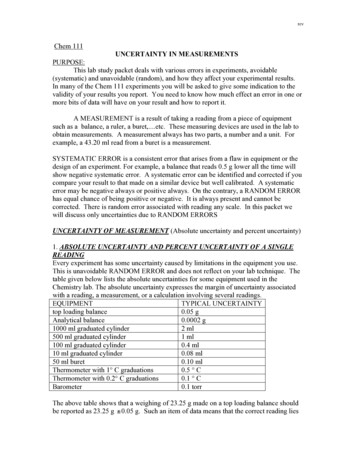
Complexity Index CalculationSubsystem (WBS Element)Attributes (Prog. / Technical)Attribute ValuesComplexity Score CalculationDiscrete AttributeUp to 9 Options-100% to 100%Continuous AttributeNumerical ValuePercent RankCmplx IndexScaled accordingto significanceNormalized Avg ofCmplx Score for allattributesSuSubsbsysystemtem 2 through n System level* Risk/reliability classificationType of thermal controlMission lifeNature of payloadaccommodationsOrbit/destinationPRT – 183 , AUGUST 2014Solar cell type (if applicable)Solar array configuration (ifapplicable)Battery type (if applicable)Battery capacity (if applicable) Subsystem heritagePropulsion type(s) on spacecraftNumber of thrusters tanksThrust generated from allpropulsion systemsSpacecraft land/sample/returnCommunication Downlink communication bandMaximum downlink data rateUplink communication bandMaximum uplink data rateAPPROVED FOR PUBLIC RELEASECommand and Data Handling Number of unique instrumentsTotal massAverage complexity of instrumentsPayload average powerInstruments Subsystem heritageProcessor architectureRadiation hardeningData storage availablePayload Propulsion Pointing accuracyElectrical Power and Distribution Subsystem heritageType of materialsSubsystem modularityNumber of deploymentsThermal Control SubsystemGuidance Navigation and Control Structures and Mechanisms Spacecraft heritageRisk/reliability classificationMission lifeNumber of organizationsInvolvedForeign partnershipNumber of major trument typeStarting TRL levelHeritageIntegration and Test Spacecraft heritageTECOLOTE RESEARCH
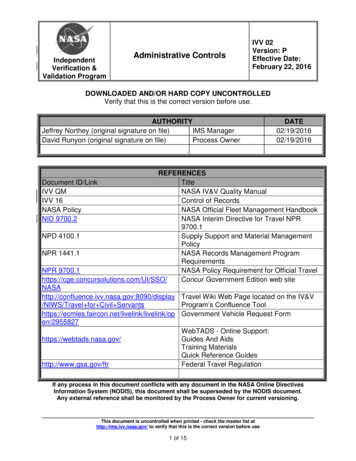
1 – Messenger2 – STEREO3 – AIM4 – IBEX5 – LRO6 – CloudSat7 – DAWN8 – GRAIL9 – JUNO10 – Kepler11 – OCO12 – OSTM13 – Phoenix14 – Spitzer15 – Calipso16 – MRO17 – GLAST18 – AQUA19 – COBE20 – CONTOUR21 – Deep Impact22 – FAST23 – GALEX24 – GENESIS25 – LANDSAT 726 – LCROSS27 – Mars Pathfinder28 – NEAR29 – New Horizons30 – RHESSI31 – SAMPEX32 – Stardust33 – SWAS34 – TIMED35 – TRACE36 – TRMM37 – WIRE38 – MSL39 – MERMost ComplexMSL1.000Spacevehicle0.9000.8000.700Least 6789 10 11 12 13 14 15 16 17 18 19 20 21 22 23 24 25 26 27 28 29 30 31 32 33 34 35 36 37Five (5) Most ComplexFive (5) Least Complex MSL (#36) AIM (#3) OSTM (#12) LCROSS (#26) TRMM (#36) COBE (#19) GALEX (#23) TRACE (#35) JUNO (#9) FAST(#22)PRT – 183 , AUGUST 2014APPROVED FOR PUBLIC RELEASETECOLOTE RESEARCH
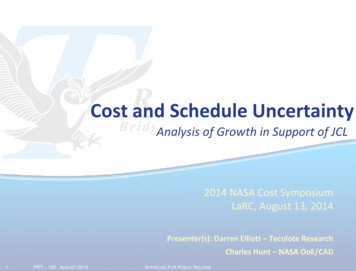
Relationship Between Cost and ComplexityPRT – 183 , AUGUST 2014APPROVED FOR PUBLIC RELEASETECOLOTE RESEARCH
Challenges in the Framework Attributes limited to data available in CADRe, peer review identifiedadditional potential drivers for consideration Some missions lacked all data, so removed from analysis – result isdataset reduced to 37 missions Calculations currently based on equi-weighting of attributes, some mayneed to have a higher weight Work in progress – but initial results indicate stratification potential oruse to assess uncertainty vs complexity20PRT – 183 , AUGUST 2014APPROVED FOR PUBLIC RELEASETECOLOTE RESEARCH
Cost and Schedule Uncertainty GuidelinesStep 3 – Data Collection21PRT – 183 , AUGUST 2014APPROVED FOR PUBLIC RELEASETECOLOTE RESEARCH
Developed Mapped and Normalized Cost Dataset22 Identified 18 missions having a completetemporal (PDR, CDR, and launch) CADRedataset Mapped time phased data to NASAstandard subsystem WBS Normalized cost to BY2010 K Separated the cost into Phase A, PhaseB/C/D, and Phase E Developed estimate growth factors for each WBS by milestone for Phase B/C/D Launch Final Cost / CDR Estimate CDR Growth Factor Launch Final Cost / PDR Estimate PDR Growth FactorPRT – 183 , AUGUST 2014APPROVED FOR PUBLIC RELEASETECOLOTE RESEARCH
Developed a Normalized Schedule Dataset Developed standardized ScheduleCollection structure Obtained source CADRe schedules for the18 missions for which temporal cost datawas available Captured key schedule dates from thesource files Created 108 work-day duration metrics bysubsystem for 17 of the 18 missions Developed duration growth factors for the108 metrics Dataset enables: Historical duration growth analysis for majorwork efforts Alignment of cost and schedule metrics forcorrelation and sensitivity analysis A framework for continued data collection A potential template for a high-levelschedule model for us in Phase A orparametric analysis23PRT – 183 , AUGUST 2014APPROVED FOR PUBLIC RELEASETECOLOTE RESEARCH
Challenges in Data Collection24 At time of the study, CADRe/ONCE contains raw project data (no normalizeddataset) - extensive mapping, allocation, and normalization was required Although an extensive amount of missions in CADRe, only a subset (18) had multiplemilestones captured Detailed schedule data is lacking in CADRe and source documents, additional focusneeded to enhance capability to develop appropriate growth metrics Although limitations, the resulting dataset was consistent, complete, and useful forgrowth analysis – continued population of CADRe’s will improve dataset and analysisPRT – 183 , AUGUST 2014APPROVED FOR PUBLIC RELEASETECOLOTE RESEARCH
Cost and Schedule Uncertainty GuidelinesStep 4 – Analysis andStratification25PRT – 183 , AUGUST 2014APPROVED FOR PUBLIC RELEASETECOLOTE RESEARCH
Does Growth Relate to Complexity?26PRT – 183 , AUGUST 2014APPROVED FOR PUBLIC RELEASETECOLOTE RESEARCH
Used Three (3) Complexity Bins (Low, Med, High)27PRT – 183 , AUGUST 2014APPROVED FOR PUBLIC RELEASETECOLOTE RESEARCH
PDR Dispersion Slightly Higher than CDR28PRT – 183 , AUGUST 2014APPROVED FOR PUBLIC RELEASETECOLOTE RESEARCH
Distributions Determined from Bins(Low 0-0.4, Med 0.4 -0.7, High 0.7)PDRMeanStd DevCV29LowMediumHighCDRComplexity Complexity Complexity1.4091.5211.353Mean0.2540.4590.312Std Dev0.180.300.23CVPRT – 183 , AUGUST 2014APPROVED FOR PUBLIC RELEASELowMediumHighComplexity Complexity 27TECOLOTE RESEARCH
Duration Growth – All SubsystemsSpace Vehicle PDR - LaunchSpace Vehicle SVI&T- ShipSpaceraft PDR - S/C I&T StartS/C I&T Start - S/C DlvryStructures & Mechanisms PDR - SS DlvryThermal Control PDR - SS DlvryEPS PDR - SS DlvryGN&C PDR - SS DlvryPropulsion PDR - SS DlvryCommunciations PDR - SS DlvryC&DH - SS DlvryInstrument PDR - Instrument DlvryPDRMeanStd DevCV30LowMediumHighComplexity Complexity 46PRT – 183 , AUGUST 2014CDRMeanStd DevCVAPPROVED FOR PUBLIC RELEASELowMediumHighComplexity Complexity 44TECOLOTE RESEARCH
Challenges in Data Analysis Sample size of 18 missions is small - aggregation of all data points allows for investigation ofpremise (complexity affects growth range) and to ascertain bins 31Due to small sample size, some bins for subsystems are non-existent or have very limited data points(1-3)Low complexity bins for some subsystems showed a higher growth and dispersion than the Mediumcomplexity – opposite of expectations Many metrics to report for duration, identified a subset for use and publication Cost distributions need to be developed for TI and TD (Burn Rate) aspects Distributions identified are typically at a level higher than JCL model inputs Duration distributions should ideally be at task level, available data is not at that granularityPRT – 183 , AUGUST 2014APPROVED FOR PUBLIC RELEASETECOLOTE RESEARCH
Cost and Schedule Uncertainty GuidelinesStep 5 – Calibration32PRT – 183 , AUGUST 2014APPROVED FOR PUBLIC RELEASETECOLOTE RESEARCH
Four Areas of CalibrationDetermining projectspecific relevant rangeDistributions for TI and TD(Burn Rate)Derivation of distributionsfor lower-level of detailMechanism for avoiding riskdouble-count33PRT – 183 , AUGUST 2014APPROVED FOR PUBLIC RELEASETECOLOTE RESEARCH
Historical Distributions are Starting Points Growth distributions based onhistorical projects provide areference point (starting position) Through understanding the projectsin the dataset, analysts can adjustthe distribution Identification of differences providesrationale for why the historical rangeis not relevant and enablesdetermination of reasonabledistribution for the project 34Reference DistributionIf the project is deemed to moremature - scale both the averagegrowth and dispersion If the project is deemed to beless complex - scale the averagegrowth If the project is deemed to haveless risk/uncertainty - scale thedispersionPRT – 183 , AUGUST 2014APPROVED FOR PUBLIC RELEASELess Complex /RiskyMore MatureTECOLOTE RESEARCH
JCL models require TD and TI distributions35 Total Time Dependent (TD)costs are affected byduration and burn rate Objective is to develophistorical growth on burnrates Step 1: Determine TDportion of Total Cost Step 2: Divide TD by relevantduration Step 3: Analyze growth Analyzed six (6) recent JCLmodels to identify averageTD ratio by subsystem Used average TD ratio tobreak out subsystem cost byphase into TD and TI bucketsPRT – 183 , AUGUST 2014APPROVED FOR PUBLIC RELEASETECOLOTE RESEARCH
TD (Burn Rate) Cost Growth – All Subsystems36PRT – 183 , AUGUST 2014APPROVED FOR PUBLIC RELEASETECOLOTE RESEARCH
Time Independent (TI) Cost Growth (all subsystems)37PRT – 183 , AUGUST 2014APPROVED FOR PUBLIC RELEASETECOLOTE RESEARCH
Considerations for Lower Level Application Schedule models differ from cost models –order versus summation statistics In summation models, analytic techniquescan be used to derive summationdistributions from lower level distributions. Conversely, given certain conditions, lowerlevel distributions can be derived from asummary distribution. Note: lower leveldistributions will be broader than summary Reducing the network under a schedulesummary to a linear path enables similarmethods to applySource: Covert, Ray, “Analytical Method for Probabilistic Cost and Schedule Analysis,“ NASA CAD Research, April 2013Source: Book, S.A ,Schedule Risk Analysis: Why it is Important and How to Do It,“ GASW Workshop 2002, March 200238PRT – 183 , AUGUST 2014APPROVED FOR PUBLIC RELEASETECOLOTE RESEARCH
The Equation – Solving for Lower Level Distributions toMatch Summary Mean and 80% value39 Basic Formula Given an assumed correlationPRT – 183 , AUGUST 2014APPROVED FOR PUBLIC RELEASETECOLOTE RESEARCH
Calculating the Resulting Log-Normal Distributions40PRT – 183 , AUGUST 2014APPROVED FOR PUBLIC RELEASETECOLOTE RESEARCH
Summary Distribution Allocation Process(Reducing to a Linear Path)2)1)Determinepath arythe start to endto fromallocateof the summary3) Reduce to a Linear Path41PRT – 183 , AUGUST 2014APPROVED FOR PUBLIC RELEASETECOLOTE RESEARCH
Summary Distribution Allocation Process(Calculating Lower Level Distributions)2 – specify summary statistics1 – enter durations42PRT – 183 , AUGUST 20143 – specify correlation and calculate PEVAPPROVED FOR PUBLIC RELEASE4 – determine distributionsTECOLOTE RESEARCH
Summary Distribution Allocation Process(Implementing Distributions) For tasks on the identifiedpath, use the calculateddistributions For tasks not on the path,use the summary distributionwith the mean growthslightly lower Apply the correlationassumption43PRT – 183 , AUGUST 2014APPROVED FOR PUBLIC RELEASETECOLOTE RESEARCH
Summary Distribution Allocation Process(Verifying Result) Compare calculated distribution versus target for mean and 80%Cumulative Distribution FunctionSummary DistributionAllocated 0.46.501.48.433.48.484.51.298.50.992.PRT – 183 , AUGUST 2014APPROVED FOR PUBLIC RELEASETECOLOTE RESEARCH
Avoiding Double-Counting for Risks(Background)45 Use of historical data, implies the captureof typical risks affecting past projects Best practice implies understanding therisks inherent in the dataset, and modelingonly the additional risks Recent studies by NASA HQ has identifiedchallenges in identifying the specific riskevents that have occurred on historicalprojects Is there a middle road? Can projects include all identified risks toensure the nuances of their occurrence ripplesinto their project plans? Can the reference distribution be adjusted toaccount for a subset of risks that are deemedto be in the historical data?PRT – 183 , AUGUST 2014Source: Butts, Glenn, “Uncertainty Approach, “ NASA Cost Symposium 2013, August 2013APPROVED FOR PUBLIC RELEASETECOLOTE RESEARCH
Adjusting Reference Distribution(Process)Implement all risks into a JCL ModelIdentify which risks are considered be included in the dataset (doublecount risks)Run the model with uncertainty off and only the double-count risksactivatedObtain cost and schedule statistics (point estimate, mean, standarddeviation) for the appropriate summariesCalculate an adjusted reference distribution by determining the distributionneeded to combine with double-count risks to replicate the original reference46PRT – 183 , AUGUST 2014APPROVED FOR PUBLIC RELEASETECOLOTE RESEARCH
Avoiding Double-Counting for Risks(Calculation) Identify Reference Distribution, for example Estimate 100 Mean growth 30%; mean 130 Std Dev 25%; std Dev 25Calculate statistics for model with doublecount risks and no uncertainty, for example Estimate 100 Mean growth 10%; mean 110 Std Dev % of PE 5%; std Dev 5Solve adjusted reference distribution Adjusted Mean reference mean – mean of doublecount risk Adjusted Std Dev % of PE (PEV) Adj Std Dev / PE ((reference SD 2) – (double count SD 2)) (0.5))/ pt estimate 47130 – 110 120; 20% mean growthAdjusted Std Dev (((25 2)-(5 2)) 0.5); ((625-25) 0.5) 0; (600 0.5)/100 ; 24.4949; PEV 24.4949%PRT – 183 , AUGUST 2014Target Total (Reference Distribution) 15,300.000 {12%)WBS/CES Description 19,889.85stdDev 3,824.82JCLModelAdjusted ReferenceDiscrete Risks -Doublecount 19,889.97 18,431.93 1,458.05 162.22 16.73 3.62 5.05 101.36 48.50 341.23 16.77 3.55 5.04 168.23 161.99 4.73 1.01 5.17 161.73 16.68 3.66 4.95 161.90 4.72 1.04 10.91 35.29 0.98 10.99 3,770.53 3,673.86 850.25 346.75 35.98 7.91 11.35 139.36 109.42 436.71 36.07 7.78 11.33 145.42 346.29 20.75 4.50 11.61 345.74 35.88 8.00 11.11 346.07 20.73 4.62 14.83 45.54 4.38 14.98Risk 1Risk 2Risk 3Risk4Risk SRisk 6Risk 7Risk SRisk 9Risk 10Risk 11Risk 12Risk 13Risk 14Risk 15Risk 16Risk 17Risk 18Risk 19Risk 20Risk 21Risk 22Risk 23Risk 24Risk 25Risk 26APPROVED FOR PUBLIC RELEASEPoint Estimate 15,300.000 {12%) 15,300.000 {21%) 0.00 0.00 0.00 0.00 0.00 0.00 0.00 0.00 0.00 0.00 0.00 0.00 0.00 0.00 0.00 0.00 0.00 0.00 0.00 0.00 0.00 0.00 0.00 0.00 0.00 0.00 0.00Mean80% 23,189.04 23,169.59 21,592.15 2,255.89 858.84 82.33 15.81 19.42 258.20 190.33 900.55 82.78 15.37 19.94 314.17 855.97TECOLOTE RESEARCH 20.19 855.02 82.58 16.11 19.16 857.74 28.41 92.49 28.65
Challenges in Calibration Application in JCL models requires specification of TD and TI uncertainty distributions, improvement in datacollection in CADRe’s to provide visibility at subsystem will improve overall quality of results for theseparameters Technique for allocating summary to details requires several major assumptions 48The identified critical path is the major critical path for all simulation runsAll risks on the critical path have the same risk postureTechnique ignores impact from links external to the summary Obtaining data on actual task level variance grouped by duration length and effort phase (design,fabrication, test, etc) and WBS will provide enhanced duration metrics Removal of double-count risk requires indication of what risks historically affect projects, improvement indata collection to categorize and identify risk resolution on past projects will improve capability in the field.PRT – 183 , AUGUST 2014APPROVED FOR PUBLIC RELEASETECOLOTE RESEARCH
JCL UncertaintyNext Steps49PRT – 183 , AUGUST 2014APPROVED FOR PUBLIC RELEASETECOLOTE RESEARCH
In Conclusion GuidanceDataCapabilityForwardPlan NASA has enough information to make informed uncertaintydecisions – the data is there! Definitive guidance will be difficult to produce for inputs Data does allow for general guidelines for cross-checks Data collection has come along way in the last 10 years There are still many areas to improve upon Activity level task duration actuals Consistent CBS between projects TD and TI breakouts Correlation assumptions Product is a work in process Additional work on all areas (complexity generation, data fidelity, dataanalysis/trends, etc) Data will be made available to community (ONCE) inSeptember time frame There are other techniques* to tackle this problem thatneed to be incorporated in the uncertainty “portfolio”*Several examples are being presented at this Symposium!50PRT – 183 , AUGUST 2014APPROVED FOR PUBLIC RELEASETECOLOTE RESEARCH
Acknowledgements Uncertainty Team Tecolote Research Spaceworks Engineering Joe Hamaker (Galorath) William Jarvis (NASA HQ) Eric Plumer (NASA HQ) Steve Hanna (NASA MSFC) Michael Dinicola, Michael (JPL) Kelli Mccoy (JPL) Steve Shinn (NASA GSFC) Param Nair (NASA GSFC) Voleak Roeum (NASA HQ) Tupper Hyde (NASA HQ) Larry Wolfarth (NASA HQ) Rich Greathouse (NASA HQ)Justin HornbackCAD Support 51Dominic DePasqualeElizabeth BuchenJohn Bradford Reed Integration Chad BielawaskiVincent LaRoucheJohn TrevillionJeff McDowellShu-Ping HuDarren ElliottMatt BlockerLinda MilamTony HarveyTamkin Amin Complexity Peer ReviewTed MillsPRT – 183 , AUGUST 2014APPROVED FOR PUBLIC RELEASETECOLOTE RESEARCH
Thank YouFor More Information:Darren Elliott – delliott@tecolote.comCharles Hunt – charles.d.hunt@nasa.gov52PRT – 183 , AUGUST 2014APPROVED FOR PUBLIC RELEASETECOLOTE RESEARCH
lack of data, however over the past 7 years through the CADRe initiative NASA has been building a robust archive of project cost, schedule, and technical data at various points in a projects technical maturity. This data provided an opportunity to assess and determine if cost and schedule g