Transcription
United StatesEnvironmental ProtectionAgencyOffice of EnvironmentalInformationWashington, DC 20460EPA/240/R-02/005December 2002Guidance on Choosing aSampling Design for EnvironmentalData CollectionytilauQfor Use in Developing a QualityAssurance Project PlanEPA QA/G-5S
FOREWORDThis document, Guidance for Choosing a Sampling Design for Environmental DataCollection (EPA QA/G-5S), will provide assistance in developing an effective QA Project Plan asdescribed in Guidance for QA Project Plans (EPA QA/G-5) (EPA 1998b). QA Project Plans areone component of EPA’s Quality System. This guidance is different from most guidance in that it is notmeant to be read in a linear or continuous fashion, but to be used as a resource or reference document.This guidance is a “tool-box” of statistical designs that can be examined for possible use as the QAProject Plan is being developed.EPA works every day to produce quality information products. The information used in theseproducts are based on Agency processes to produce quality data, such as the quality system describedin this document. Therefore, implementation of the activities described in this document is consistentwith EPA’s Information Quality Guidelines and promotes the dissemination of quality technical,scientific, and policy information and decisions.This document provides guidance to EPA program managers, analysts, and planning teams onstatistically based sampling schemes. It does not impose legally binding requirements and the methodsdescribed may not apply to a particular situation based on the circumstances. The Agency retains thediscretion to adopt approaches on a case-by-case basis that may differ from the techniques describedin this guidance. EPA may periodically revise this guidance without public notice. It is the intent of theQuality Staff to revise the document to include: new techniques, corrections, and suggestions foralternative techniques. Future versions of this document will include examples in depth that illustrate thestrengths of each statistical design.This document is one of the U.S. Environmental Protection Agency Quality System Seriesdocuments. These documents describe the EPA policies and procedures for planning, implementing,and assessing the effectiveness of a Quality System. Questions regarding this document or otherQuality System Series documents should be directed to the Quality Staff:U.S. Environmental Protection AgencyQuality Staff (2811R)1200 Pennsylvania Ave., NWWashington, D.C. 20460Phone: (202) 564-6830Fax: (202) 565-2441E-mail: quality@epa.govCopies of EPA Quality System Series documents may be obtained from the Quality Staff or bydownloading them from epa.gov/quality/index.html.EPA QA/G-5SiFinalDecember 2002
EPA QA/G-5SiiFinalDecember 2002
TABLE OF CONTENTS1.PageINTRODUCTION . . . . . . . . . . . . . . . . . . . . . . . . . . . . . . . . . . . . . . . . . . . . . . . . . . . . . . 11.1WHY IS SELECTING AN APPROPRIATE SAMPLING DESIGNIMPORTANT? . . . . . . . . . . . . . . . . . . . . . . . . . . . . . . . . . . . . . . . . . . . . . . . . . . . . 11.2WHAT TYPES OF QUESTIONS WILL THIS GUIDANCE ADDRESS? . . . . . . . 21.3WHO CAN BENEFIT FROM THIS DOCUMENT? . . . . . . . . . . . . . . . . . . . . . . . 31.4HOW DOES THIS DOCUMENT FIT INTO THE EPA QUALITY SYSTEM? . . 41.5WHAT SOFTWARE SUPPLEMENTS THIS GUIDANCE? . . . . . . . . . . . . . . . . . 51.6WHAT ARE THE LIMITATIONS OR CAVEATS TO THIS DOCUMENT? . . . . 51.7HOW IS THIS DOCUMENT ORGANIZED? . . . . . . . . . . . . . . . . . . . . . . . . . . . . 62.OVERVIEW OF SAMPLING DESIGNS . . . . . . . . . . . . . . . . . . . . . . . . . . . . . . . . . . . . 72.1OVERVIEW . . . . . . . . . . . . . . . . . . . . . . . . . . . . . . . . . . . . . . . . . . . . . . . . . . . . . . 72.2SAMPLING DESIGN CONCEPTS AND TERMS . . . . . . . . . . . . . . . . . . . . . . . . 82.3PROBABILISTIC AND JUDGMENTAL SAMPLING DESIGNS . . . . . . . . . . . 102.4TYPES OF SAMPLING DESIGNS . . . . . . . . . . . . . . . . . . . . . . . . . . . . . . . . . . . 112.4.1 Judgmental Sampling . . . . . . . . . . . . . . . . . . . . . . . . . . . . . . . . . . . . . . . . . 122.4.2 Simple Random Sampling . . . . . . . . . . . . . . . . . . . . . . . . . . . . . . . . . . . . . . 122.4.3 Stratified Sampling . . . . . . . . . . . . . . . . . . . . . . . . . . . . . . . . . . . . . . . . . . . 132.4.4 Systematic and Grid Sampling . . . . . . . . . . . . . . . . . . . . . . . . . . . . . . . . . . 132.4.5 Ranked Set Sampling . . . . . . . . . . . . . . . . . . . . . . . . . . . . . . . . . . . . . . . . . 142.4.6 Adaptive Cluster Sampling . . . . . . . . . . . . . . . . . . . . . . . . . . . . . . . . . . . . . 152.4.7 Composite Sampling . . . . . . . . . . . . . . . . . . . . . . . . . . . . . . . . . . . . . . . . . 153.THE SAMPLING DESIGN PROCESS . . . . . . . . . . . . . . . . . . . . . . . . . . . . . . . . . . . . 173.1OVERVIEW . . . . . . . . . . . . . . . . . . . . . . . . . . . . . . . . . . . . . . . . . . . . . . . . . . . . . 173.2.INPUTS TO THE SAMPLING DESIGN PROCESS . . . . . . . . . . . . . . . . . . . . . . 173.3STEPS IN THE SAMPLING DESIGN PROCESS . . . . . . . . . . . . . . . . . . . . . . . 223.4SELECTING A SAMPLING DESIGN . . . . . . . . . . . . . . . . . . . . . . . . . . . . . . . . . 244.JUDGMENTAL SAMPLING . . . . . . . . . . . . . . . . . . . . . . . . . . . . . . . . . . . . . . . . . . . . 274.1OVERVIEW . . . . . . . . . . . . . . . . . . . . . . . . . . . . . . . . . . . . . . . . . . . . . . . . . . . . . 274.2APPLICATION . . . . . . . . . . . . . . . . . . . . . . . . . . . . . . . . . . . . . . . . . . . . . . . . . . 274.3BENEFITS . . . . . . . . . . . . . . . . . . . . . . . . . . . . . . . . . . . . . . . . . . . . . . . . . . . . . . 284.4LIMITATIONS . . . . . . . . . . . . . . . . . . . . . . . . . . . . . . . . . . . . . . . . . . . . . . . . . . . 284.5IMPLEMENTATION . . . . . . . . . . . . . . . . . . . . . . . . . . . . . . . . . . . . . . . . . . . . . . 284.6RELATIONSHIP TO OTHER SAMPLING DESIGNS . . . . . . . . . . . . . . . . . . . . 29EPA QA/G-5SiiiFinalDecember 2002
4.74.8PageEXAMPLES OF SUCCESSFUL USE . . . . . . . . . . . . . . . . . . . . . . . . . . . . . . . . . 30EXAMPLES OF UNSUCCESSFUL USE . . . . . . . . . . . . . . . . . . . . . . . . . . . . . . 315.SIMPLE RANDOM SAMPLING . . . . . . . . . . . . . . . . . . . . . . . . . . . . . . . . . . . . . . . . . 335.1OVERVIEW . . . . . . . . . . . . . . . . . . . . . . . . . . . . . . . . . . . . . . . . . . . . . . . . . . . . . 335.2APPLICATION . . . . . . . . . . . . . . . . . . . . . . . . . . . . . . . . . . . . . . . . . . . . . . . . . . 335.3BENEFITS . . . . . . . . . . . . . . . . . . . . . . . . . . . . . . . . . . . . . . . . . . . . . . . . . . . . . . 345.4LIMITATIONS . . . . . . . . . . . . . . . . . . . . . . . . . . . . . . . . . . . . . . . . . . . . . . . . . . . 345.5IMPLEMENTATION . . . . . . . . . . . . . . . . . . . . . . . . . . . . . . . . . . . . . . . . . . . . . . 355.6RELATIONSHIP TO OTHER SAMPLING DESIGNS . . . . . . . . . . . . . . . . . . . . 395.7EXAMPLES . . . . . . . . . . . . . . . . . . . . . . . . . . . . . . . . . . . . . . . . . . . . . . . . . . . . . 40APPENDIX 5. SAMPLE SIZE TABLES . . . . . . . . . . . . . . . . . . . . . . . . . . . . . . . . . . . . . 446.STRATIFIED SAMPLING . . . . . . . . . . . . . . . . . . . . . . . . . . . . . . . . . . . . . . . . . . . . . . 516.1OVERVIEW . . . . . . . . . . . . . . . . . . . . . . . . . . . . . . . . . . . . . . . . . . . . . . . . . . . . . 516.2APPLICATION . . . . . . . . . . . . . . . . . . . . . . . . . . . . . . . . . . . . . . . . . . . . . . . . . . 516.3BENEFITS . . . . . . . . . . . . . . . . . . . . . . . . . . . . . . . . . . . . . . . . . . . . . . . . . . . . . . 526.4LIMITATIONS . . . . . . . . . . . . . . . . . . . . . . . . . . . . . . . . . . . . . . . . . . . . . . . . . . . 536.5IMPLEMENTATION . . . . . . . . . . . . . . . . . . . . . . . . . . . . . . . . . . . . . . . . . . . . . . 536.6RELATIONSHIP TO OTHER SAMPLING DESIGNS . . . . . . . . . . . . . . . . . . . . 546.7EXAMPLE . . . . . . . . . . . . . . . . . . . . . . . . . . . . . . . . . . . . . . . . . . . . . . . . . . . . . . 55APPENDIX 6-A. FORMULAE FOR ESTIMATING SAMPLE SIZE . . . . . . . . . . . . . . 57APPENDIX 6-B. DALENIUS-HODGES PROCEDURE . . . . . . . . . . . . . . . . . . . . . . . . 59APPENDIX 6-C. CALCULATING THE MEAN AND STANDARD ERROR . . . . . . . . 607.SYSTEMATIC/GRID SAMPLING . . . . . . . . . . . . . . . . . . . . . . . . . . . . . . . . . . . . . . . 637.1OVERVIEW . . . . . . . . . . . . . . . . . . . . . . . . . . . . . . . . . . . . . . . . . . . . . . . . . . . . . 637.2APPLICATION . . . . . . . . . . . . . . . . . . . . . . . . . . . . . . . . . . . . . . . . . . . . . . . . . . 647.3BENEFITS . . . . . . . . . . . . . . . . . . . . . . . . . . . . . . . . . . . . . . . . . . . . . . . . . . . . . . 677.4LIMITATIONS . . . . . . . . . . . . . . . . . . . . . . . . . . . . . . . . . . . . . . . . . . . . . . . . . . . 687.5IMPLEMENTATION . . . . . . . . . . . . . . . . . . . . . . . . . . . . . . . . . . . . . . . . . . . . . . 697.6RELATIONSHIP TO OTHER SAMPLING DESIGNS . . . . . . . . . . . . . . . . . . . . 717.7EXAMPLES . . . . . . . . . . . . . . . . . . . . . . . . . . . . . . . . . . . . . . . . . . . . . . . . . . . . . 728.RANKED SET SAMPLING . . . . . . . . . . . . . . . . . . . . . . . . . . . . . . . . . . . . . . . . . . . . . 778.1OVERVIEW . . . . . . . . . . . . . . . . . . . . . . . . . . . . . . . . . . . . . . . . . . . . . . . . . . . . . 778.2APPLICATION . . . . . . . . . . . . . . . . . . . . . . . . . . . . . . . . . . . . . . . . . . . . . . . . . . 808.3BENEFITS . . . . . . . . . . . . . . . . . . . . . . . . . . . . . . . . . . . . . . . . . . . . . . . . . . . . . . 808.4LIMITATIONS . . . . . . . . . . . . . . . . . . . . . . . . . . . . . . . . . . . . . . . . . . . . . . . . . . . 82EPA QA/G-5SivFinalDecember 2002
Page8.5IMPLEMENTATION . . . . . . . . . . . . . . . . . . . . . . . . . . . . . . . . . . . . . . . . . . . . . . 838.6EXAMPLES . . . . . . . . . . . . . . . . . . . . . . . . . . . . . . . . . . . . . . . . . . . . . . . . . . . . 84APPENDIX 8-A. USING RANKED SET SAMPLING . . . . . . . . . . . . . . . . . . . . . . . . . 879.ADAPTIVE CLUSTER SAMPLING . . . . . . . . . . . . . . . . . . . . . . . . . . . . . . . . . . . . . 1039.1OVERVIEW . . . . . . . . . . . . . . . . . . . . . . . . . . . . . . . . . . . . . . . . . . . . . . . . . . . . 1039.2APPLICATION . . . . . . . . . . . . . . . . . . . . . . . . . . . . . . . . . . . . . . . . . . . . . . . . . 1039.3BENEFITS . . . . . . . . . . . . . . . . . . . . . . . . . . . . . . . . . . . . . . . . . . . . . . . . . . . . . 1049.4LIMITATIONS . . . . . . . . . . . . . . . . . . . . . . . . . . . . . . . . . . . . . . . . . . . . . . . . . . 1049.5IMPLEMENTATION . . . . . . . . . . . . . . . . . . . . . . . . . . . . . . . . . . . . . . . . . . . . . 1069.6RELATIONSHIP TO OTHER SAMPLING DESIGNS . . . . . . . . . . . . . . . . . . . 1089.7EXAMPLE . . . . . . . . . . . . . . . . . . . . . . . . . . . . . . . . . . . . . . . . . . . . . . . . . . . . . 109APPENDIX 9-A. ESTIMATORS OF MEAN AND VARIANCE . . . . . . . . . . . . . . . . . 11110.COMPOSITE SAMPLING . . . . . . . . . . . . . . . . . . . . . . . . . . . . . . . . . . . . . . . . . . . . . 11910.1 OVERVIEW . . . . . . . . . . . . . . . . . . . . . . . . . . . . . . . . . . . . . . . . . . . . . . . . . . . . 11910.2 COMPOSITE SAMPLING FOR ESTIMATING A MEAN . . . . . . . . . . . . . . . . 12210.2.1 Overview . . . . . . . . . . . . . . . . . . . . . . . . . . . . . . . . . . . . . . . . . . . . . . . . . 12210.2.2 Application . . . . . . . . . . . . . . . . . . . . . . . . . . . . . . . . . . . . . . . . . . . . . . . 12410.2.3 Benefits . . . . . . . . . . . . . . . . . . . . . . . . . . . . . . . . . . . . . . . . . . . . . . . . . . 12510.2.4 Limitations . . . . . . . . . . . . . . . . . . . . . . . . . . . . . . . . . . . . . . . . . . . . . . . . 12510.2.5 Implementation . . . . . . . . . . . . . . . . . . . . . . . . . . . . . . . . . . . . . . . . . . . . . 12710.2.6 Relationship to Other Sampling Designs . . . . . . . . . . . . . . . . . . . . . . . . . . 13010.2.7 Examples . . . . . . . . . . . . . . . . . . . . . . . . . . . . . . . . . . . . . . . . . . . . . . . . . 13310.3 COMPOSITE SAMPLING FOR ESTIMATING A POPULATIONPROPORTION . . . . . . . . . . . . . . . . . . . . . . . . . . . . . . . . . . . . . . . . . . . . . . . . . . 13310.3.1 Overview . . . . . . . . . . . . . . . . . . . . . . . . . . . . . . . . . . . . . . . . . . . . . . . . . 13310.3.2 Application . . . . . . . . . . . . . . . . . . . . . . . . . . . . . . . . . . . . . . . . . . . . . . . 13410.3.3 Benefits . . . . . . . . . . . . . . . . . . . . . . . . . . . . . . . . . . . . . . . . . . . . . . . . . . 13510.3.4 Limitations . . . . . . . . . . . . . . . . . . . . . . . . . . . . . . . . . . . . . . . . . . . . . . . . 13510.3.5 Implementation . . . . . . . . . . . . . . . . . . . . . . . . . . . . . . . . . . . . . . . . . . . . . 13510.3.6 Relationship to Other Sampling Designs . . . . . . . . . . . . . . . . . . . . . . . . . . 13710.3.7 Examples . . . . . . . . . . . . . . . . . . . . . . . . . . . . . . . . . . . . . . . . . . . . . . . . . 137APPENDIX 10-A. COST AND VARIANCE MODELS . . . . . . . . . . . . . . . . . . . . . . . 138APPENDIX 10-B. ESTIMATING A POPULATION PROPORTION . . . . . . . . . . . . . 141EPA QA/G-5SvFinalDecember 2002
11.PageCOMPOSITE SAMPLING FOR IDENTIFYING A TRAIT AND EXTREMESAMPLING UNITS . . . . . . . . . . . . . . . . . . . . . . . . . . . . . . . . . . . . . . . . . . . . . . . . . . . 14311.1 COMPOSITE SAMPLING FOR IDENTIFYING A TRAIT . . . . . . . . . . . . . . . 14311.1.1 Overview . . . . . . . . . . . . . . . . . . . . . . . . . . . . . . . . . . . . . . . . . . . . . . . . . 14311.1.2 Application . . . . . . . . . . . . . . . . . . . . . . . . . . . . . . . . . . . . . . . . . . . . . . . 14411.1.3 Benefits . . . . . . . . . . . . . . . . . . . . . . . . . . . . . . . . . . . . . . . . . . . . . . . . . . 14511.1.4 Limitations . . . . . . . . . . . . . . . . . . . . . . . . . . . . . . . . . . . . . . . . . . . . . . . . 14511.1.5 Implementation . . . . . . . . . . . . . . . . . . . . . . . . . . . . . . . . . . . . . . . . . . . . . 14511.1.6 Relationship to Other Sampling Designs . . . . . . . . . . . . . . . . . . . . . . . . . . 14911.1.7 Examples . . . . . . . . . . . . . . . . . . . . . . . . . . . . . . . . . . . . . . . . . . . . . . . . . 15111.2 COMPOSITE SAMPLING AND RETESTING FOR IDENTIFYINGEXTREME SAMPLING UNITS . . . . . . . . . . . . . . . . . . . . . . . . . . . . . . . . . . . . 15111.2.1 Overview . . . . . . . . . . . . . . . . . . . . . . . . . . . . . . . . . . . . . . . . . . . . . . . . . 15111.2.2 Application . . . . . . . . . . . . . . . . . . . . . . . . . . . . . . . . . . . . . . . . . . . . . . . 15311.2.3 Benefits . . . . . . . . . . . . . . . . . . . . . . . . . . . . . . . . . . . . . . . . . . . . . . . . . . 15311.2.4 Limitations . . . . . . . . . . . . . . . . . . . . . . . . . . . . . . . . . . . . . . . . . . . . . . . . 15311.2.5 Implementation . . . . . . . . . . . . . . . . . . . . . . . . . . . . . . . . . . . . . . . . . . . . . 15311.2.6 Relationship to Other Sampling Designs . . . . . . . . . . . . . . . . . . . . . . . . . . 154GLOSSARY OF TERMS . . . . . . . . . . . . . . . . . . . . . . . . . . . . . . . . . . . . . . . . . . . . . . . . . . . . . 155BIBLIOGRAPHY . . . . . . . . . . . . . . . . . . . . . . . . . . . . . . . . . . . . . . . . . . . . . . . . . . . . . . . . . . . 161EPA QA/G-5SviFinalDecember 2002
FIGURESPage1-1. Site Map for Old Lagoon . . . . . . . . . . . . . . . . . . . . . . . . . . . . . . . . . . . . . . . . . . . . . . . . . . . 21-2. Life-cycle of Data in the EPA Quality System . . . . . . . . . . . . . . . . . . . . . . . . . . . . . . . . . . . . 42-1. Inferences Drawn from Judgmental versus Probabilistic Sampling Designs . . . . . . . . . . . . . . 112-2. Simple Random Sampling . . . . . . . . . . . . . . . . . . . . . . . . . . . . . . . . . . . . . . . . . . . . . . . . . . 122-3. Stratified Sampling . . . . . . . . . . . . . . . . . . . . . . . . . . . . . . . . . . . . . . . . . . . . . . . . . . . . . . . 132-4. Systematic/Grid Sampling . . . . . . . . . . . . . . . . . . . . . . . . . . . . . . . . . . . . . . . . . . . . . . . . . . 142-5. Adaptive Cluster Sampling . . . . . . . . . . . . . . . . . . . . . . . . . . . . . . . . . . . . . . . . . . . . . . . . . 152-6. Composite Sampling . . . . . . . . . . . . . . . . . . . . . . . . . . . . . . . . . . . . . . . . . . . . . . . . . . . . . 153-1. The DQO Process . . . . . . . . . . . . . . . . . . . . . . . . . . . . . . . . . . . . . . . . . . . . . . . . . . . . . . . 183-2. Factors in Selecting a Sampling Design . . . . . . . . . . . . . . . . . . . . . . . . . . . . . . . . . . . . . . . . 203-3. The Sampling Design Process . . . . . . . . . . . . . . . . . . . . . . . . . . . . . . . . . . . . . . . . . . . . . . . 225-1. Example of a Map Showing Random Sampling Locations . . . . . . . . . . . . . . . . . . . . . . . . . . 375-2. A One-Dimensional Sample of Cross-Sections from a Waste Pile . . . . . . . . . . . . . . . . . . . . 385-3. A Two-Dimensional Sample of Cores from a Waste Pile . . . . . . . . . . . . . . . . . . . . . . . . . . . 395-4. Illustration of a Quasi-Random Sample . . . . . . . . . . . . . . . . . . . . . . . . . . . . . . . . . . . . . . . . 396-1. Stratification of Area to Be Sampled . . . . . . . . . . . . . . . . . . . . . . . . . . . . . . . . . . . . . . . . . . 557-1. Systematic Designs for Sampling in Space . . . . . . . . . . . . . . . . . . . . . . . . . . . . . . . . . . . . . . 637-2. Choosing a Systematic Sample of n 4 Units from a Finite Population of N 15 Units . . . . 647-3. Locating a Square Grid Systematic Sample . . . . . . . . . . . . . . . . . . . . . . . . . . . . . . . . . . . . . 707-4. Map of an Area to Be Sampled Using a Triangular Sampling Grid . . . . . . . . . . . . . . . . . . . . 728-1. Using Ranked Set Sampling to Select Three Locations . . . . . . . . . . . . . . . . . . . . . . . . . . . . 799-1. Population Grid with Initial and Follow-up Samples and Areas of Interest . . . . . . . . . . . . . 1079-2. Follow-up Sampling Pattern . . . . . . . . . . . . . . . . . . . . . . . . . . . . . . . . . . . . . . . . . . . . . . . 1089-3. Comparison of Initial Sample with Final Sample . . . . . . . . . . . . . . . . . . . . . . . . . . . . . . . . 1089-4. Illustration of an Ideal Situation for Adaptive Cluster Sampling . . . . . . . . . . . . . . . . . . . . . . 10910-1. Equal Volume, Equal Allocation Compositing . . . . . . . . . . . . . . . . . . . . . . . . . . . . . . . . . . 11911-1. Illustration of Retesting Schemes for Classifying Units When 3 of 32Units are Positive . . . . . . . . . . . . . . . . . . . . . . . . . . . . . . . . . . . . . . . . . . . . . . . . . . . . . . . 152EPA QA/G-5SviiFinalDecember 2002
4.10-5.11-1.11-2.11-3.11-4.PagePotential Benefits for Users . . . . . . . . . . . . . . . . . . . . . . . . . . . . . . . . . . . . . . . . . . . . . . . . . . 3Probability-based versus Judgmental Sampling Designs . . . . . . . . . . . . . . . . . . . . . . . . . . . . 10Sampling Designs Presented in this Guidance . . . . . . . . . . . . . . . . . . . . . . . . . . . . . . . . . . . 12Choosing the Appropriate Sampling Design for Your Problem . . . . . . . . . . . . . . . . . . . . . . . 24Sample Size Needed for One-Sample t-test . . . . . . . . . . . . . . . . . . . . . . . . . . . . . . . . . . . . 44Sample Size Needed for a One-Sample Test for a Population Proportion, P,at a 5% Significance Level . . . . . . . . . . . . . . . . . . . . . . . . . . . . . . . . . . . . . . . . . . . . . . . . . 45Sample Size Needed for a One-Sample Test for a Population Proportion, P,at a 10% Significance Level . . . . . . . . . . . . . . . . . . . . . . . . . . . . . . . . . . . . . . . . . . . . . . . . 46Sample Size Needed for a Two-Sample t-Test . . . . . . . . . . . . . . . . . . . . . . . . . . . . . . . . . . 47Sample Size Needed for a Two-Sample Test for Proportionsat a 5% Significance Level . . . . . . . . . . . . . . . . . . . . . . . . . . . . . . . . . . . . . . . . . . . . . . . . . 48Sample Size Needed for a Two-Sample Test for Proportionsat a 10% Significance Level . . . . . . . . . . . . . . . . . . . . . . . . . . . . . . . . . . . . . . . . . . . . . . . . 49Summary Statistics for Simple and Stratified Random Samples . . . . . . . . . . . . . . . . . . . . . . 56Number of Samples Needed to Produce Various Levels of Precision for the Mean . . . . . . . 56Comparing the Number of Samples for Laboratory Analysis Using Ranked Set Sampling . . 81The Approximate Cost Ratio for Estimating the Mean . . . . . . . . . . . . . . . . . . . . . . . . . . . . . 88Approximate Cost Ratio for Estimating the Mean when On-site MeasurementsAre Used to Rank Field Locations . . . . . . . . . . . . . . . . . . . . . . . . . . . . . . . . . . . . . . . . . . . 89Relative Precision (RP) of Balanced Ranked Set Sampling to Simple RandomSampling for Lognormal Distributions . . . . . . . . . . . . . . . . . . . . . . . . . . . . . . . . . . . . . . . . . 92Optimal Values of t for Determining the Number of Samples for LaboratoryAnalysis Needed for an Unbalanced Ranked Set Sampling Design . . . . . . . . . . . . . . . . . . . 97Correction Factors for Obtaining Relative Precision Values . . . . . . . . . . . . . . . . . . . . . . . . . 98Comparison of Designs . . . . . . . . . . . . . . . . . . . . . . . . . . . . . . . . . . . . . . . . . . . . . . . . . . 105When to Use Composite Sampling — Four Fundamental Cases . . . . . . . . . . . . . . . . . . . . 121Criteria for Judging Benefits of Composite Sampling . . . . . . . . . . . . . . . . . . . . . . . . . . . . . 123Optimal k Values for Estimating a Population Mean . . . . . . . . . . . . . . . . . . . . . . . . . . . . . 129Optimal k for Estimating p and Approximate Confidence Intervals for p . . . . . . . . . . . . . . . 137Components of Cost and Variance for Random Samples - With and WithoutComposite Sampling . . . . . . . . . . . . . . . . . . . . . . . . . . . . . . . . . . . . . . . . . . . . . . . . . . . . 139Identification of Composite Sampling and Retesting Schemes for ClassifyingUnits Having a Rare Trait . . . . . . . . . . . . . . . . . . . . . . . . . . . . . . . . . . . . . . . . . . . . . . . . . 147Optimal Number of Samples per Composite for Exhaustive Retesting . . . . . . . . . . . . . . . . 148Optimal Number of Samples per Composite for Sequential Retesting . . . . . . . . . . . . . . . . 149Optimal Values of k for Binary Split Retesting . . . . . . . . . . . . . . . . . . . . . . . . . . . . . . . . . . 150EPA QA/G-5SviiiFinalDecember 2002
BOXES1-1.10-1.10-2.10-3.10-4.11-1.PageQuestions that this Document Will Help to Address . . . . . . . . . . . . . . . . . . . . . . . . . . . . . . . . 2Example of Benefits of Composite Sampling . . . . . . . . . . . . . . . . . . . . . . . . . . . . . . . . . . . 126Directions for Selecting Equal Allocation, Equal Volume Composite Samples forEstimating a Mean . . . . . . . . . . . . . . . . . . . . . . . . . . . . . . . . . . . . . . . . . . . . . . . . . . . . . . 128Example: Compositing for Estimating a Site Mean . . . . . . . . . . . . . . . . . . . . . . . . . . . . . . 131Directions for Composite Sampling for Estimating the Proportion of a Populationwith a Given Trait . . . . . . . . . . . . . . . . . . . . . . . . . . . . . . . . . . . . . . . . . . . . . . . . . . . . . . . 136Generic Algorithm for use with the Various Schemes . . . . . . . . . . . . . . . . . . . . . . . . . . . . . 146EPA QA/G-5SixFinalDecember 2002
EPA QA/G-5SxFinalDecember 2002
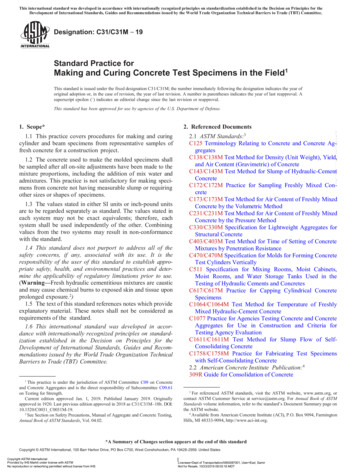
CHAPTER 1INTRODUCTIONThis document provides guidance on how to create sampling designs to collect environmentalmeasurement data. This guidance describes several relevant basic and innovative sampling designs, anddescribes the process for deciding which design is right for a particular application.1.1WHY IS SELECTING AN APPROPRIATE SAMPLING DESIGN IMPORTANT?The sampling design is a fundamental part of data collection for scientifically based decisionmaking. A well-developed sampling design plays a critical role in ensuring that data are sufficient todraw the conclusions needed.1 A sound, science-based decision is based on accurate information. Togenerating accurate information about the level of contamination in the environment, you shouldconsider the following:CCCCthe appropriateness and accuracy of the sample collection and handling method,the effect of measurement error,the quality and appropriateness of the laboratory analysis, andthe representativeness of the data with respect to the objective of the study.Of these issues, representativeness is addressed through the sampling design.Representativeness may be considered as the measure of the degree to which data accurately andprecisely represent a characteristic of a population, parameter variations at a sampling point, a processcondition, or an environmental condition [American National Standards Institute/American Society forQuality Control (ANSI/ASQC) 1994]. Developing a sampling design is a crucial step in collectingappropriate and defensible data that accurately represent the problem being investigated.For illustration, consider Figure 1-1, a site map for a dry lagoon formerly fed by a pipe.Assuming that good field and laboratory practices are exercised and adequate quality control isimplemented, the analytical results of soil samples drawn from randomly located sites A, B, and C maybe representative if the objective is to address whether the pipe has released a particular contaminant.However, these data are not representative if the objective is to estimate the average concentrationlevel of the entire old lagoon. For that estimation, random sampling locations should be generated from1Note: Sampling design is not the only important component. The methods used in sample handling and extractionare equally important to the quality of the data. The United States Environmental Protection Agency producesextensive guidance on sampling methods and field sampling techniques for different regulations, regions, andprograms that are not addressed in this document. In addition, measurement error affects the ability to drawconclusions from the data. Guidance on Data Quality Indicators (QA/G-5i) (EPA, 2001) contains information onthis issue.EPA QA/G-5S1FinalDecember 2002
the entire site of the old lagoon (for example, perhapsincluding samples at D, E, and F). If a samplingdesign results in the collection of nonrepresentativedata, even the highest quality laboratory analysiscannot compensate for the lack of representative data.The selection of the appropriate sampling design isnecessary in order to have data that are representativeof the problem being investigated.2Location of PipeEBAArea whereoutfall frompipe wasexpected toaccumulateCDFThis document provides technical guidance onOld Lagoon (now dry)specific sampling designs that can be used to improveFigure 1-1. Site Map for Old Lagoonthe quality of environmental data collected. Based instatistical theory, each chapter explains the benefits and drawbacks of each design and describesrelevant examples of environmental measurement applications. To choose a sampling design thatadequately addresses the estimation or decision at hand, it is important to understand what relevantfactors should be considered and how these factors affect the choice of an appropriate sampling design.1.2WHAT TYPES OF QUESTIONS WILL THIS GUIDANCE ADDRESS?Often it is difficult in practice to know how to answer questions regarding how many samples totake and where they should be taken. The development of a sampling design will answer thesequestions after considering relevant issues, such as variability. Box 1-1 outlines the questions that arerelevant to choosing a sampling design.Box 1-1. Questions that this Document Will Help to AddressWhat aspects of the problem should be considered for creating a sampling design?What are the types of designs that are commonly used in environmental sampling?What are some innovative designs that may improve the quality of the data?Which designs suit my problem?How should I design my sampling to provide the right information for my problem given alimited budget for sampling?How do I determine how much data are needed to make a good decision? 2Note: The problem of what constitutes “representativeness” is complex and further discussion may befound in Guidance on Data Quality Indicators Peer Review Draft (QA/G-5i) (EPA, 2001).EPA QA/G-5S2FinalDecember 2002
1.3WHO CAN BENEFIT FROM THIS DOCUMENT?This document will be useful to anyone planning data collection from any type of environmentalmedia including soil, sediment, dust, surface water, groundwater, air, vegetation, and sampling in indoorenvironments. The document contains information that will help those who are not extremely familiarwith statistical concepts as well as those who are more comfortable with statistics. To this end, varyingdegrees of detail are provided on the various sampling designs, which should be used according toability. The potential benefits for different types of users are shown in Table 1-1. This document ismeant to apply to all environmental media; examples in this document provides information oninnovative designs not discussed in earlier EPA documents.The guidance document is designed for users who are not necessarily well versed in statistics.The document
Final EPA QA/G-5S i December 2002 FOREWORD This document, Guidance for Choosing a Sampling Design for Environmental Data Collection (EPA QA/G-5S), will provide assistance in developing an effective QA Project Plan as described in Guidance for QA Project Plans (EPA QA/G-5) (EPA 1998b).QA Projec