Transcription
Bai et al. Journal of Animal Science and 482-x(2020) 11:84RESEARCHOpen AccessDiet induced the change of mtDNA copynumber and metabolism in Angus cattleYing Bai1,2, José A. Carrillo2,3, Yaokun Li2, Yanghua He2,4 and Jiuzhou Song2*AbstractBackground: Grass-fed and grain-fed Angus cattle differ in the diet regimes. However, the intricate mechanisms ofdifferent beef quality and other phenotypes induced by diet differences are still unclear. Diet affects mitochondrialfunction and dynamic behavior in response to changes in energy demand and supply. In this study, we examinedthe mtDNA copy number, mitochondria-related genes expression, and metabolic biomarkers in grass-fed and grainfed Angus cattle.Results: We found that the grass-fed group had a higher mtDNA copy number than the grain-fed group. Amongdifferent tissues, the mtDNA copy number was the highest in the liver than muscle, rumen, and spleen. Based onthe transcriptome of the four tissues, a lower expression of mtDNA-encoded genes in the grass-fed groupcompared to the grain-fed group was discovered. For the mitochondria-related nuclear genes, however, most ofthem were significantly down-regulated in the muscle of the grass-fed group and up-regulated in the other threetissues. In which, COX6A2, POLG2, PPIF, DCN, and NDUFA12, involving in ATP synthesis, mitochondrial replication,transcription, and maintenance, might contribute to the alterations of mtDNA copy number and gene expression.Meanwhile, 40 and 23 metabolic biomarkers were identified in the blood and muscle of the grain-fed groupcompared to a grass-fed group, respectively. Integrated analysis of the altered metabolites and gene expressionrevealed the high expression level of MDH1 in the grain-fed group might contribute to the mitochondrial NADHoxidation and spermidine metabolism for adapting the deletion mtDNA copy number.Conclusions: Overall, the study may provide further deep insight into the adaptive and regulatory modulationsof the mitochondrial function in response to different feeding systems in Angus cattle.Keywords: Beef quality, Different diet, Gene expression, Metabolism, MtDNABackgroundRecently, grass-fed beef production is booming in theUnited States, which is considered more beneficial forhuman health [1]. The main difference between grassfed and grain-fed beef cattle is attributable to the diet regimes. As we know, mitochondria play an essential rolein the cellular response to environmental stressors, suchas air, water, temperature, and food [2]. Mitochondriaare dynamic organelles that are present in almost* Correspondence: songj88@umd.edu2Department of Animal & Avian Sciences, University of Maryland, CollegePark, MD 20742, USAFull list of author information is available at the end of the articleeukaryotic cells and play a crucial role in several cellularpathways, producing most of the cellular ATP employingoxidative phosphorylation (OXPHOS). Different tissueshave specialized mitochondrial features due to differences in their metabolic profiles and energy demands[3–6]. The difference is not only restricted to theOXPHOS function [6] and mitochondria protein compositions [7] but also gene expressions, mitochondrialDNA maintenance, and replications [8, 9].Mitochondria contain their genomes (mtDNA), encoding a total of 13 proteins, together with 22 tRNAs and tworRNAs, necessary for translations of the respiratory subunit mRNAs within the mitochondrial matrix. Alterations The Author(s). 2020, corrected publication 2020. Open Access This article is licensed under a Creative Commons Attribution4.0 International License, which permits use, sharing, adaptation, distribution and reproduction in any medium or format, aslong as you give appropriate credit to the original author(s) and the source, provide a link to the Creative Commons licence,and indicate if changes were made. The images or other third party material in this article are included in the article's CreativeCommons licence, unless indicated otherwise in a credit line to the material. If material is not included in the article's CreativeCommons licence and your intended use is not permitted by statutory regulation or exceeds the permitted use, you will needto obtain permission directly from the copyright holder. To view a copy of this licence, visit http://creativecommons.org/licenses/by/4.0/. The Creative Commons Public Domain Dedication waiver ) applies to the data made available in this article, unless otherwise stated in a credit line to the data.
Bai et al. Journal of Animal Science and Biotechnology(2020) 11:84of mtDNA mean inactivating genetic mutations or depletion of mtDNA copy numbers [10]. The copies of mtDNAserve as the initial template for mtDNA replication andmaintenance, allowing cells to acquire the appropriatenumbers of mtDNA copy as they differentiate into maturecell types [11–13]. Mitochondria replication, maintenanceas well as gene expression are controlled by nuclearencoded factors, such as nuclear respiratory factor 1 and 2(NRF-1, NRF-2), mitochondrial transcription factor A(TFAM), and peroxisome proliferator-activated receptorgamma coactivator-1a (PGC-1a) [14, 15]. The mitochondrial and nuclear genomes coordinate and co-evolve ineukaryotes to adapt to environmental changes. Variationin the mitochondrial genome is capable of affecting theexpression of genes on the nuclear genome [16]. However,how the diet regime influences the mitochondria dynamics, further associated with beef quality, has yet to know.Provisioning of dietary macronutrients to mitochondria is influenced by genetic variations that affect theactivities of the electron transport system, retrograde organelle signaling to the nuclear genome, and anterogradesignaling to the mitochondrion [17, 18]. In diet-inducedobesity, impaired mitochondrial function and decreasedmitochondria contents were found in liver and skeletalmuscle [19, 20]. Dietary supplementation with plasminogen increased mitochondrial copy number and improvedmitochondrial function in mice [19–21]. A reduction ofthe mtDNA copy number and the expression of genesinvolved in mitochondrial biogenesis in the liver of ratsfed a high-fructose diet [22]. When feeding flies with ahigh carbohydrate diet, the mitochondria-related geneexpression, and mtDNA were changed [23]. RNA-seqanalysis revealed that genes associated with mitochondrial function were differentially expressed between lowprotein fed heifers on high- or low- energy diets [24].Meanwhile, diet by mitochondrial DNA haplotype interactions drives metabolic flexibility and organismal fitness [23]. Metabolomic profiling provides an additionallayer of knowledge for the complete representation ofthe phenotype of the animal, revealing the combinedcontributions of gene expression, enzyme activity, andenvironmental context [23, 25]. What a cow eats canhave a significant effect on the metabolic and nutrientcomposition of the beef via modulating metabolism andenergy expenditure [1]. Grass-fed beef may contain lesstotal fat than grain-fed beef, but a lot more omega-3fatty acids and conjugated linoleic acid [26–28]. In ourprevious studies, the alterations in divergences in freefatty acids, lipid levels, and gene expression patternshave been observed between grass-fed and grain-fedAngus cattle [29–31]. However, information on the possible mechanism on mitochondrial function and metabolism between the grass-fed and grain-fed is lacking.Here, we propose using trio measurements of mtDNAPage 2 of 13copy number, mRNA transcribed from mtDNA, andmRNA transcribed from nuclear DNA- related to mitochondria, to explore mitochondrial roles responded todifferent diets in Angus cattle. In parallel, we combinedthese data with metabolomics to assess the correlationbetween mitochondria-related genes and metaboliteslevels. These findings additionally provide insights intopatterns of transcriptional coordination between themitochondrial and nuclear genomes.MethodsAnimals and ethics statementThe grass-fed and grain-fed Angus cattle were raised atthe Wye Angus farm, which has been closed more than70 years, have similar genetics. The grain-fed group received a conventional diet comprised of shelled corn,corn silage, soybean, and trace minerals. The grass-fedsteers usually consumed grazed alfalfa. The diet composes, and feeding regiments for grass-fed and grain-fedcattle are described in Additional file 1: Table S1. Thelongissimus dorsi muscle, liver, spleen, and rumentissues were collected from steers with grass-fed andgrain-fed, respectively, when they reached the marketweight. The grain-fed animals reached the market weightaround the age of 14 months, while grass-fed steersneeded approximately 200 additional days to reach asimilar weight value. Samples were taken immediatelyafter euthanasia, frozen in liquid nitrogen, and stored at 80 C until used for extracting RNA and DNA. Bloodcollection for both groups was performed before slaughtering. The metabolomics profiling analysis were performed in blood and muscle samples from eightindividuals of the grass-fed group and the grain-fedgroup, respectively. Then, the four tissues from two randomly selected individuals in each group were used fordeep sequencing. MtDNA copy number was detected in24 samples (4 tissues 3 individuals 2 groups).All animal experiments were conducted according tothe NIH guidelines for housing and care of laboratoryanimals and following the regulations of the Universityof Maryland at College Park (UMCP). The UMCP Institutional Animal Care and Use Committee (IACUC)reviewed and approved the protocols (permit number R08-62).mtDNA copy number analysisDNA was prepared, and mtDNA copy number analysiswas performed according to the previous report [32, 33].Briefly, total DNA was extracted from longissimus dorsimuscle, liver, spleen, and rumen tissues using WizardGenomic DNA Purification Kit (Promega, Madison, WI,USA), respectively. The DNA concentration was detectedusing Nanodrop-2000 spectrophotometer (Thermo FisherScientific Inc., Wilmington, DE) and adjusted to 50 ng/μL.
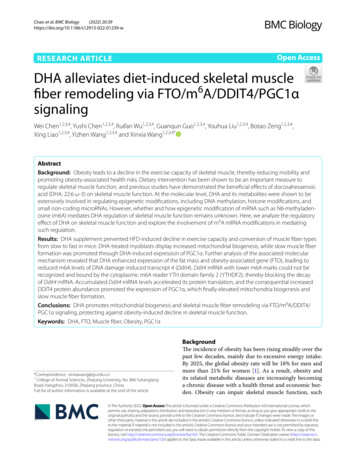
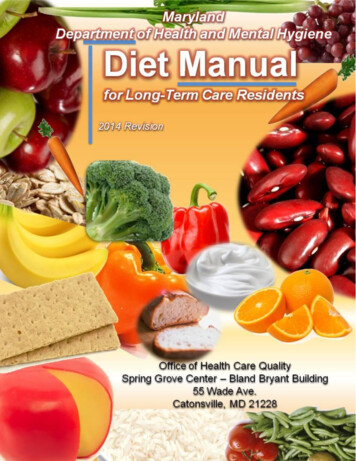
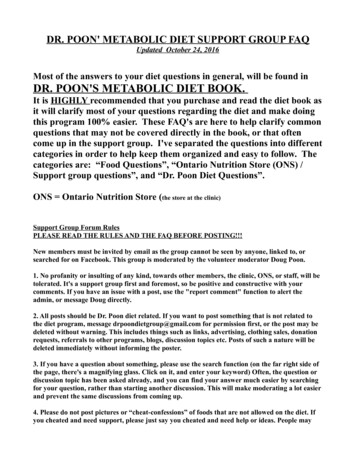
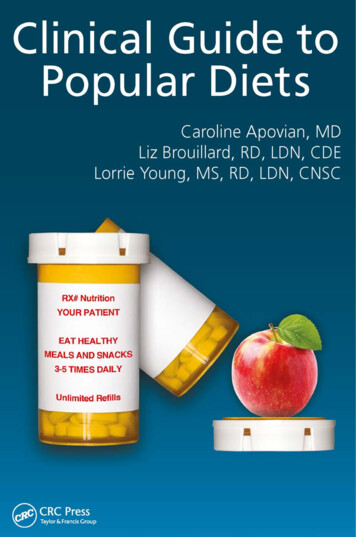
Bai et al. Journal of Animal Science and Biotechnology(2020) 11:84Primers were designed for four mitochondrial genes: theND2 (NADH dehydrogenase subunit 2), ND5 (NADH dehydrogenase subunit 5), CYTB (cytochrome B), 12sRNA,and COX3 (cytochrome oxidase subunit III). The ACTB(actin B) gene was used as a nuclear control gene. For theanalysis of mtDNA copy number, quantitative real-timePCR (qPCR) amplification of genomic DNA was performed on a C1000 Touch thermal cycler (BioRad,Hercules, CA, USA). The reactions for each gene wereperformed with 50 ng genomic DNA in triplicates in afinal volume of 10 μL using 300 nmol/L of the specificprimers and the 2 SYBR Green PCR mix (Biorad,Hercules, CA, USA). The PCR program was 95 C for 5min, 40 cycles of 95 C for 15 s, 60 C for the 30 s, and72 C for 30 s, with a melting curve analysis (65 C–95 C)in the last cycle to evaluate amplification specificity. Foreach run, a standard curve was generated from 10-foldserial dilutions (10 1 to 10 8). Relative mtDNA copynumbers were calculated following equation [34]: MtDNAcopy number 21 (Ctn gene-Ctmt gene), where Ct representsthe average cycle threshold. The mtDNA copy numberdata from the four tissues were analyzed separately.RNA sequencing and analysisThe RNA extraction, cDNA synthesis, library preparation, transcriptome sequencing, and raw data were carried out from our reported protocols [29–31]. Weemployed FastQC v.0.11.2 s/fastqc/) to check the sequencedata quality and Trim Galore v 0.4.0 s/trim galore/)toclean the data. The cleaned data were aligned to the reference genome downloaded from Ensembl (Bos taurus.ARS-UCD 1.2) using Hisat2 (https://ccb.jhu.edu/software/hisat2/) [35]. Differentially expressed geneswere computed by using Cuffdiff (cole-trapnell-lab.github.io/cufflinks/cuffdiff). A gene was considered to bedifferentially expressed when fold changes 2 and FDR 0.15. Gene Ontology (GO) enrichment analysis andKyoto Encyclopedia of Gene and Genomes (KEGG)pathway analysis were implemented with STRING tools(http://string-db.org/) and KOBAS 3.0 (http://kobas.cbi.pku.edu.cn/).Metabolomics profilingMetabolomics profiling analysis was performed by theMetabolon Platform, as previously described [29]. Thewhole blood and muscle tissues were assigned a uniqueidentifier by the Metabolon Laboratory Information Management System (LIMS). Samples were prepared using theautomated MicroLab STAR system from Hamilton Company. A recovery standard was added before the first stepin the extraction process for quality control (QC) purposes. Sample preparation was conducted using aqueousPage 3 of 13methanol extraction process to remove the protein fraction while allowing for maximum recovery of small molecules. The resulting extract was divided into fourfractions: one for analysis by liquid chromatography/massspectroscopy (LC/MS) (positive mode), one for LC/MS(negative mode), one for gas chromatography/mass spectroscopy (GC/MS), and one for backup. Samples wereplaced briefly on a TurboVap (Zymark) to remove the organic solvent. Each sample was then frozen and driedunder a vacuum. Samples were then prepared for the appropriate instrument. The progress of LC/MS, GC/MS,QA/QC, data extraction, and compound identificationwere detail described in our lab previous publication. TheMUVR package in R was used to find the metabolic biomarkers [36].Metabolomic enrichment and pathway characterizationThe pathway analysis was performed by MetaboAnalyst4.0 [37]. The common pathway databases in the MetaboAnalyst 4.0 were used to explore metabolic impactpathways. The pathway with a P-value less than 0.05, aswell as an impact value greater than 0.1, was defined as asignificant impact pathway. Degree Centrality was selectedfor the node importance, and the pathway impact valuecalculation in the topological analysis. The hypergeometricdistribution in the overrepresentation analysis was appliedto assess the significance of each pathway based on itsoverlap with pathway lists in the joint databases. Statisticalsignificance was defined at the joint P 0.05.ResultsMtDNA copy number variation in different tissuesMtDNA copy number, assayed with independent primersets, showed the difference in grass-fed and grain-fedgroups. Overall, grass-fed steers had higher mtDNAcopy number than grain-fed steers. Among tissues,mtDNA copy number was higher in the liver than theother three tissues, regardless of grass-fed and grain-fedones. The following was muscle. In regards to the ND2/ACTB primer set, diet significantly affected copy number. In liver and muscle, the mtDNA copy numbershowed significant differences between grass-fed andgrain-fed (P 0.05). But there was little influence on thecopy number in rumen and spleen. Copy number withregards to CYTB/ACTB, COX3/ACTB, or 12SRNA/ACTB showed a similar result (Fig. 1).The expression of mitochondria DNA-encoded genesTo identify whether the mitochondrial gene expressionwas altered in grass-fed and grain-fed cattle, the 13mtDNA-encoded genes were examined using RNA sequencing data (Fig. 2). In muscle, seven of the 13 genes,ND1, ND2, ND3, ND4, ND5, COX2, and CYTB, weresignificantly up-regulated in the grain-fed group
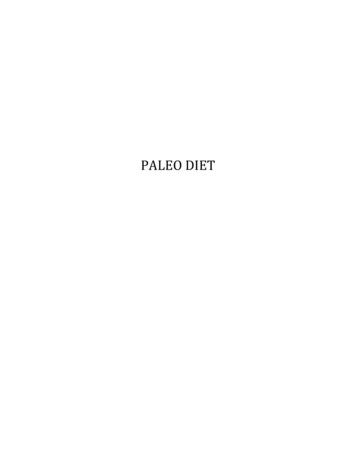
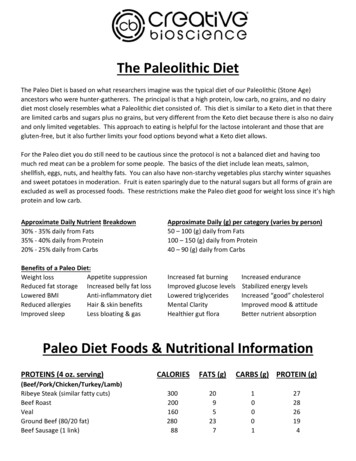
Bai et al. Journal of Animal Science and Biotechnology(2020) 11:84Page 4 of 13Fig. 1 The mtDNA copy number variation in different tissues between grass-fed and grain-fedcompared to the grass-fed group. In the liver, ND1,ND2, ND5, COX2, and CYTB had lower expressionlevels in the grass-fed group. In the spleen, only onemtDNA-encoded gene, ND3, was showed significantlylower in the grass-fed group. In the rumen, there was nomtDNA-encoded gene was significantly expressed between the two diets. Interestingly, in the four tissues, nodifferentially expressed mtDNA-encoded genes wereshown up-regulation in grass-fed Angus cattle.Differentially expressed mitochondria-related nucleargenesThe human mitochondria-related genes were downloaded from the MitoProteome Human MitochondrialProtein Database [38]. Gene names were directly compared with those in cattle using the BioMart datamining tool (http://useast.ensembl.org/biomart/martview). Meanwhile, the genes reported to be involved inmitochondrial function was generated by searching the“cattle mitochondrial” into the NCBI Gene database(National Center for Biotechnology Information, U.S.National Library of Medicine, Gene, http://www.ncbi.nlm.nih.gov/gene). Finally, 1283 genes were matched, including 13 mtDNA encoded protein genes as well as1270 mitochondria-related nuclear genes (Additional file1: Table S2).The expression levels of 1270 mitochondria-relatednuclear genes were also investigated based on the RNAsequencing data, and differentially expressed gene (DEG)analyses were performed between the two diets acrossdifferent tissues. The numbers of the differentiallyexpressed that mitochondria-related nuclear genes wereshown in Fig. 3 and Additional file 1: Table S3-S7.Compared to the grain-fed group, most of the DEGswere down-regulated in the muscle of the grass-fedgroup, but more DEGs were up-regulated in the otherthree tissues (Fig. 3a). In muscle, 15 mitochondriarelated nuclear genes were differentially expressed in adiet-dependent manner. CKMT2 (creatine kinase, mitochondrial 2), UBB (ubiquitin B), and MDH1 (malate dehydrogenase 1) were up-regulated in the grass-fedgroup, while other nine genes had the opposite expression pattern. In the liver, the effect of diet changeshowed that 27 mitochondria-related nuclear genes weredifferentially expressed, all of which were up-regulatedin the grass-fed group. Among the nine DEGs observedin spleen, seven genes were up-regulated, and two genes,LYRM7 (LYR motif containing 7) and CYP11A1
Bai et al. Journal of Animal Science and Biotechnology(2020) 11:84Page 5 of 13Fig. 2 Heat map showing relative expression of mtDNA encoded genes in the four tissues of grass-fed and grain-fed Angus cattle. The averagefragments per kilobase of transcript per million (FPKM) value of the two replicates was used as the gene expression, and the heat map wasplotted based on log2(FPKM 1). The color legend represents the appropriate level, with red indicating high expression level and the blueindicating low expression levelFig. 3 Differentially expressed mitochondria-related nuclear genes. a Number of up- or down-regulated DEGs in the four tissues. Up-regulatedand down-regulated genes were displayed in red and green, respectively. b Venn diagram showing the number of DEGs commonly expressed inthe four tissues
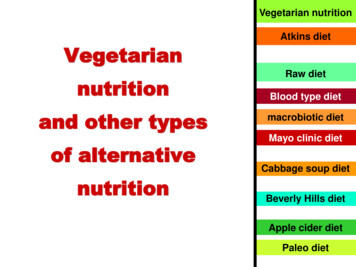
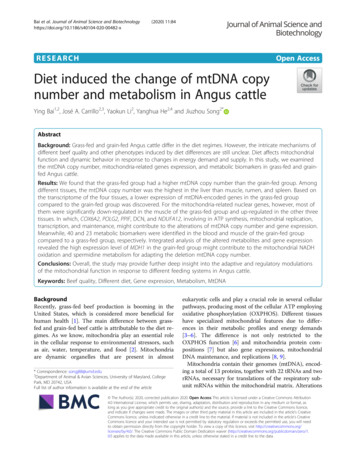
Bai et al. Journal of Animal Science and Biotechnology(2020) 11:84(cytochrome P450, family 11, subfamily A, polypeptide1), were down-regulated in the grass-fed group. In therumen, 15 mitochondria-related nuclear genes were differentially expressed (fold changes 2, FDR 0.15), ofwhich 11 genes were up-regulated, and four genes weredown-regulated in the grass-fed compared to the grainfed ones. There were no DEGs in common among thefour tissues of the two different diets. UBB was commonly differentially expressed in muscle and liver. Whilethere were two DEGs, DHCR24 (24-dehydrocholesterolreductase) and SHMT1 (serine hydroxymethyltransferase1), commonly expressed in liver and rumen (Fig. 3b).Bioinformatics functions analysisTo further define the potential biological function of differentially expressed mitochondrial-related genes, including mtDNA encoded protein genes, as well asmitochondria-related nuclear genes, GO analysis andKEGG pathway analysis were performed. The enrichedGO terms of biological processes, molecular functionsand cellular components were shown in Table 1 andAdditional file 1: Table S8 (FDR 0.05). For the KEGGpathway analysis, most of the differentially expressedpathways (P 0.05) were associated with metabolic pathways in the four tissues (Additional file 2: Fig. S1). Inmuscle, the metabolic pathways included carbon metabolism, glyoxylate and dicarboxylate metabolism, and butanoate metabolism. In liver, the metabolism wereinvolved in pyruvate metabolism, amino acid metabolism, glyoxylate, and dicarboxylate metabolism, carbonmetabolism, and glycerolipid metabolism. Meanwhile,The FoxO signaling pathway was also differentiallyexpressed, which was associated with development.Prediction potential metabolic biomarkers and significantimpact metabolic pathwaysLC/MS and GC/MS data detected 326 and 353 compounds in blood and muscle [29] (Additional file 3).Then, the compounds were analyzed using MUVR package in R to find themetabolic biomarkers. There were 40and 23 metabolic biomarkers were identified in bloodand muscle of the grain-fed group compared to a grassfed group, respectively (Fig. 4). The involved metabolitesbelonged to the amino acid, carbohydrate, cofactors andvitamins, lipid, nucleotide, peptide, and xenobiotics. Forthe 40 metabolic biomarkers in blood, 14 metaboliteshad higher relative abundance in blood of the grain-fedgroup than the grass-fed group (P 0.01). Another 26metabolites significantly decreased in the grain-fedgroup. In muscle, 14 metabolic biomarkers were increased in a grain-fed group compared to the grass-fedgroup, and the other nine were decreased (P 0.01).Among these metabolites, four lipids (1-eicosapentaenoyl glycerophosphoethanolamine, 2-eicosapentaenoylPage 6 of 13glycerophosphoethanolamine, 1-linolenoyl glycerophosphocholine (18:3n-3), and 3-dehydrocarnitine), oneamino acid (N-methyl proline), and one xenobiotic(homostachydrine) were proposed as conventional metabolic biomarkers for the two tissues, which had sameabundance trend between the two different diet groups.Impact pathway analysis revealed that eight pathwayswere significant impact pathways based on the 23 metabolic biomarkers in muscle (Fig. 5a): glycerophospholipidmetabolism (P 0.0018, impact value 0.6), arginine andproline metabolism (P 0.0021, impact value 0.2162),alpha-linolenic acid metabolism (P 0.0036, impactvalue 0.25), purine metabolism (P 0.0102, impactvalue 0.1077), glutathione metabolism (P 0.0164, impact value 0.2222), linoleic acid metabolism (P 0.0359,impact value 0.25), D-glutamine and D-glutamate metabolism (P 0.0359, impact value 0.5), nitrogen metabolism (P 0.0429, impact value 0.2). Meanwhile, therewere four significant impact pathways based the 40 metabolic biomarkers in blood (Fig. 5b): neomycin, kanamycinand gentamicin biosynthesis (P 0.0171, impact value 1), glycine, serine and threonine metabolism (P 0.0328,impact value 0.1515), glycerophospholipid metabolism(P 0.0364, impact value 0.4857), linoleic acid metabolism (P 0.0423, impact value 0.25).Integrated analysis of metabolites and mitochondrialrelated genesThe over-representation analysis and pathway topologyanalysis were conducted between the diet-differentmetabolic biomarkers and differentially expressedmitochondrial-related genes in the muscle of grass-fedand grain-fed groups (analysis I). The nutrients digestedin the rumen are absorbed by the rumen epithelial walland are then transported to the mammary to the liverfor glycogenesis, followed by transportation to other tissues through the bloodstream [39, 40]. Therefore, we integrated the differentially expressed mitochondriarelated nuclear genes in the liver and rumen together toascertain the metabolic biomarkers in the blood, and didthe over-representation analysis and pathway topologyanalysis (analysis II). Topology analysis uses the structure of a given pathway to evaluate the relative importance of the genes/metabolites based on their relativelocations. In the analysis I, 27 pathways were identified,and 20 of them were displayed in Fig. 6a. In analysis II,46 pathways were identified, the top 20 of which wereshown in Fig. 6b. Six and nine pathways were significantly enriched in the analysis I and analysis II, receptively. They include Arginine and proline, glyoxylate anddicarboxylate, alpha-Linolenic acid, butanoate, glycerophospholipid, and beta-Alanine metabolisms. Othermetabolisms also include pyruvate, glycine, serine andthreonine,lysinedegradation,glyoxylateand
Bai et al. Journal of Animal Science and Biotechnology(2020) 11:84Table 1 Top five gene ontology terms in the four tissuesTissueGO termsFDRGO termsFDRMolecular FunctionCellular respiration1.51E-11Oxidation-reduction process4.18E-11Oxidoreductase activityATP synthesis coupled electron transport8.73E-10NADH dehydrogenase (ubiquinone) activity0.003Nucleobase-containing small moleculemetabolic process5.99E-09Catalytic activity0.014ATP metabolic process5.28E-080.0014Rumen Biological ProcessCellular ComponentPositive regulation of mitochondrion organization0.0356Cellular metabolic process0.0356Mitochondrion8.58E-14Organonitrogen compound metabolic process0.0356Mitochondrial respiratory6.93E-13Cellular modified amino acid metabolic process0.0419Respiratory chain complex6.93E-13Phosphorylation0.0419An inner mitochondrial membrane protein complex 4.88E-12Mitochondrial part1.80E-11Molecular FunctionCellular ComponentMitochondrial part0.00044Mitochondrial envelope0.0016Oxidoreductase activity2.07E-12Cytoplasm0.0028NADH dehydrogenase (ubiquinone) activity6.48E-09Mitochondrial membrane0.0098Catalytic activity6.57E-09Cytoplasmic part0.0126Electron transfer activity0.00029Molecular FunctionCytochrome-c oxidase activity0.0025Drug bindingBiological Process0.00042Kinase activity0.0046Oxidation-reduction process3.08E-17Catalytic activity0.0076Small-molecule metabolic process1.32E-13Transferase activity0.0076Metabolic process9.41E-11Carbohydrate derivative binding0.0076Cellular metabolic process9.41E-11Cellular process1.04E-08Cellular ComponentMitochondrion8.72E-21Mitochondrial part6.00E-19Cytoplasmic part1.95E-13Cytoplasm4.00E-13Mitochondrial membrane1.82E-11Molecular FunctionSpleenTable 1 Top five gene ontology terms in the four tissues(Continued)TissueMuscle Biological ProcessLiverPage 7 of 13Oxidoreductase activity4.54E-16Catalytic activity1.61E-12Cofactor binding2.96E-06Aldehyde dehydrogenase (NAD) activity2.75E-05Coenzyme binding5.48E-05Biological ProcessOxidation-reduction process0.0117Cellular ComponentMitochondrial part7.57E-10Mitochondrial membrane6.12E-09Mitochondrial inner membrane4.01E-08Mitochondrial membrane part6.04E-08Inner mitochondrial membrane protein complex0.00012dicarboxylate, and tryptophan metabolisms. The genemetabolite interaction networks were also shown in Fig. 6.DiscussionMtDNA copy number variationAccording to the nutritional analysis of grass-diet andgrain-diet, the contents of non-fiber carbohydratesand starch were much higher in the grain-diet, providing more total-digestible nutrients and availableenergy as well. Contrarily, proteins, lignin, fiber matter, and ash were more abundant in the grass- thangrain-diet (Additional file 1: Table S1). It has been reported that when the flies were fed a high proteindiet, the mtDNA copy number was increased compared to the high carbohydrate diet [23]. In our results, grass-fed steers had higher mtDNA copynumber than grain-fed steers, which might be thatthe administration of insulin and amino acids enhances mitochondrial biogenesis and ATP production[41]. Meanwhile, the mtDNA copy number was higher inthe liver than muscle, rumen, and spleen, regardless ofgrass- or grain-fed group. According to the ND2/ACTBprimer set, the mtDNA copy number was 3.96-fold higher
Bai et al. Journal of Animal Science and Biotechnology(2020) 11:84Page 8 of 13Fig. 4 Potential metabolic biomarkers and metabolic pathways in blood and muscle of grain-fed group compared to the grass-fed group. B, Blood; M,Muscle; Color highlighting indicates the common six metabolites in the two tissuesin the liver of the grass-fed group than the grain-fed groupand was 2.46-fold higher in the muscle, which might bedue to the different mechanism of mtDNA replication andmaintenance in different tissues [9, 42]. The liver and kidney cells replicate their mtDNA using the asynchronousmechanism, skeletal muscle and brown fat with highOXPHOS activity employ a strand-coupled replicationmode, combined with increased levels of recombination [9].The expression of mitochondria-related genesBy RNA-seq profiling, 13 mtDNA-encoded genes werediet-dependent and could be differently regulated at thelevel of transcription. Concerning differential expression,most of the genes encoding subunits of complex I (ND1,ND2, ND3, ND4, ND5), complex III (CYTB) and complex IV (COX2) were down-regulated in the grass-fedgroup, suggesting that the high protein diet might have
Bai et al. Journal of Animal Science and Biotechnology(2020) 11:84Page 9 of 13Fig. 5 The pathway impact view of the metabolic biomarkers identified in muscle and blood tissue from the grass-fed and grain-fed group, respectively. athe pathway impact view of the metabolic biomarkers identified in muscle. b the pathway impact view of the metabolic biomarkers identified in blood.The X- and Y-axes represent the pathway impact value and pathway enrichment value, respectively; larger sizes and darker colors represent higherpathway enrichment and impact valuesan adverse effect on the mtDNA-encoded genes [10].Mitochondrial Complexes I, III and IV are consideredthe energy-conserving core of the electron transportchain because they pump protons across the mitochondrial inner membrane, which is responsible for ATP production, and affecting mitochondrial function directly[43, 44]. Future studies should assay the ATP levels inthe different tissues of the grass-fed group and grain-fedgroup. However, the higher expression levels ofmtDNA-encoded genes were along with lower mtDNAcopy number, implicating that compensation for differentially expressed mtDNA-encoded genes resulting fromt
number and metabolism in Angus cattle Ying Bai1,2, José A. Carrillo2,3, Yaokun Li2, Yanghua He2,4 and Jiuzhou Song2* Abstract Background: Grass-fed and grain-fed Angus cattle differ in the diet regimes. However, the intricate mechanisms of different beef quality and other phenotypes induced by diet differences are still unclear.