Transcription
Session 8SAMPLING THEORYSTATISTICSSAMPLING THEORYSTATISTICS
STATISTICS ANALYTIC Sampling TheoryA probability sampling method is any method of sampling that utilizes some form of randomselection. In order to have a random selection method, you must set up some process orprocedure that assures that the different units in your population have equal probabilities of beingchosen. Humans have long practiced various forms of random selection, such as picking a nameout of a hat, or choosing the short straw. These days, we tend to use computers as the mechanismfor generating random numbers as the basis for random selection.An Introduction to Sampling TheoryThe applet that comes with this WWW page is an interactive demonstration that willshow the basics of sampling theory. Please read ahead to understand more about whatthis program does. For more information on the use of this applet see the bottom ofthis page.A Quick Primer on Sampling TheoryThe signals we use in the real world, such as our voices, are called "analog"signals. To process these signals in computers, we need to convert the signals to"digital" form. While an analog signal is continuous in both time and amplitude, adigital signal is discrete in both time and amplitude. To convert a signal fromcontinuous time to discrete time, a process called sampling is used. The value of thesignal is measured at certain intervals in time. Each measurement is referred to as asample. (The analog signal is also quantized in amplitude, but that process is ignoredin this demonstration. See the Analog to Digital Conversion page for more on that.)
When the continuous analog signal is sampled at a frequency F, the resulting discretesignal has more frequency components than did the analog signal. To be precise, thefrequency components of the analog signal are repeated at the sample rate. That is, inthe discrete frequency response they are seen at their original position, and are alsoseen centered around /- F, and around /- 2F, etc.How many samples are necessary to ensure we are preserving the informationcontained in the signal? If the signal contains high frequency components, we willneed to sample at a higher rate to avoid losing information that is in the signal. Ingeneral, to preserve the full information in the signal, it is necessary to sample attwice the maximum frequency of the signal. This is known as the Nyquist rate. TheSampling Theorem states that a signal can be exactly reproduced if it is sampled at afrequency F, where F is greater than twice the maximum frequency in the signal.What happens if we sample the signal at a frequency that is lower that the Nyquistrate? When the signal is converted back into a continuous time signal, it will exhibit aphenomenon called aliasing. Aliasing is the presence of unwanted components in thereconstructed signal. These components were not present when the original signalwas sampled. In addition, some of the frequencies in the original signal may be lost inthe reconstructed signal. Aliasing occurs because signal frequencies can overlap if thesampling frequency is too low. Frequencies "fold" around half the samplingfrequency - which is why this frequency is often referred to as the folding frequency.Sometimes the highest frequency components of a signal are simply noise, or do notcontain useful information. To prevent aliasing of these frequencies, we can filter outthese components before sampling the signal. Because we are filtering out highfrequency components and letting lower frequency components through, this is knownas low-pass filtering.Demonstration of SamplingThe original signal in the applet below is composed of three sinusoid functions, eachwith a different frequency and amplitude. The example here has the frequencies 28Hz, 84 Hz, and 140 Hz. Use the filtering control to filter out the higher frequencycomponents. This filter is an ideal low-pass filter, meaning that it exactly preservesany frequencies below the cutoff frequency and completely attenuates any frequenciesabove the cutoff frequency.Notice that if you leave all the components in the original signal and select a lowsampling frequency, aliasing will occur. This aliasing will result in the reconstructed
signal not matching the original signal. However, you can try to limit the amount ofaliasing by filtering out the higher frequencies in the signal. Also important to note isthat once you are sampling at a rate above the Nyquist rate, further increases in thesampling frequency do not improve the quality of the reconstructed signal. This istrue because of the ideal low-pass filter. In real-world applications, sampling athigher frequencies results in better reconstructed signals. However, higher samplingfrequencies require faster converters and more storage. Therefore, engineers mustweigh the advantages and disadvantages in each application, and be aware of thetradeoffs involved.The importance of frequency domain plots in signal analysis cannot beunderstated. The three plots on the right side of the demonstration are all Fouriertransform plots. It is easy to see the effects of changing the sampling frequency bylooking at these transform plots. As the sampling frequency decreases, the signalseparation also decreases. When the sampling frequency drops below the Nyquistrate, the frequencies will crossover and cause aliasing.Experiment with the following applet in order to understand the effects of samplingand filtering.Hypothesis testingThe basic idea of statistics is simple: you want to extrapolate from the data you have collected tomake general conclusions. Population can be e.g. all the voters and sample the voters youpolled. Population is characterized by parameters and sample is characterized by statistics. Foreach parameter we can find appropriate statistics. This is called estimation. Parameters arealways fixed, statistics vary from sample to sample.Statistical hypothesis is a statement about population. In case of parametric tests it is astatement about population parameter. The only way to decide whether this statement is 100%truth or false is to research whole population. Such a research is ineffective and sometimesimpossible to perform. This is the reason why we research only the sample instead of thepopulation. Process of the verification of the hypothesis based on samples is called hypothesistesting. The objective of testing is to decide whether observed difference in sample is only due tochance or statistically significant.Steps in Hypothesis testing:1) Defining a null hypothesisThe null hypothesis is usually an hypothesis of "no difference"
2) Defining alternative hypothesisAlternative hypothesis is usually hypothesis of significant (not due to chance) difference3) Choosing alpha (significance level)Conventionally the 5% (less than 1 in 20 chance of being wrong) level has been used.4) Do the appropriate statistical test to compute the P value.A P value is the largest value of alpha that would result in the rejection of the null hypothesis fora particular set of data.5) DecisionCompare calculated P-value with prechosen alpha.If P value is less than the chosen significance level then you reject the null hypothesis i.e. acceptthat your sample gives reasonable evidence to support the alternative hypothesis.If the P value is greater than the threshold, state that you "do not reject the null hypothesis" andthat the difference is "not statistically significant". You cannot conclude that the null hypothesisis true. All you can do is conclude that you don't have sufficient evidence to reject the nullhypothesis.Possible outcomes in hypothesis testing:DecisionH0 rejectedTruth H0 not rejectedH0 is true Correct decision (p 1-α) Type I error (p α)H0 is false Type II error (p β)Correct decision (p 1-β)H0: Null hypothesisp: Probabilityα: Significance level1-α: Confidence level1-β: PowerInferring parameters for models of biological processes are a current challenge in systems biology, as is therelated problem of comparing competing models that explain the data. In this work we apply Skilling's nestedsampling to address both of these problems. Nested sampling is a Bayesian method for exploring parameterspace that transforms a multi-dimensional integral to a 1D integration over likelihood space. This approachfocusses on the computation of the marginal likelihood or evidence. The ratio of evidences of different modelsleads to the Bayes factor, which can be used for model comparison. We demonstrate how nested sampling canbe used to reverse-engineer a system's behaviour whilst accounting for the uncertainty in the results. Theeffect of missing initial conditions of the variables as well as unknown parameters is investigated. We showhow the evidence and the model ranking can change as a function of the available data. Furthermore, theaddition of data from extra variables of the system can deliver more information for model comparison thanincreasing the data from one variable, thus providing a basis for experimental design
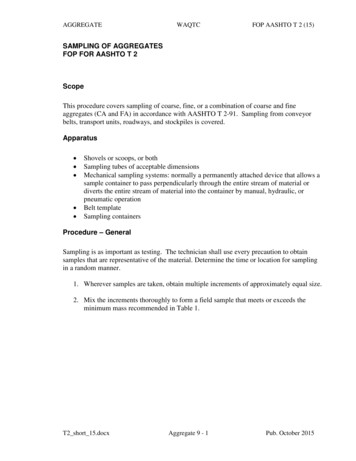
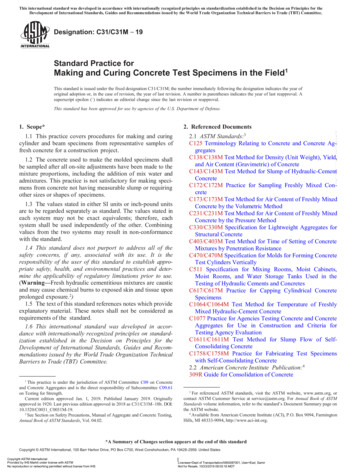
Some DefinitionsBefore I can explain the various probability methods we have to define some basic terms. Theseare: N the number of cases in the sampling framen the number of cases in the sampleNCn the number of combinations (subsets) of n from Nf n/N the sampling fractionThat's it. With those terms defined we can begin to define the different probability samplingmethods.Simple Random SamplingThe simplest form of random sampling is called simple random sampling. Pretty tricky, huh?Here's the quick description of simple random sampling: Objective: To select n units out of N such that each NCn has an equal chance of beingselected.Procedure: Use a table of random numbers, a computer random number generator, or amechanical device to select the sample.A somewhat stilted, if accurate,definition. Let's see if we canmake it a little more real. How dowe select a simple randomsample? Let's assume that we aredoing some research with a smallservice agency that wishes toassess client's views of quality ofservice over the past year. First,we have to get the sampling frame organized. To accomplish this, we'll go through agencyrecords to identify every client over the past 12 months. If we're lucky, the agency has goodaccurate computerized records and can quickly produce such a list. Then, we have to actuallydraw the sample. Decide on the number of clients you would like to have in the final sample. Forthe sake of the example, let's say you want to select 100 clients to survey and that there were1000 clients over the past 12 months. Then, the sampling fraction is f n/N 100/1000 .10 or10%. Now, to actually draw the sample, you have several options. You could print off the list of1000 clients, tear then into separate strips, put the strips in a hat, mix them up real good, closeyour eyes and pull out the first 100. But this mechanical procedure would be tedious and thequality of the sample would depend on how thoroughly you mixed them up and how randomlyyou reached in. Perhaps a better procedure would be to use the kind of ball machine that ispopular with many of the state lotteries. You would need three sets of balls numbered 0 to 9, oneset for each of the digits from 000 to 999 (if we select 000 we'll call that 1000). Number the list
of names from 1 to 1000 and then use the ball machine to select the three digits that selects eachperson. The obvious disadvantage here is that you need to get the ball machines. (Where do theymake those things, anyway? Is there a ball machine industry?).Neither of these mechanical procedures is very feasible and, with the development ofinexpensive computers there is a much easier way. Here's a simple procedure that's especiallyuseful if you have the names of the clients already on the computer. Many computer programscan generate a series of random numbers. Let's assume you can copy and paste the list of clientnames into a column in an EXCEL spreadsheet. Then, in the column right next to it paste thefunction RAND() which is EXCEL's way of putting a random number between 0 and 1 in thecells. Then, sort both columns -- the list of names and the random number -- by the randomnumbers. This rearranges the list in random order from the lowest to the highest random number.Then, all you have to do is take the first hundred names in this sorted list. pretty simple. Youcould probably accomplish the whole thing in under a minute.Simple random sampling is simple to accomplish and is easy to explain to others. Becausesimple random sampling is a fair way to select a sample, it is reasonable to generalize the resultsfrom the sample back to the population. Simple random sampling is not the most statisticallyefficient method of sampling and you may, just because of the luck of the draw, not get goodrepresentation of subgroups in a population. To deal with these issues, we have to turn to othersampling methods.Stratified Random SamplingStratified Random Sampling, also sometimes called proportional or quota random sampling,involves dividing your population into homogeneous subgroups and then taking a simple randomsample in each subgroup. In more formal terms:Objective: Divide the population into non-overlapping groups (i.e., strata) N1, N2, N3, . Ni,such that N1 N2 N3 . Ni N. Then do a simple random sample of f n/N in each strata.There are several major reasons why you might prefer stratified sampling over simple randomsampling. First, it assures that you will be able to represent not only the overall population, butalso key subgroups of the population, especially small minority groups. If you want to be able totalk about subgroups, this may be the only way to effectively assure you'll be able to. If thesubgroup is extremely small, you can use different sampling fractions (f) within the differentstrata to randomly over-sample the small group (although you'll then have to weight the withingroup estimates using the sampling fraction whenever you want overall population estimates).When we use the same sampling fraction within strata we are conducting proportionate stratifiedrandom sampling. When we use different sampling fractions in the strata, we call thisdisproportionate stratified random sampling. Second, stratified random sampling will generallyhave more statistical precision than simple random sampling. This will only be true if the strataor groups are homogeneous. If they are, we expect that the variability within-groups is lowerthan the variability for the population as a whole. Stratified sampling capitalizes on that fact.
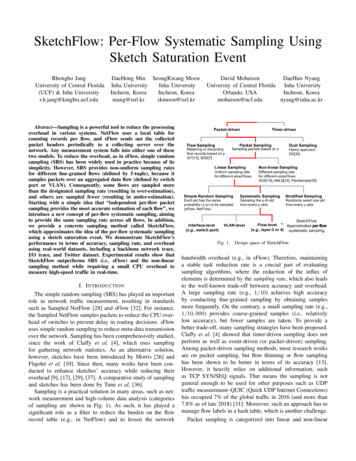
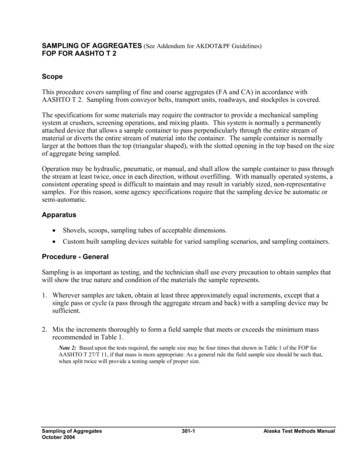
For example, let'ssay that thepopulation ofclients for ouragency can bedivided into threegroups: Caucasian,African-Americanand HispanicAmerican.Furthermore, let'sassume that boththe AfricanAmericans andHispanicAmericans arerelatively smallminorities of the clientele (10% and 5% respectively). If we just did a simple random sample ofn 100 with a sampling fraction of 10%, we would expect by chance alone that we would onlyget 10 and 5 persons from each of our two smaller groups. And, by chance, we could get fewerthan that! If we stratify, we can do better. First, let's determine how many people we want tohave in each group. Let's say we still want to take a sample of 100 from the population of 1000clients over the past year. But we think that in order to say anything about subgroups we willneed at least 25 cases in each group. So, let's sample 50 Caucasians, 25 African-Americans, and25 Hispanic-Americans. We know that 10% of the population, or 100 clients, are AfricanAmerican. If we randomly sample 25 of these, we have a within-stratum sampling fraction of25/100 25%. Similarly, we know that 5% or 50 clients are Hispanic-American. So our withinstratum sampling fraction will be 25/50 50%. Finally, by subtraction we know that there are850 Caucasian clients. Our within-stratum sampling fraction for them is 50/850 about 5.88%.Because the groups are more homogeneous within-group than across the population as a whole,we can expect greater statistical precision (less variance). And, because we stratified, we knowwe will have enough cases from each group to make meaningful subgroup inferences.Systematic Random SamplingHere are the steps you need to follow in order to achieve a systematic random sample: number the units in the population from 1 to Ndecide on the n (sample size) that you want or needk N/n the interval sizerandomly select an integer between 1 to kthen take every kth unit
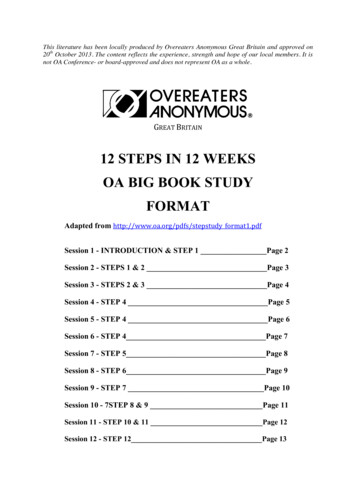
All of this will bemuch clearer withan example. Let'sassume that wehave a populationthat only hasN 100 people in itand that you wantto take a sample ofn 20. To usesystematicsampling, thepopulation must belisted in a randomorder. Thesampling fractionwould be f 20/100 20%. inthis case, theinterval size, k, isequal to N/n 100/20 5. Now, select a random integer from 1 to 5. In our example, imaginethat you chose 4. Now, to select the sample, start with the 4th unit in the list and take every k-thunit (every 5th, because k 5). You would be sampling units 4, 9, 14, 19, and so on to 100 andyou would wind up with 20 units in your sample.For this to work, it is essential that the units in the population are randomly ordered, at least withrespect to the characteristics you are measuring. Why would you ever want to use systematicrandom sampling? For one thing, it is fairly easy to do. You only have to select a single randomnumber to start things off. It may also be more precise than simple random sampling. Finally, insome situations there is simply no easier way to do random sampling. For instance, I once had todo a study that involved sampling from all the books in a library. Once selected, I would have togo to the shelf, locate the book, and record when it last circulated. I knew that I had a fairly goodsampling frame in the form of the shelf list (which is a card catalog where the entries arearranged in the order they occur on the shelf). To do a simple random sample, I could haveestimated the total number of books and generated random numbers to draw the sample; but howwould I find book #74,329 easily if that is the number I selected? I couldn't very well count thecards until I came to 74,329! Stratifying wouldn't solve that problem either. For instance, I couldhave stratified by card catalog drawer and drawn a simple random sample within each drawer.But I'd still be stuck counting cards. Instead, I did a systematic random sample. I estimated thenumber of books in the entire collection. Let's imagine it was 100,000. I decided that I wanted totake a sample of 1000 for a sampling fraction of 1000/100,000 1%. To get the samplinginterval k, I divided N/n 100,000/1000 100. Then I selected a random integer between 1 and100. Let's say I got 57. Next I did a little side study to determine how thick a thousand cards arein the card catalog (taking into account the varying ages of the cards). Let's say that on average Ifound that two cards that were separated by 100 cards were about .75 inches apart in the catalogdrawer. That information gave me everything I needed to draw the sample. I counted to the 57th
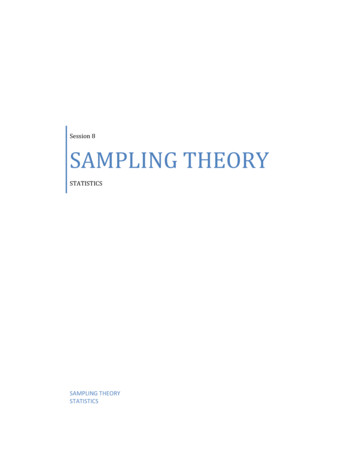
by hand and recorded the book information. Then, I took a compass. (Remember those from yourhigh-school math class? They're the funny little metal instruments with a sharp pin on one endand a pencil on the other that you used to draw circles in geometry class.) Then I set the compassat .75", stuck the pin end in at the 57th card and pointed with the pencil end to the next card(approximately 100 books away). In this way, I approximated selecting the 157th, 257th, 357th,and so on. I was able to accomplish the entire selection procedure in very little time using thissystematic random sampling approach. I'd probably still be there counting cards if I'd triedanother random sampling method. (Okay, so I have no life. I got compensated nicely, I don'tmind saying, for coming up with this scheme.)Cluster (Area) Random SamplingThe problem with random sampling methods when we have to sample a population that'sdisbursed across a wide geographic region is that you will have to cover a lot of groundgeographically in order to get to each of the units you sampled. Imagine taking a simple randomsample of all the residents of New York State in order to conduct personal interviews. By theluck of the draw you will wind up with respondents who come from all over the state. Yourinterviewers are going to have a lot of traveling to do. It is for precisely this problem that clusteror area random sampling was invented.In cluster sampling, we follow these steps: divide population into clusters (usually along geographic boundaries)randomly sample clustersmeasure allunitswithinsampledclustersFor instance, in thefigure we see amap of thecounties in NewYork State. Let'ssay that we have todo a survey oftown governmentsthat will require usgoing to the townspersonally. If wedo a simplerandom samplestate-wide we'llhave to cover theentire state
geographically. Instead, we decide to do a cluster sampling of five counties (marked in red in thefigure). Once these are selected, we go to every town government in the five areas. Clearly thisstrategy will help us to economize on our mileage. Cluster or area sampling, then, is useful insituations like this, and is done primarily for efficiency of administration. Note also, that weprobably don't have to worry about using this approach if we are conducting a mail or telephonesurvey because it doesn't matter as much (or cost more or raise inefficiency) where we call orsend letters to.Multi-Stage SamplingThe four methods we've covered so far -- simple, stratified, systematic and cluster -- are thesimplest random sampling strategies. In most real applied social research, we would usesampling methods that are considerably more complex than these simple variations. The mostimportant principle here is that we can combine the simple methods described earlier in a varietyof useful ways that help us address our sampling needs in the most efficient and effective mannerpossible. When we combine sampling methods, we call this multi-stage sampling.For example, consider the idea of sampling New York State residents for face-to-face interviews.Clearly we would want to do some type of cluster sampling as the first stage of the process. Wemight sample townships or census tracts throughout the state. But in cluster sampling we wouldthen go on to measure everyone in the clusters we select. Even if we are sampling census tractswe may not be able to measure everyone who is in the census tract. So, we might set up astratified sampling process within the clusters. In this case, we would have a two-stage samplingprocess with stratified samples within cluster samples. Or, consider the problem of samplingstudents in grade schools. We might begin with a national sample of school districts stratified byeconomics and educational level. Within selected districts, we might do a simple random sampleof schools. Within schools, we might do a simple random sample of classes or grades. And,within classes, we might even do a simple random sample of students. In this case, we have threeor four stages in the sampling process and we use both stratified and simple random sampling.By combining different sampling methods we are able to achieve a rich variety of probabilisticsampling methods that can be used in a wide range of social research contextsSampling TerminologyAs with anything else in life you have to learn the language of an area if you're going to everhope to use it. Here, I want to introduce several different terms for the major groups that areinvolved in a sampling process and the role that each group plays in the logic of sampling.The major question that motivates sampling in the first place is: "Who do you want to generalizeto?" Or should it be: "To whom do you want to generalize?" In most social research we areinterested in more than just the people who directly participate in our study. We would like to beable to talk in general terms and not be confined only to the people who are in our study. Now,there are times when we aren't very concerned about generalizing. Maybe we're just evaluating aprogram in a local agency and we don't care whether the program would work with other peoplein other places and at other times. In that case, sampling and generalizing might not be of
interest. In other cases, we would really like to be able to generalize almost universally. Whenpsychologists do research, they are often interested in developing theories that would hold for allhumans. But in most applied social research, we are interested in generalizing to specific groups.The group you wish to generalize to is often called the population in your study. This is thegroup you would like to sample from because this is the group you are interested in generalizingto. Let's imagine that you wish to generalize to urban homeless males between the ages of 30 and50 in the United States. If that is the population of interest, you are likely to have a very hardtime developing a reasonable sampling plan. You are probably not going to find an accuratelisting of this population, and even if you did, you would almost certainly not be able to mount anational sample across hundreds of urban areas. So we probably should make a distinctionbetween the population you would like to generalize to, and the population that will be accessibleto you. We'll call the former the theoretical population and the latter the accessible population.In this example, the accessible population might be homeless males between the ages of 30 and50 in six selected urban areas across the U.S.Once you've identified the theoretical and accessible populations, you have to do one more thingbefore you can actually draw a sample -- you have to get a list of the members of the accessiblepopulation. (Or, you have to spell out in detail how you will contact them to assurerepresentativeness). The listing of the accessible population from which you'll draw your sampleis called the sampling frame. If you were doing a phone survey and selecting names from thetelephone book, the book would be your sampling frame. That wouldn't be a great way to samplebecause significant subportions of the population either don't have a phone or have moved in orout of the area since the last book was printed. Notice that in this case, you might identify thearea code and all three-digit prefixes within that area code and draw a sample simply byrandomly dialing numbers (cleverly known as random-digit-dialing). In this case, the samplingframe is not a list per se, but is rather a procedure that you follow as the actual basis forsampling. Finally, you actually draw your sample (using one of the many sampling procedures).
The sample is the group of people who you select to be in your study. Notice that I didn't saythat the sample was the group of people who are actually in your study. You may not be able tocontact or recruit all of the people you actually sample, or some could drop out over the courseof the study. The group that actually completes your study is a subsample of the sample -- itdoesn't include nonrespondents or dropouts. The problem of nonresponse and its effects on astudy will be addressed when discussing "mortality" threats to internal validity.People often confuse what is meant by random selection with the idea of random assignment.You should make sure that you understand the distinction between random selection and randomassignment.At this point, you should appreciate that sampling is a difficult multi-step process and that thereare lots of places you can go wrong. In fact, as we move from each step to the next in identifyinga sample, there is the possibility of introducing systematic error or bias. For instance, even if youare able to identify perfectly the population of interest, you may not have access to all of them.And even if you do, you may not have a complete and accurate enumeration or sampling framefrom which to select. And, even if you do, you may not draw the sample correctly or accurately.And, even if you do, they may not all come and they may not all stay. Depressed yet? This is avery difficult business indeed. At times like this I'm reminded of what Donald Campbell used tosay (I'll paraphrase here): "Cousins to the amoeba, it's amazing that we know anything at all!"The main idea of statistical inference is to take a random sample from a population and then touse the information from the sample to make inferences about particular populationcharacteristics such as the mean (measure of central tendency), the standard deviation (measureof spread) or the proportion of units in the population that have a certain characteristic. Samplingsaves money, time, and effort. Additionally, a sample can, in some cases, provide as muchinformation as a corresponding study that would attempt to investigate an entire populationcareful collection of data from a sample will often provide better information than a less carefulstudy that tries to look at everything.We must study the behavior of the mean of sample values from different specified populations.Because a sample examines only part of a population, the sample mean will not exactly equal thecorresponding mean of the population. Thus, an important consideration for those planning andinterpreting sampling results, is the degree to which sample estimates, such as the sample mean,will agree with the corresponding population characteristic.In practice, only one sample is usually taken (in some cases such as "survey data analysis" asmall "pilot sample" is used to test the data-gathering mechanisms and to get preliminaryinformation for planning the main sampling scheme). However, for purposes of understandingthe degree to which sample means will agree with the corresponding population mean, it isuseful to consider what woul
An Introduction to Sampling Theory The applet that comes with this WWW page is an interactive demonstration that will show the basics of sampling theory. Please read ahead to understand more about what this program does. For more information on the use of this applet see the bottom of this