Transcription
MATEC Web of Conferences 135, 00032 (2017)ICME’17DOI: 10.1051/matecconf/201713500032Value Stream Mapping to Improve Workplace tosupport Lean EnvironmentAhmad Nur Aizat Ahmad.1,*, Te Chuan Lee.1 Rohaizan Ramlan.1 , Md. Fauzi Ahmad. 1,Norafifah Husin 2 and Mustaqqim Abdul Rahim.31Department of Production and Operation Management, Faculty of Technology Management andBusiness, Universiti Tun Hussein Onn Malaysia (UTHM), Malaysia2Department of Industrial Engineering, Faculty of Mechanical Engineering, Universiti TeknologiMalaysia (UTM), Malaysia3Department of Civil Engineering, School of Environmental Engineering, Universiti Malaysia Perlis(UniMAP), MalaysiaAbstract. In recent years, lean manufacturing is being followed byvarious sectors in order to keep their competitiveness in the global markets.Lean manufacturing plays a vital role in improving the efficiency ofoperation by eliminating or reducing wastes. Nonetheless, most of smalland medium enterprises (SMEs) lack sufficient knowledge or informationon the benefits of implementing lean manufacturing. The main objective ofthis study is to apply value stream mapping, one of lean manufacturingtools, for improving the productivity in a SME by eliminating non-valueadded activities. In this study, lean manufacturing was adopted at a SME,particularly a food industry. Value stream mapping was served as maintool to identify the wastes and improvement opportunities in productionline. Subsequently, different lean manufacturing tools such as KaizenBurst, one piece flow, and 5S were applied to eliminate or reduceidentified wastes. Based on the future state value stream mapping, finalresults showed that the total operation time and non-added value activitiestime were successfully decreased from 1993 seconds to 1719 seconds, and234 seconds to 104 seconds, respectively. The findings of this studyindicate that value stream mapping is an effective approach to eliminate thewastes and improve the productivity.1.0 IntroductionDespite an abundance of obstacles, the biggest challenge faced by manufacturer is how todeliver their products or services quickly at low cost but high quality. A number ofapproaches have been undertaken using computer simulation, statistical analysis, and leanmanufacturing for improving the productivity and efficiency of production line [1]. Amongthese, lean manufacturing is one of most popular approaches and has been widelyimplemented in many manufacturing industries around the world.*Corresponding author: aizat@uthm.edu.my The Authors, published by EDP Sciences. This is an open access article distributed under the terms of the Creative CommonsAttribution License 4.0 (http://creativecommons.org/licenses/by/4.0/).
MATEC Web of Conferences 135, 00032 (2017)ICME’17DOI: 10.1051/matecconf/201713500032Lean manufacturing is currently becoming more popular in manufacturing industries. Itcan be seen that lean manufacturing has been developed, growth up, and adoptedprogressively in many major manufacturing industries in order to remain their competitivein an increasingly global market [2]. The main focus of this approach is on cost reductionby eliminating waste or non-value added activities. In other words, the perfect strive of themanufacturing system can be achieved through successful implementation of lean elements[3].Lean manufacturing has been proven its capability in improving workplaceeffectiveness, most notably in waste reduction. In general, workplace is defined as physicalstructure and location where work is undertaken and organized. It is necessary to ensure theprocesses in the workplace are run smoothly and absence of non-value added activities suchas waiting time, overproduction, and unnecessary movement. Nowadays, almost all themanufacturing industries trying to improve the productivity performance by minimizing theproduction lead time and waste. However, most of SMEs facing obstacle such asproduction waste management. This is attributed to the fact that SMEs lack sufficientknowledge or information on the benefits of implementing lean manufacturing [4,5].In order to address these issues, a case study was conducted in a domestic SME,particularly food industry, to reduce the total production lead time through elimination ofnon-value added activities. Value stream mapping (VSM), one of lean manufacturing tools,was applied to eliminate non-added value activities in production line. There are threeobjectives for this study: (1) To apply VSM for identifying non-value added activities andhighlighting the improved area, (2) To analyse the current state of VSM to improve processflow of the operation, and (3) To propose future state of VSM for the company.2.0 Literature Review2.1 Lean ManufacturingLean manufacturing concept was originated from Japan after the World War II owing to thevast shortage of materials, financial, and human resource. Lean manufacturing or known asToyota Production System (TPS) is a production strategy that aims to eliminate waste anddeliver increased value to the product and customer. Generally, lean manufacturing focuseson pinpointing the major source of wastes and eliminate the wastes using leanmanufacturing tools [6–10]. There are several lean manufacturing tools have beenextensively used to identify and eliminate wastes, for example, include but not limited toKanban, 5S, Kaizen, Value Stream Mapping, Total Productive Maintenance, and PokaYoke [11]. Apparently, lean manufacturing attract a great of attention in manufacturingindustries owing to its exclusive advantages, i.e. reduce lead time, reduce inventory, requireless space, less process waste, increase process understanding, and financial saving [10].It is often suggested that lean should be understood on two levels: (1) the strategic levelof how to understand value, and (2) the operational level (tools) of how to eliminate waste[12]. It is noteworthy to mention that lean manufacturing strives for perfection throughcontinuous improvement to eliminate waste by identifying value added activities (VA) andnon-value added activities (NVA).2
MATEC Web of Conferences 135, 00032 (2017)ICME’17DOI: 10.1051/matecconf/201713500032Lean means manufacturing without waste. Waste, or known as “Muda” in Japaneseterm, is defined as any activity in a process which does not add value to the customer.However, sometime the waste cannot be eliminated as it is a necessary part of the processand adds value to the company, for instance, financial control [10]. There are seven sourcesof the NVA wastes commonly found in manufacturing industries, which are,overproduction, waiting, transportation, unnecessary motion, unnecessary inventory,defects, and inappropriate processing. Elimination of these wastes is achieved through thesuccessful implementation of lean elements. Continuous improvement is the core of leanthinking, therefore, all the processes will continually improve to reduce the waste andultimately achieve a waste-free process [6–8,20].2.2 Value Stream MappingValue stream mapping (VSM) is one of the lean manufacturing tools to identify wastage ofresource and eliminate or reduce them for improving productivity [14]. Nowadays. VSMhas been widely used in many sector such as healthcare industry, manufacturing industry,finance firm, office environment, etc [15]. It has been recognized that VSM is a powerfullean tool to improve the productivity of manufacturing industries.Generally, VSM is a collection of all actions such as value added and non-value addedactivity that are required to bring a product through the main flows, starting with rawmaterial and ending with customer [16]. According to Rother & Shook [16], VSM is adrawing map using a predetermined set of standardized icons to virtualize a product’sproduction path from start to end. There are two different in the method of VSM, which arefuture state of VSM and current state of VSM. Current state map: A current state map (CSM) is a snapshot of how a process iscurrently done. It is also known as current state process flowchart, or a current state valuestream map, but the principle is the same. The CSM shows the current methodology of howthe products being produced or service being performed to customer. The CSM enablesprocess flow to be identified, analysis data, as well as identity and prioritise areas forimprovement [7,9]. Future state map: Future state map (FSM) illustrates how things should be done basedon takt time requirements [17]. FSM presents the flow of product after eliminating allinefficiency activities. There are three phases for mapping the future state which have to beperformed together, namely (1) Customer demand phase: Understanding the customerneeds for service, quality, and lead time, (2) Continuous flow phase: Implementation ofcontinuous flow by make sure customer receive the right item, in the right quality, and atthe right time, and (3) Levelling phase: Distribute the works evenly to reduce queue times[18].Basically, there are 4 steps to improve efficiency of manufacturing industries usingVSM, which are: (1) choose a particular product or product family as the target forimprovement, (2) illustrate a current state map after walking and observing along the actualprocess, (3) analyse the current system and identify the weakness and waste, (4) create thefuture state map to virtualize a picture of how the production line should look aftereliminating wastes [9].3
MATEC Web of Conferences 135, 00032 (2017)ICME’17DOI: 10.1051/matecconf/201713500032In the practical situation, Ventakaraman et al. [19] applied the VSM for reduction ofcycle time in a machining process in order to increase the export sales. The results showedthat the manufacturing time successfully reduced by 40 %, defects were reduced, higherprocess capability and quick response to the customer demand in small lots were achieved.Meanwhile, Rohani and Zahraee [1] conducted a case study to improve the productionline using VSM. A leading manufacturer of industrial building paint was selected as a casestudy for their research. The FSM showed that production lead time decreased from 8.5days to 6 days, and the value added time decreased from 68 minutes to 37 minutes afterimplementing some lean manufacturing tools such as 5S, Kanban method, and Kaizen.Similarly, Ahmad, A.N.A [20] applied VSM in a manufacturing firm producing aircraftparts. He mentioned that application of VSM uncovered number of problems andbottlenecks in company production process. Surprisingly, huge improvements had beenmade after applying VSM. Total lead time successfully reduced by 24.8%. On the otherhand, the VA index increased around 32%.Recently, Stadnicka and Ratnayake [21] demonstrated the use of VSM in aircraftmaintenance processes for minimizing the lead-time of maintenance services andsubsequently minimizing the costs of maintenance services. As expected, production leadtime decreased by 63% after eliminating NVA. Additionally, they also revealed that theprocess cycle efficiency has increased about four times.3.0 Research MethodologyA SME company in Batu Pahat, Johor was selected as a case study for this paper. Thiscompany is a popular manufacturer of various fried chips. The total number of operators is19. All the operators in the production line were involved in this study. The average dailydemand of customer is approximately to 462 kg. Meanwhile, the working time is 8 hoursper day including 1 hour break.Qualitative approach was used in this study for collecting data. Observation and timestudy were carried out for obtaining accurate data. The cycle time of each process wasrecorded using a stopwatch. As mentioned previously in literature review, there are seventypes of wastes in production line. However, underutilizing talent was added in this studyas the eighth waste because this factor is directly affected the production system and createunwanted waste, as discussed by other author [22].Initially, the observation was made for collecting data such as layout and facilities ofcompany, number of operators, number of processes and cycle time for each process. Next,the current state map of the company is prepared in order to identify the potential wastesand improvement opportunities in the production line. Subsequently, several leanmanufacturing tools such as Kaizen Burst, one piece flow, and 5s were implemented forenhancing the efficiency of production line. Takt time also was calculated to set the pace ofproduction process. In the end of the study, a future state map was illustrated to examinethe effectiveness of proposed improvements by comparing the total operation time betweenthe current state and future state map.4
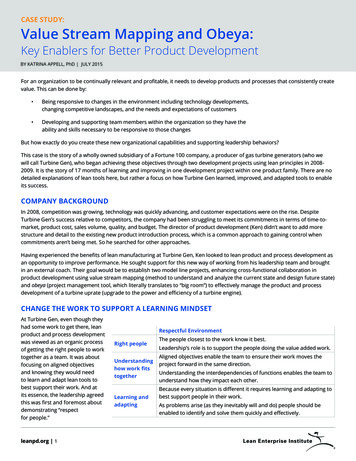
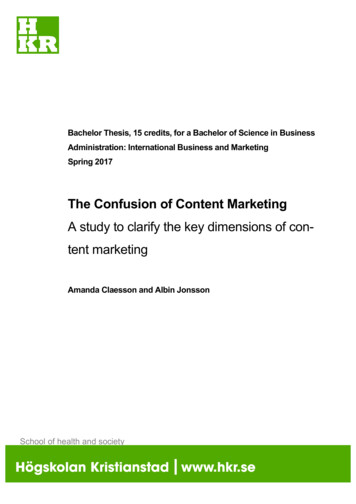
MATEC Web of Conferences 135, 00032 (2017)ICME’17DOI: 10.1051/matecconf/2017135000324.0 Results and Discussion4.1 Current State Value Stream Mapping (CSVSM)The ultimate goal of CSVSM is to illustrate how a product flow through the value stream,starting from raw materials to finished product. In this study, 9 processes were identified asfollows:Process 1: Materials preparationProcess 2: Peeling processProcess 3: Cutting processProcess 4: Wash and transfer into basketProcess 5: Frying process and put on the trayProcess 6: Packaging for 5 kgProcess 7: Arrange on the rackProcess 8: Packaging for 500 gProcess 9: Warehouse4.1.1 Takt TimeTakt time is defined as the time needed to produce a product to meet customers’ demand.Basically, if the demand increases, the Takt time decrease, and vice versa. On the otherhand, if bottleneck cycle time less than Takt time, then customers’ demand met, and viceversa [7]. Hence, Take time is served as a management tool to determine whether theproduction line is ahead or behind the production schedule. Additionally, it also plays avital role as an alignment tool to calculate the real-time production needs. In this case, Takttime was calculated as below:Customer demand per dayWorking timeBreak timeAvailable time: 462 kg: 8 hours (one shift per day): 1 hour: 7 hours per dayTakt time Net Operating Time / Customer Demand (8 hours – 1 hours) x 60 min / 462 kg 0.9 min per kg 54 secFig. 1 demonstrates the CSVSM. Meanwhile, a summary of NA and NVA data istabulated in Table 1. Based on Fig. 1 and Table 1, it can be clearly seen that the total leadtime for manufacturing process is 2227 seconds (approximately to 37.12 minutes).Specifically, the time of VA and NVA are 1993 seconds (approximately to 33.22 minutes),and 234 seconds (approximately to 3.9 minutes), respectively, Hence, it can be inferred thatthe time of NA is higher than NVA, and the flow of process is stable. However, there’s stillhave room for improvement.5
MATEC Web of Conferences 135, 00032 (2017)ICME’17DOI: 10.1051/matecconf/201713500032Fig. 1: The current state value stream mapping.Table 1: Summary of VA and NVAOperationNumber123456789ProcessesMaterials preparationPeeling processCutting processWash and transfer into basketFrying process and put on the trayPackaging for 5 kgArrange on the rackPackaging for 500 gWarehouseTotalsTotal Operation Time(sec)LeadVANVATime1280 361993 2342227% NVA (tobeeliminated)1.17087.350.008.710.715043.06754.2 Problem Identification and Improvement ProposalTo improve the process flow of the production, identifying the waste in the process is thefirst step to be carried out. The problems can be solved when the wastes are identified aswell as where the problems are coming from. Based on observations and CSVSM, asummary of improvement proposal is presented in Table 2.6
MATEC Web of Conferences 135, 00032 (2017)ICME’17DOI: 10.1051/matecconf/201713500032Table 2: The improvement proposalNo.WasteObservationsProposed Improvement New floor layout for theproduction area Apply one-piece flow in theproduction line1UnnecessarymotionOperators needed to walk further toget the materials2SpaceMoving space of forklift waslimited owing to a portion offinished product and raw materialsinventory were placed outside of thewarehouse3UnderutilizingtalentCreative and talented operatorswere instructed to do only one task Give the operators anopportunity to express theiropinions for improving thecurrent production line flow4DefectsThe materials is overcooked orundercooked Set the timer to avoidovercooked or undercooked5ExcessProcessingPackaging for 5 kg and 500 gproducts were done in differentworkstations. Combine the packagingprocess for 5 kg and 500 g6Waiting7TransportationOperators cannot proceed their taskif the previous processes weredelayedLack of wheelbarrow and trolleycart and consequently affect thedaily output Reallocate the number ofoperatorateachworkstation Rearrange the tool cart’sschedule to maximize itsusage Make the packaging roombecome the storage room Apply the 5S concept in theproduction area4.2.1 Kaizen BurstKaizen Burst is a lean manufacturing tool to generate the improvement ideas during pahseof developing current and future state of VSM. In this study, there are 6 Kaizen Burst hadbeen applied to reduce the NVA and lead time. As shown in Fig. 1, the 6 Kaizen Burstapplied in this study are as follows:1st2nd3rd & 5th4th6th: Reallocated the operators: Reduced the operators in the workstation: Transferred the operator to other workstation: Place the basket in the basin during washing process: Combine the process 6 and 87
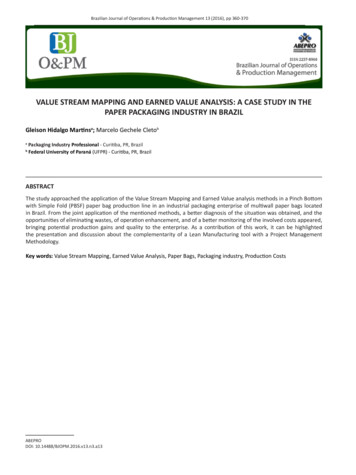
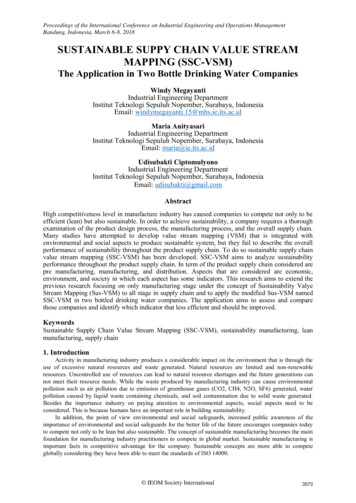
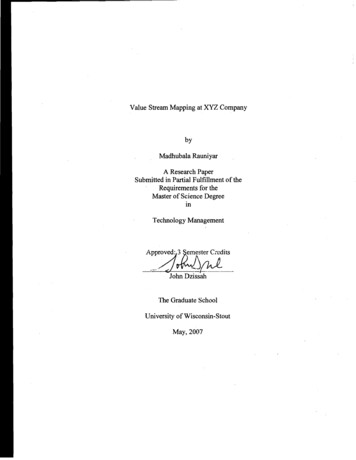
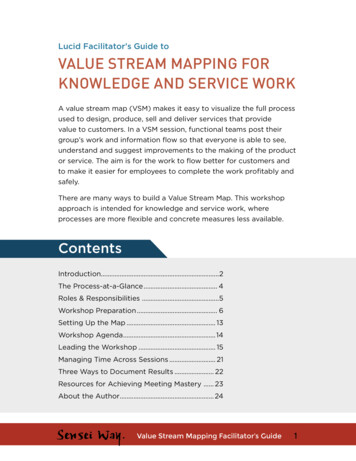
MATEC Web of Conferences 135, 00032 (2017)ICME’17DOI: 10.1051/matecconf/2017135000324.2.3 One-piece Flow Concept in the Production LineContinuous flow, or sometimes to be called as single piece flow or one-piece flow, refer tothe concept of the movement of work in progress (WIP) /work piece at 1 time betweenproduction process in a work cells. It keeps WIP at the lowest possible inits and encouragebalance in work as well as improve the quality of work. [23]. As mentioned previously,unnecessary movement of operators resulted increasing of lead time. Therefore, one pieceflow process was suggested in this case to avoid spending time on walking from one stationto another.4.2.4 Application of the 5S in the Production Area5S is a method on how to organize workplace in the proper and tidy environment. Thismethod is applied at a production area either others areas which to entrust the areas are inproper arrangement f material and in proper flow of the material movement. In this case,the floor in production area was dirty, dusty, and slippery. This occurred mainly due to thefallen soil from the raw materials, spillage of water during the washing process, andspillage of cooking oil during the frying process. Therefore, 5S was implemented toeliminate wastes that resulted from a poorly organized production area and avoid theunwanted accident. Few improvements were made in this case, for example, the floor ofproduction line were swapped and mopped frequently, the rack was arranged properly tomaximize the usage of the space for other purposes, and tools were cleaned and placedproperly after being used.4.2.2 New Floor LayoutThe biggest waste occurred in the production line was unnecessary movement, especiallyoperators from the cutting and frying station. Operators of both stations needed to walkfurther to get the materials and return with heavy loads. Consequently, the cycle time wasincreased. Fig. 2 and 3 illustrates the movement of operators in the production area beforeand after implementing proposed improvement, respectively.Fig. 2: Floor layout before implementing proposed improvement.8
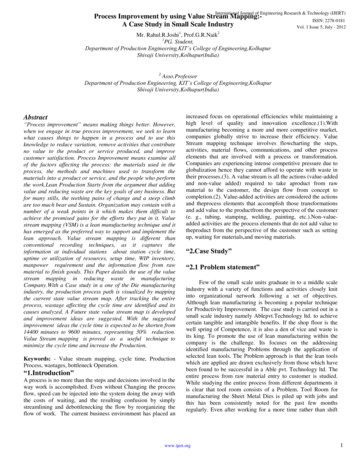
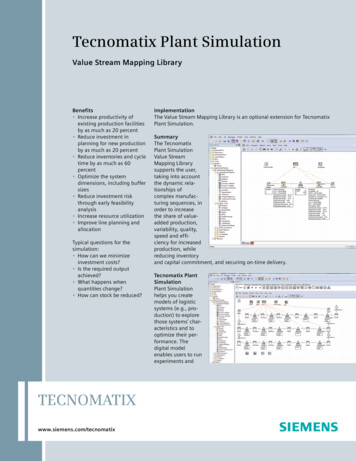
MATEC Web of Conferences 135, 00032 (2017)ICME’17DOI: 10.1051/matecconf/201713500032Fig. 3: Floor layout after implementing proposed improvement.4.3 Future State of Value Stream Mapping (FSVSM)FSVSM is a tool to illustrate the improvement plan after implementing lean manufacturingtools. In this case, the existing processes had been combined and reduced to 8 processes, asfollows:Process 1: Materials PreparationProcess 2: Peeling processProcess 3: Cutting processProcess 4: Wash and transfer into basketProcess 5: Frying process and put on the trayProcess 6: Packaging for 5kg and 500gProcess 7: Arrange on the rackProcess 8: WarehouseThe FSVSM of this study is shown in Fig. 4. Meanwhile, comparison of cycle timebetween current state and future state is presented in Table 3. It is noteworthy to mentionthat the quality of finished product remain unchanged even though the 2 packagingprocesses were combined. As shown in Table 2, it can be inferred that the total operationtime reduced from 1993 seconds to 1719 seconds, or 13.75 % reduction. On top of that, theNVA was successfully decreased from 234 seconds to 104 seconds. Additionally, negativevalues of total reduced can be noticed from Table 2. This occurred mainly due to theincreasing number of operators at that particular process. However, it resulted in areduction of waiting time, bottleneck at workstation, and production flow becamesmoother. It is critical to note that increasing of cycle time in this study does not lead toincreasing of waste, and conversely increased the value added time to the products.9
MATEC Web of Conferences 135, 00032 (2017)ICME’17DOI: 10.1051/matecconf/201713500032Fig. 4: Future state value stream mapping.Table 3: Comparison between current and future value stream ss 1Process 2Process 3Process 4Process 5Process 6Process 8Process 7Process 9TotalTotal Operation Time (sec)FutureCurrent StateTotal reducedState% reduced orincreased9 processes8 71920274100013.755.0 ConclusionsIn summary, this study has shown that VSM is an effective tool to eliminate waste inproduction operation of industry. The application of VSM associated with different leanmanufacturing tools had successfully enhance the efficiency of production line. Moreover,the new floor layout and combination of two packaging processes were effectively reducedthe unnecessary movement and NVA. The total operation time and NVA time weresuccessfully reduced from 1993 seconds to 1719 seconds, and 234 seconds to 104 seconds,respectively. Consequently, it can reduce the company’s operation cost, enhance theoperating performance of production line, and lastly meet the customers’ demand.10
MATEC Web of Conferences 135, 00032 (2017)ICME’17DOI: 10.1051/matecconf/2017135000326.0 AcknowledgmentAppreciation to UTHM and ORICC, Universiti Tun Hussein Onn for supporting thisresearch. Appreciation also to Manufacturing Technology Management (MTM) focusgroup, Faculty of Technology Management, .16.17.18.19.20.21.22.23.J.M. Rohani, S.M. Zahraee, Procedia Manuf. 2, 6–10 (2015)A. Azizi, T. T. Manoharan, Procedia Manuf. 2, 153–158 (2015)A. Agarwal, A. Kumar, A.K. Madan, Int. J. Ind. Eng. Technol. 7, 31–38 (2015)A. Raghunath, R.V. Jayathirtha, J. Adv. in Res. & Technol 2, 1–7 (2013)O. Bakås, T. Givaert, H. Van Landeghem, Challenges and success factors forimplementation of lean manufacturing in European SMES (Tapir Academic Press,Norway, 2011)E.W. Dickson, S. Singh, D.S. Cheung, C.C. Wyatt, A.S. Nugent, J. Emerg. Med. 37,177–182 (2009)R. Sundar, A.N. Balaji, R.M. Satheesh Kumar, Procedia Eng. 97, 1875–1885 (2014)M.G. Yang, P. Hong, S.B. Modi, Int. J. Prod. Econ. 129, 251–261 (2011)F.A. Abdulmalek, J. Rajgopal, Int. J. Prod. Econ. 107, 223–236 (2007)T. Melton, Chem. Eng. Res. Des. 83, 662–673 (2005)A. R.R. Rahani, M. Al-Ashraf, Procedia Eng. 41, 1727–1734 (2012)P. Hines, N.L. Rich, Int. J. Oper. &Production Manag. 17, 46–64 (1997)R. Shah, P.T. Ward, J. Oper. Manag. 25, 785–805 (2007)S.K.P.N. Silva, Int. J. Lean Think. 3, 36–56 (2012)P. Senna, A. Gomes, A. Monteiro, D. Pinha, Brazilian J. Oper. Prod. Manag. 13, 406–420 (2016)J. Rother, M. & Shook, Learning to see: value stream mapping to create value andeliminate muda (The Lean Enterprise Institute, Massachusetts, 1999)D. Seth., V. Gupta, Prod. Plan. Control. 16, 44–59 (2005)T. Tapping, D. Shuker, Value stream management for the lean office (ProductivityPress, New York, 2003)K. Venkataraman, B.V. Ramnath, V.M. Kumar, C. Elanchezhian, Procedia Mater. Sci.6, 1187–1196 (2014)A.N.A. Ahmad, H. Sulaiman, Int. J. Mech. Eng. And Adv. Mat. 1, 13-18 (2015)D. Stadnicka, R.M.C. Ratnayake, Procedia Eng. 182, 665–672 (2017)A. Muse Ouma, D.A. W. Njeru, J. Dennis, Int. J. Acad. Res. Bus. Soc. Sci. 4, 361–368(2014)A. C. Yamagar; P. M. Ravanan, Proc. 2nd Int. Conf. Manuf. Eng. Qual. Prod. Syst.104–112 (2010)11
Value Stream Mapping to Improve Workplace to support Lean Environment Ahmad Nur Aizat Ahmad.1,*, Te Chuan Lee.1 Rohaizan Ramlan.1, Md. Fauzi Ahmad. 1, Norafifah Husin 2 and Mustaqqim Abdul Rahim.3 1Department of Production and Operation Management, Faculty of Technology Management and Busin