Transcription
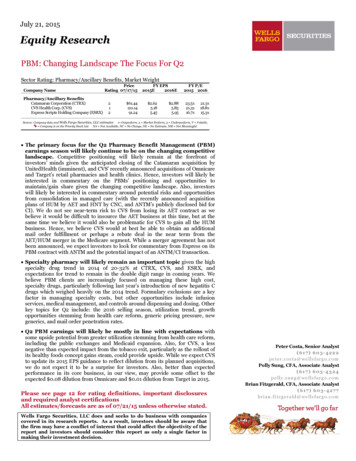
July 21, 2015Equity ResearchPBM: Changing Landscape The Focus For Q2Sector Rating: Pharmacy/Ancillary Benefits, Market WeightCompany NamePharmacy/Ancillary BenefitsCatamaran Corporation (CTRX)CVS Health Corp. (CVS)Express Scripts Holding Company (ESRX)PriceRating 07/17/15212 61.44110.1491.24FY EPS2015E2016E 2.625.185.45 2.885.855.95FY P/E2015 201623.5x21.3x16.7x21.3x18.8x15.3xSource: Company data and Wells Fargo Securities, LLC estimates 1 Outperform, 2 Market Perform, 3 Underperform, V Volatile, Company is on the Priority Stock List NA Not Available, NC No Change, NE No Estimate, NM Not Meaningful The primary focus for the Q2 Pharmacy Benefit Management (PBM)earnings season will likely continue to be on the changing competitivelandscape. Competitive positioning will likely remain at the forefront ofinvestors’ minds given the anticipated closing of the Catamaran acquisition byUnitedHealth (imminent), and CVS’ recently announced acquisitions of Omnicareand Target’s retail pharmacies and health clinics. Hence, investors will likely beinterested in commentary on the PBMs’ positioning and opportunities tomaintain/gain share given the changing competitive landscape. Also, investorswill likely be interested in commentary around potential risks and opportunitiesfrom consolidation in managed care (with the recently announced acquisitionplans of HUM by AET and HNT by CNC, and ANTM’s publicly disclosed bid forCI). We do not see near-term risk to CVS from losing its AET contract as webelieve it would be difficult to insource the AET business at this time, but at thesame time we believe it would also be problematic for CVS to gain all the HUMbusiness. Hence, we believe CVS would at best be able to obtain an additionalmail order fulfillment or perhaps a rebate deal in the near term from theAET/HUM merger in the Medicare segment. While a merger agreement has notbeen announced, we expect investors to look for commentary from Express on itsPBM contract with ANTM and the potential impact of an ANTM/CI transaction. Specialty pharmacy will likely remain an important topic given the highspecialty drug trend in 2014 of 20-32% at CTRX, CVS, and ESRX, andexpectations for trend to remain in the double digit range in coming years. Webelieve PBM clients are increasingly focused on managing these high cost,specialty drugs, particularly following last year’s introduction of new hepatitis Cdrugs which weighed heavily on the 2014 trend. Formulary exclusions are a keyfactor in managing specialty costs, but other opportunities include infusionservices, medical management, and controls around dispensing and dosing. Otherkey topics for Q2 include: the 2016 selling season, utilization trend, growthopportunities stemming from health care reform, generic pricing pressure, newgenerics, and mail order penetration rates. Q2 PBM earnings will likely be mostly in line with expectations withsome upside potential from greater utilization stemming from health care reform,including the public exchanges and Medicaid expansion. Also, for CVS, a lessnegative than expected impact from the tobacco exit, particularly as the rollout ofits healthy foods concept gains steam, could provide upside. While we expect CVSto update its 2015 EPS guidance to reflect dilution from its planned acquisitions,we do not expect it to be a surprise for investors. Also, better than expectedperformance in its core business, in our view, may provide some offset to theexpected 0.08 dilution from Omnicare and 0.01 dilution from Target in 2015.Please see page 12 for rating definitions, important disclosuresand required analyst certificationsAll estimates/forecasts are as of 07/21/15 unless otherwise stated.Wells Fargo Securities, LLC does and seeks to do business with companiescovered in its research reports. As a result, investors should be aware thatthe firm may have a conflict of interest that could affect the objectivity of thereport and investors should consider this report as only a single factor inmaking their investment decision.Peter Costa, Senior Analyst(617) 603-4222peter.costa@wellsfargo.comPolly Sung, CFA, Associate Analyst(617) 603-4324polly.sung@wellsfargo.comBrian Fitzgerald, CFA, Associate Analyst(617) 603-4277brian.fitzgerald@wellsfargo.com
Managed Care/Ancillary BenefitsWELLS FARGO SECURITIES, LLCEQUITY RESEARCH DEPARTMENTExhibit 1. Q2 2015 Reporting SummaryQ2 2015E EPSFirst CallReportingT im eFirst CallRange(ET )DateCall Inform ationWells Fargo ConsensusLow - HighESRX7 /28/201 5888-469-1 342 #1 5653898:30 A M (7 /29) 1 .41 1 .40 1 .39 - 1 .42CVS8/4/201 5NANA 1 .20 1 .20 1 .1 8 - 1 .22CT RXNANANA 0.58 0.64 0.58 - 0.7 9Source: Company reports, FactSet, and Wells Fargo Securities, LLC estimates* Reporting after the market close with a conference call the following morning.Q2 2015 PreviewNot unlike last quarter, we believe the primary focus for the Q2 Pharmacy Benefit Management (PBM)earnings season will continue to be on the changing competitive landscape. In our view, the competitiveenvironment seems to be evolving rapidly. The acquisition of Catamaran by UnitedHealth is expected to closeby the end of July, while CVS Health recently announced plans to acquire Omnicare as well as Target’s retailpharmacies and health clinics. The Omnicare acquisition should expand CVS’ institution and specialtyfootprint, while the Target partnership should catapult CVS into the top position in terms of the number ofretail pharmacies operated in the U.S. Aside from acquisitions in the PBM/retail pharmacy space,consolidation in the managed care industry could also have ramifications for the PBMs. Over the past fewweeks, Aetna announced plans to acquire Humana, while Centene plans to acquire Health Net. Furthermore,while a formal merger announcement has not been made, Anthem has made a public bid for Cigna. Suchtransactions, upon completion, could represent both opportunities and risks for the PBMs that currently havecontracts with the aforementioned managed care companies. Aetna and Health Net currently contract withCVS, while Anthem has a contract with Express Scripts and Cigna with Catamaran (which is being acquired byUnitedHealth and is intended to be merged with OptumRx). Humana and Centene, on the other hand, operatetheir own internal PBMs. It is unlikely that either CVS Health or Express Scripts would provide muchcommentary around their outlooks for their respective contracts or thoughts around consolidation in themanaged care industry, although investors will likely look for hints as to what the potential impacts may be.Aetna’s PBM contract with CVS has a term ending in December 2022, although there are certain terminationrights beginning in January 2020, according to Aetna’s 10-K. Despite the optionality noted by both AET andHUM, we do not see near-term risk to CVS from losing its Aetna contract to the insourced Humana PBM as webelieve it would be problematic (capacity, retail systems, integration/migration risk, etc.) to insource the Aetnabusiness at this point. However, some of the Coventry business (which is currently with ESRX and is expectedto migrate to CVS in 2016/17) could perhaps shift to Humana’s internal PBM sooner. Conversely, we believeMedicare Advantage plans prefer to maintain much of the PBM contact with subscribers and believe Humana’sWalmart cobranded Part D product would also be problematic for CVS to gain from Humana, and therefore webelieve CVS would at best be able to obtain an additional mail order fulfillment or rebate contract in the nearterm from the combination in the Medicare segment. The other managed care deal that we believe investorsmay be watching closely is Anthem’s bid for Cigna as it could position Express well to gain the Cigna business ifsuch a deal was to be completed. However, that business is, we believe, already a very low margin contract atCTRX and hence, we wonder if it could shift to a new PBM without its cost increasing to Cigna/Anthem.Therefore, at best it might be used as leverage to renegotiate the ANTM/ESRX contract lower ahead of time, sowe doubt this would be a short-term win for ESRX.Aside from consolidation, specialty pharmacy will likely remain a key area of focus forinvestors. As we noted before, specialty pharmacy represents a significant area of growth for the PBMs, inour view, given double digit drug trends and an increasing prevalence of such drugs as the population ageswith a higher number of chronic conditions. The specialty drug trend accelerated in 2014 to 20-32% at CTRX,CVS, and ESRX, up from 14-16% in 2013, partly reflecting the new hepatitis C drugs that boasted high curerates (including Gilead’s Sovaldi and Harvoni and AbbVie’s Viekira Pak). Nevertheless, specialty drug trendwill likely remain high in the double-digit range over the next few years, allowing specialty drugs to account foran even greater proportion of total drug spend. We believe the PBMs will likely continue to highlight theircapabilities in managing specialty drug trend. While hepatitis C is likely less of an important topic now, it couldcontinue to serve as an important indicator of key trends for the next class of high cost therapies, such as newPCSK9 inhibitor cholesterol drugs. Express Scripts will likely continue to highlight the strength of itsTherapeutic Resource Centers and United Biosource Corporation (UBC) arm in providing clinical expertise toprepare for and manage new drugs. For CVS, we believe management would continue to emphasize SpecialtyConnect, formulary exclusions, Coram, and perhaps even the potential to offer specialty infusion services instore via MinuteClinics. Lastly, biosimilars are becoming a reality as the FDA approved the first biosimilar inthe U.S. in early March 2015. However, we believe biosimilars would be treated more like therapeuticequivalents rather than generics, and therefore would require greater skill and market power to achieve strongsavings.2
WELLS FARGO SECURITIES, LLCEQUITY RESEARCH DEPARTMENTPBM: Changing Landscape The Focus For Q2Other topics of interest will likely include the 2016 selling season. We expect the companies may startquantifying new business wins for next year. At this time last year, CVS cited gross wins for 2015 of 5.4 billionand net new business of 2.6 billion. On the Q2 2014 earnings call, Express Scripts had cited expectations forclaims volume to be slightly down to down 1.5% in 2015 reflecting relatively lower retention rate of 92-93%.However, retention rate is expected to improve to 94-97%, excluding loss of the Coventry business (which webelieve would lower the retention rate by about 3% if it was included), in 2016, according to management’scommentary at the investor day earlier this year. Separately, the PBMs may provide an update on utilizationtrend as well as growth opportunities stemming from health care reform, reimbursement rate pressure, generictrends and mail order penetration rates. In early July, Express published a study on pharmacy utilizationtrends among the new public exchange members, noting that new enrollees in Q1 2015 were generally healthierand spent less on medications compared to enrollees in Q1 2014. However, specialty medications remain arelatively higher proportion of overall spend for the exchange plans compared to traditional health plans.Lastly, we believe the increase in total brand market sales of expected generic launches in 2015 (led by Abilify,Nexium, Copaxone, Gleevec, and Namenda) could provide a boost to margins in H2 2015 and 2016 and weexpect investors may look for commentary around this benefit as well as on timing.Exhibit 2. Hepatitis C Remains An Important Topic For Specialty(New Prescriptions Include Sovaldi, Harvoni, and Viekira Pak)HCV New RxSovaldi, Harvoni, & Viekira Pak6.0K5.0KNRx Volume4.0K3.0K2.0K1.0K0.0KWeekCHAIN STORESFOOD STORESINDEPENDENTLONG-TERM CAREMAIL SERVICESPECIALTY MAIL SERVICESource: IMS Health, RAPID MVP Solutions, IMS National Prescription AuditTMDisclaimer: IMS Health. Any analysis is independently arrived by Wells Fargo Securities, LLC, on the basis of the data and other information,and IMS is not responsible for any reliance by recipients on either the data or analyses thereof.3
WELLS FARGO SECURITIES, LLCEQUITY RESEARCH DEPARTMENTManaged Care/Ancillary BenefitsExhibit 3. Consumer ConfidenceExhibit 4. Home PricesS&P/Case-Shiller Composite Home Price Index20 CityConsumer Confidence12020.0%10015.0%10.0%YoY Change60405.0%0.0%-5.0%-10.0%-15.0%20-20.0%Source: FactSet and Wells Fargo Securities, LLCSource: FactSet and Wells Fargo Securities, LLCExhibit 5. CPI For Prescription DrugsExhibit 6. Monthly Wholesale Trade – DrugsCPI-USeasonally AdjustedApr-2015Aug-201425.0%6.0%20.0%5.0%YoY Change tion DrugsSource: Bureau of Labor Statistics, FactSet, and Wells Fargo Securities, ov-2013May-2014Nov-2014May-2015YoY ChangeApr-2013Monthly Wholesale Trade - SalesDrugs and Druggists' Index80Source: U.S. Census Bureau, and Wells Fargo Securities, LLC
WELLS FARGO SECURITIES, LLCEQUITY RESEARCH DEPARTMENTPBM: Changing Landscape The Focus For Q2Catamaran Corporation (CTRX)Exhibit 7. Quarterly Operating Metricsin millions, unless otherwise noted1Q14A 2Q14A 3Q14A 4Q14A 1Q15AOperating StatisticsAdjusted prescription claimsGeneric dispensing rateRevenueGross 0) bps2.7%160 bps2Q15EQtr/QtrYr/Yr1.0%0 bps2.5%60 bps 4,914 315 171 5,386 330 189 5,542 352 206 5,740 364 222 5,979 379 215 6,083 384 6.5%12.7%Adjusted EPS ( ) 0.50 0.54 0.58 0.67 0.59 0.58-11.1%18.0%-1.4%8.8%Margin AnalysisGross profit per adjusted RxEBITDA per adjusted Rx 3.15 1.71 3.26 1.86 3.48 2.04 3.57 2.18 3.69 2.09 3.71 2.05 0.12( 0.08) 0.54 0.38Gross profit marginEBITDA 3.5%0 bps(30) bps(10) bps10 bps 0.02( 0.05)0 bps(10) bps 0.45 0.1820 bps0 bpsSource: Company reports and Wells Fargo Securities, LLC estimates Catamaran is not formally releasing Q2 earnings as its acquisition by UnitedHealth is expected to closeimminently. Furthermore, Catamaran has not yet announced a date to release Q2 earnings. On March 30,UnitedHealth Group (UNH) announced plans to acquire Catamaran, which would be combined withOptumRx, in a cash deal valued at approximately 12.8 billion or 61.50 per CTRX share. The transactionwas previously expected to close in Q4 2015, but seems to be ahead of plan as the transaction is nowexpected to be completed by the end of July 2015, according to UnitedHealth, as Catamaran shareholdersapproved the acquisition by UnitedHealth on July 14 and the Supreme Court of Yukon approved it on July16. We estimate Q2 2015 adjusted EPS (excluding intangible amortization) of 0.58, which is below theconsensus estimate of 0.64. Our FY 2015 adjusted EPS estimate of 2.62, however, is in line with theconsensus estimate. In conjunction with the Q4 earnings release, Catamaran provided its initial 2015adjusted EPS outlook of 2.45-2.60, which included revenue outlook of 23.5-24.5 billion and EBITDAoutlook of 905-930 million. On a GAAP basis, EPS was projected to be in the range of 1.77-1.92. Thisguidance, however, does not include any impact from the acquisition of Healthcare Solutions, whichclosed in early April. The 405 million transaction was funded through existing cash balance andHealthcare Solutions was expected to generate approximately 35 million in annual EBITDA, excludingestimated annualized synergies of about 10 million once fully integrated (12-18 months post-closing).Not surprisingly, Catamaran did not update its 2015 EPS guidance in its Q1 2015 earnings release. Earnings comparison in Q2 2015 relative to the prior year quarter will likely remain favorable, benefitingfrom continued accretion from the acquisitions of both Catalyst (closed 7/2/12) and Restat (10/1/13) aswell as new business wins ( 1.2 billion for 2015), the recently closed acquisitions of Salveo SpecialtyPharmacy (closed 1/2/15) and Healthcare Solutions (closed 4/8/15), and the ramp up of the Cignaexpanded contract implementation that occurred throughout 2014, which, combined, should supportadjusted claim volume growth of 2.5% and revenue growth of 13% in Q2, albeit slowing from Q1. Weproject the generic dispensing rate to continue to rise yr/yr, but to be flattish sequentially. We expectprofitability per script will likely continue to rise yr/yr on a higher GDR (generic dispensing rate) andincreased specialty pharmacy revenues, offset partly by one-time transaction/integration expenses relatedto Healthcare Solutions. We project gross profit per adjusted claim of 3.71, up 0.45 yr/yr and EBITDAper adjusted claim of 2.05, up 0.18.5
6Catamaran Corporation(in millions, except per share data)2014AFY Dec 31:RevenueC ost of revenueGross 2016E1Q2Q2016E3Q4QYear 4,914.5 5,385.8 5,541.7 5,739.9 21,581.9 5,979.3 6,082.7 6,123.8 6,314.3 24,500.1 6,403.5 6,330.0 6,370.0 6,663.3 46,202.324,059.1 314.7 329.8 351.5 364.0 1,360.1 378.8 384.3 400.8 443.1 1,607.0 408.0 413.1 425.6 461.0 1,707.7649.3Operating ExpensesSelling, general and 953.1214.352.652.051.551.0207.1Total operating expenses 197.9 194.7 203.6 194.9 791.1 219.8 231.2 226.8 225.3 903.1 233.5 225.0 227.2 239.5 925.2Operating income 116.8 135.1 148.0 169.1 569.0 159.0 153.1 174.1 217.9 703.9 174.5 188.2 198.4 221.5 782.6Less: Amount attributable to non-controlling interestAdd back: D&AEBITDAInterest and other (expense), netOther one-time (charges)/gainsIncome before income taxes(14.3)(15.6)(15.0)(13.9)68.369.072.766.6 170.9 188.5 205.7 .570.9 786.9 215.0 212.4 232.7 .0)(11.6)(13.0)283.970.570.269.869.5280.0 935.8 234.9 247.4 256.7 278.0 ------------ 105.5 119.5 130.1 152.9 507.9 143.5 137.4 158.9 203.1 642.9 159.2 172.5 182.5 205.2 719.5(28.1)(33.2)(33.8)77.386.296.3Net (loss) for non-controlling interest(12.9)-Provisions for income taxesNet income after extra. gain(13.4)-Net earnings (loss) before extra.Extraordinary .456.412.912.912.912.951.510.111.011.613.045.7Net income attributable to C TRX 63.4 71.4 82.0 100.4 317.3 86.7 83.3 98.3 129.3 397.6 101.3 109.8 116.2 130.6 457.9Weighted avg. 9208.6209.1209.3209.5209.7209.4 0.50 0.54 0.58 0.67 2.28 0.59 0.58 0.65 0.80 2.62 0.66 0.70 0.73 0.79 2.88Adjusted EPS - cont opsYr/Yr C hange10.0%10.9%17.8%14.2%18.0%EPS - cont ops 0.31 0.34 0.39 0.48 1.53 0.42EPS - gaap (incl all one time g/l) 0.31 0.34 0.39 0.48 1.53100.0101.2101.0101.985.086.086.087.0Gross profit per adj claim 3.15 3.26 3.48EBITDA per adj claim 1.71 1.86Effective tax rate26.7%27.8%Gross profit6.4%Operating 4%-0.5% 0.40 0.47 0.62 1.91 0.48 0.52 0.55 0.62 2.199.7% 0.42 0.40 0.47 0.62 1.91 0.48 0.52 0.55 0.62 8.0 3.57 3.37 3.69 3.71 3.81 3.99 3.80 3.79 3.87 3.95 4.08 3.92 2.04 2.18 1.95 2.09 2.05 2.21 2.48 2.21 2.18 2.32 2.38 2.46 %3.6%3.5%3.8%4.4%3.8%3.7%3.9%4.0%4.2%3.9%Operating 3.0%3.1%3.3%3.0%Net .7%12.9%10.5%10.0%13.5%7.1%4.1%4.0%5.5%5.2%Total operating .6%14.2%6.2%-2.7%0.2%6.3%2.4%Operating .8%8.7%Net %20.2%11.9%25.6%14.9%1.0%12.1%Operating StatisticsAdjusted claim volumeGeneric dispensing rateMargin AnalysisYr/Yr ChangeSource: Wells Fargo Securities, LLC estimates and company reportsWELLS FARGO SECURITIES, LLCEQUITY RESEARCH DEPARTMENT18.9%Managed Care/Ancillary BenefitsExhibit 8. Catamaran Quarterly Income Statement
WELLS FARGO SECURITIES, LLCEQUITY RESEARCH DEPARTMENTPBM: Changing Landscape The Focus For Q2CVS Health (CVS)Exhibit 9. Quarterly Operating Metricsin millions, unless otherwise noted1Q14AConsolidated StatisticsRevenueGross ProfitEBITDA2Q14A3Q14A4Q14A1Q15A2Q15E 32,689 34,602 35,021 37,055 36,332 37,402 5,942 6,324 6,468 6,633 6,164 6,369 2,501 2,696 2,723 2,810 2,622 2,727Gross profit marginEBITDA %17.0%7.3%Adjusted EPS ( ) 1.02 1.13 1.15 1.21 1.14 1.20Pharmacy ServicesAdjusted prescription claimsGeneric dispensing 3.5%288.483.8%Gross profit per adjusted RxEBITDA per adjusted Rx 3.54 3.02 4.46 3.86 5.24 4.64 4.40 3.80 3.56 3.11 4.22 3.82Retail PharmacyAdj. Retail prescriptions filledRetail Generic Dispensing 4.4%242.584.8%Same Store Sales - PharmacySame Store Sales - Front NANAGross marginOperating profit 10.2%31.0%9.6%1Q15AQtr/QtrYr/Yr-2.0%-7.1%-6.7%(90) bps(40) bps-5.7%2.2%140 bps( 0.83)( 0.69)-1.4%200 bpsNANA(20) bps10 bps11.1%3.7%4.8%(120) bps(50) bps12.7%9.1%150 bps 0.02 0.096.3%150 bpsNANA(30) bps(40) bps2Q15EQtr/QtrYr/Yr2.9%3.3%4.0%0 bps10 bps8.1%0.7%1.1%(130) bps(50) bps4.8%6.1%0.2%30 bps7.5%140 bps 0.65 0.710.5%40 bpsNANA(20) bps(60) bps( 0.24)( 0.04)5.3%130 bpsNANA(40) bps(50) bpsSource: Company reports and Wells Fargo Securities, LLC estimates CVS Health plans to release Q2 earnings on August 4. We estimate adjusted EPS (excluding intangibleasset amortization) of 1.20 in Q2, which is in line with the consensus and is at the high end of CVSguidance of 1.17-1.20. For FY 2015, we estimate adjusted EPS of 5.18 versus the consensus of 5.17. Onthe Q1 call, CVS improved the low end of its FY 2015 adjusted EPS guidance by 0.03 to a new range of 5.08-5.19 versus 5.05-5.19 previously, mostly to reflect stronger performance in the Pharmacy Services(PBM) segment. FY 2015 GAAP EPS was projected to be 4.80-4.91. However, CVS has not formallyupdated its earnings guidance following the recently announced plans to acquire Omnicare and Target’sretail pharmacies and health clinics. Our FY 2015 EPS estimate does not include the anticipated dilutionof 0.08 from Omnicare ( 0.04 in interest costs and 0.04 in transaction costs, according to CVS,assuming the transaction closes by the end of the year) as well as the 0.01 impact from lower thanpreviously anticipated share repurchases related to the Target transaction. For Q2, we project operating profit in the PBM segment to rise about 7% yr/yr reflecting solid revenuegrowth of 13%, but continued margin compression. Revenue growth should benefit from new businesswins ( 4.1 billion net for 2015) and higher specialty pharmacy revenues. However, operating profit marginwill likely compress further (down 20 bps yr/yr) due to higher mix of specialty and government business.We project the GDR to rise yr/yr to 83.8%, although the mail order penetration rate will likely continue todecline as Medicare/Medicaid plans tend to have lower mail order penetration rates and 90-day at retailscripts rise further. We project EBITDA/adjusted claim to decline 0.04 yr/yr to 3.82, but to rise 0.71sequentially from a typically weak Q1 due to the seasonal Part D business. For the retail pharmacy, weproject operating earnings to decline about 4% yr/yr, despite revenue growing 1-2%, as the margin willlikely compress by an estimated 50 bps. The tobacco exit and Specialty Connect implementation (whichtransfers scripts from the retail pharmacy to the PBM) will likely continue to dampen SSS (same storesales) growth in Q2 although the negative impact from Specialty Connect should be much lower than the190 bps impact in Q1 2015 and 130 bps in Q2 2014 as it was implemented in Q2 2014. The tobacco exitnegatively impacted front-end SSS by 800 bps in Q1 and a similar impact is likely in Q2. In light of thesepressures, CVS projects SSS of down 1.25% to up 0.25% in Q2 despite same store adjusted scripts growthof 4.25-5.25%. Lastly, share buybacks should continue to benefit EPS as CVS expects to repurchase about 5 billion in shares in 2015 – down from prior guidance of 6 billion, but up from 4 billion in 2014. The primary focus for investors on the Q2 earnings call will likely be on the progress of CVS’ two recentlyannounced acquisitions, as well as additional commentary on the strategic rationales, anticipated growthof the combined entity, and longer-term competitive positioning. On May 21, CVS announced plans toacquire Omnicare, a leading provider of pharmacy services to long-term care facilities, for 98.00 perOCR share in a cash deal valued at 12.7 billion, including the assumption of 2.3 billion in debt. Thetransaction is expected to close near the end of 2015, and be roughly 0.20 accretive to adjusted EPS in2016 (excluding integration costs), increasing to more than 0.30 in 2017 (but 0.08 dilutive in 2015 asnoted earlier). On June 15, CVS announced plans to acquire Target’s retail pharmacies and clinics for 1.9billion. The transaction is also expected to close near the end of 2015, and is projected to be 0.06 dilutive7
Managed Care/Ancillary BenefitsWELLS FARGO SECURITIES, LLCEQUITY RESEARCH DEPARTMENTto adjusted EPS in 2016 (including financing costs of 0.05 and impact of lower 2015 share repurchases of 0.04, but excluding integration and any transaction/one-time costs), and about 0.10 accretive in 2017and at least 0.12 accretive in 2018 and beyond. 8Aside from the transactions, we believe specialty should remain a key topic of interest to investors, andCVS will likely continue to highlight growth opportunities, including its exclusive specialty and advancedformulary strategies. Other topics of interest include: update on the 2015/16 PBM selling season; updateon CVS’ partnership with Aetna including the anticipated transition of the Coventry business to CVS fromExpress in 2016/17 (Medicare 1/1/16; and Medicaid/commercial 1/1/17) as well as Aetna’s recentlyannounced plans to acquire Humana (which currently has its own in-house PBM); impacts from itstobacco exit and CVS’ efforts to fill the void with healthy food options; potential impacts frompublic/private exchanges; changes to the competitive landscape given the change in management team atWalgreens and the recently announced mergers and related M&A speculation in the managed care space;and additional capital deployment opportunities.
9Exhibit 10. CVS Health Quarterly Income Statement2014A2014A2015E3QA4QANet revenues 32,689 34,602 35,021 37,055 139,367 36,332 37,402 36,949 38,903 149,586 39,611 39,430 38,528 40,866 216,5916,7766,7817,55627,704Operating expensesOperating profitInterest expense, netOne-time chargesIncome before taxesIncome tax provisionIncome from continuing operationsLoss from discontinued operations, net of taxes2Q3Q4QYear1Q2Q2016E2QAC ost of revenues1QA2016E1QAGross profitYear2015EFY Dec 074,36316,6424,2344,2304,2004,59417,258 2,024 2,208 2,246 2,321 8,799 2,132 2,229 2,434 2,784 9,579 2,357 2,546 2,581 2,962 46248683,0337778259051,0433,5508729459591,1083,884 1,129 1,246 948 1,322 4,645 1,221 1,269 1,392 1,603 5,485 1,346 1,460 1,481 1,711 91,3921,6035,4851,3461,4601,4811,7115,999Net loss attributable to noncontrolling interest000000000000000Preferred dividends000000000000000 1,129 1,246 948 1,321 4,644 1,221 1,269 1,392 1,603 5,485 1,346 1,460 1,481 1,711 1,1201,0941,0841,0741,0641,079Net incomeNet income attributable to C VSWeighted average sharesAdjusted EPS(1)(1) 1.02 1.13 1.15 1.21 4.50 1.14 1.20 1.32 1.52 5.18 1.30 1.42 1.45 1.68 5.85EPS - C ontinuing Operations 0.95 1.06 0.81 1.14 3.96 1.07 1.13 1.25 1.45 4.90 1.23 1.35 1.38 1.61 5.56EPS - GAAP 0.95 1.06 0.81 1.14 3.96 1.07 1.13 1.25
Formulary exclusions are a key . to migrate to CVS in 2016/17) could perhaps shift to Humana’s internal PBM sooner. Conversely, we believe Medicare Advantage plans prefer to maintain much of the PBM contact with subscribers and believe Humana’s Walmart cobranded Part D product would also be problema
