Transcription
CalSTA Report of FindingsAB 2363Zero Traffic Fatalities Task ForceJanuary 2020
AB 2363 Zero Traffic Fatalities Task ForceCalSTA Report of FindingsTable of Contents1.02.0Executive Summary . 1Introduction and Background . 32.1. Traffic Fatalities and Injuries, Speed, and Safety . 32.2. Trends, Context, and Considerations . 62.3. The 85th Percentile Speed – An Overview . 72.4. AB 2363 – Zero Traffic Fatalities Task Force . 82.5. Zero Traffic Fatalities Task Force and Advisory Group Members . 92.6. Report of Findings – Approach and Timeline . 103.0 Establishing and Adjusting Speed Limits in California . 133.1. Authority to Establish Speed Limits . 133.2. Types of Speed Limits . 133.3. Establishing and Deviating from Speed Limits . 143.4. Engineering and Traffic Surveys – An Overview . 183.5. Adjusting Speed Limits from the 85th Percentile Speed. 204.0 The 85th Percentile Speed Methodology – An Analysis . 234.1. History, Evolution, and Limitations of the Idea. 234.2. Using the 85th Percentile in Urban and Rural Settings. 244.3. Effect of Bicycle and Pedestrian Plans on the 85th Percentile . 255.0 Alternatives to the 85th Percentile – Local, State, National, and International Trends inSetting Speed Limits . 275.1. Summary. 275.2. International Trends . 285.3. Recent National Trends . 305.4. Conclusion: Shifting Paradigms . 326.0 Engineering and Designing for Safety – Roads and Vehicles . 336.1. Engineering Countermeasures . 336.2. Emerging Vehicle Technologies . 407.0 Speed Enforcement . 437.1. Overview of Speed Enforcement . 437.2. Automated Speed Enforcement. 447.3. High Visibility Enforcement . 478.0 Additional Steps to Improve Safety. 498.1. Improving Education through Funding Allocations . 498.2. Improving Safety Data . 508.3. Linking Crash and Medical Data . 519.0 Findings and Recommendations for Policy Consideration . 539.1. Establishing Speed Limits (S) – Findings and Recommendations for PolicyConsideration. 549.2. Engineering (EN) – Findings and Recommendations for Policy Consideration. 609.4. Education (ED) – Findings and Recommendations for Policy Consideration. 6610.0 Appendices . 67A. AB 2363 – Zero Traffic Fatalities Task Force . 67B. University of California, Institute of Transportation Studies, Research Synthesis. 68C. List of Abbreviations . 69i
AB 2363 Zero Traffic Fatalities Task ForceCalSTA Report of FindingsThis page intentionally blankii
AB 2363 Zero Traffic Fatalities Task ForceCalSTA Report of Findings1.0 Executive SummaryWhile the overarching objective of the transportation system is to provide mobility,transportation professionals dedicate significant resources to create a system that issafe for all users. Yet transportation professionals and policy makers continue to grapplewith increases in road traffic fatalities, injuries, and crashes at the local, state, national,and even global levels.Today, the traditional notion that roads should be designed to maximize vehiclethroughput is increasingly challenged as cities and counties rethink the function andpurpose of their streets, the different needs of road users such as bicyclists, pedestrians,and scooter users, and the exponential dangers of excessive speed. There is clearevidence, supported by statistical analyses, that traffic fatalities and serious injuriesincrease with individual vehicle speed.While roadway safety has long been the primary consideration in establishing speedlimits, speeding-related fatalities continue to represent a large portion of California’s totaltraffic fatalities. Current procedures for setting speeds limits in California rely on the 85thpercentile methodology, an approach developed decades ago for vehicles primarily onrural roads. Although California has become highly urbanized and its roadways havechanged significantly, reflecting different modes of transportation including bicycling,walking, and scooters, the method for setting speed limits has not been modified toreflect these changes. And while the current methodology allows traffic engineers toconsider other factors when setting speed limits, the 85th percentile speed remains theprimary factor used in determining posted speed limits regardless of the intended use ofthe street.While the way that speed limits are calculated have remained essentially static, thepopulation, vehicles, and street uses have evolved over time. CalSTA’s vision is totransform the lives of all Californians through a safe, accessible, low-carbon, 21stcentury multimodal transportation system. However, the 85th percentile methodologyrelies on driver behavior. Greater flexibility in establishing speed limits would offeragencies an expanded toolbox in order to better combat rising traffic fatalities andinjuries especially for the most vulnerable roadway users.Consistent with international trends, other U.S. states, including Oregon, Washington,and New York, are enabling their cities to lower their speed limits and are exploringalternative methods to establish speed limits based on safety goals and local contextinstead of the 85th percentile speed. California has the opportunity to evaluate how itsets speed limits and explore new approaches that prioritize safety and meet the needsof all road users. It also has the opportunity to offer agencies greater flexibility toestablish lower speed limits through the revision of speed-limit-setting procedures andthe expansion of special low-speed zones.Additionally, the State can support other strategies to make its roadways safer andreduce traffic fatalities to zero. These interventions include roadway infrastructurechanges through engineering, enhancing traffic safety enforcement, supporting publiceducation and traffic safety campaigns as well as practitioner-focused education, andimproving safety data to make better-informed policy and program decisions.1
AB 2363 Zero Traffic Fatalities Task ForceCalSTA Report of FindingsPursuant to AB 2363, Zero Traffic Fatalities Task Force, CalSTA convened a statewideTask Force and conducted an academic research synthesis to identify findings andrecommendations for policy consideration to reduce traffic fatalities to zero. This Reportof Findings reflects the culmination of activities that CalSTA initiated in March 2019. Thefindings and recommendations for policy consideration begin on page 53.Exhibit 1-1 cross-references the topics mandated by AB 2363 with the pertinentsections of this document.Exhibit 1-1 – Crosswalk: AB 2363 Topics and Report of FindingsAB 2363 Topic1) The existing process for establishing speed limits, including adetailed discussion on where speed limits are allowed todeviate from the 85th percentile.Report Sections3.02) Existing policies on how to reduce speeds on local streets androads.3.3., 3.4, 5.0, 6.1, 7.03) A recommendation as to whether an alternative to the use ofthe 85th percentile as a method for determining speed limitsshould be considered, and if so, what alternatives should belooked at.5.0, 9.04) Engineering recommendations on how to increase vehicular,pedestrian, and bicycle safety.6.0, 9.05) Additional steps that can be taken to eliminate vehicular,pedestrian, and bicycle fatalities on the road.7.0, 8.0, 9.06) Existing reports and analyses on calculating the 85thpercentile at the local, state, national, and international levels.4.07) Usage of the 85th percentile in urban and rural settings.4.28) How local bicycle and pedestrian plans affect the 85thpercentile.4.32
AB 2363 Zero Traffic Fatalities Task ForceCalSTA Report of Findings2.0 Introduction and Background2.1. Traffic Fatalities and Injuries, Speed, and SafetyWhile the overarching objective of the transportation system is to provide mobility,transportation professionals dedicate significant resources to create a system that issafe for all users. Yet transportation professionals and policy makers continue to grapplewith increases in road traffic fatalities, injuries, and crashes at the local, state, national,and even global levels. According to the World Health Organization, deaths from roadtraffic crashes have continued to climb, reaching 1.35 million in 2016, and representingthe eighth leading cause of death globally.1Within the U.S. in 2017, there were 37,133 people killed in motor vehicle traffic crashes.Additionally, in the same year 2,746,000 people were injured.2 Traffic crashes haveeconomic costs as well, which was estimated at 242 billion nationally.3 In California,nearly 3,600 people die each year in traffic crashes and more than 13,000 people areseverely injured.4 Collectively, these traffic crashes cost California over 53.5 billion.5Many factors contribute to traffic fatalities and injuries, including speeding, distracteddriving, and impaired driving. However, the relationship between speeding and trafficfatalities and injuries is an increasing subject of attention. Of the 37,133 traffic fatalitiesin 2017, 9,717 (26%) were involved in crashes where at least one driver was speeding.Nationwide, speeding contributes to approximately one-third of all motor vehiclefatalities. 6 It is important to note that the notation of “speeding” for the purpose of crashreporting includes vehicle speeds that are unsafe for conditions as well as in excess ofthe speed limit; see Section 8.2 for more information.Recent important studies have highlighted excessive speed as a key risk factor in roadtraffic injuries and fatalities. According to a 2017 National Transportation Safety Board(NTSB) report, speed increases crash risk in two ways: it increases the likelihood ofbeing involved in a crash and it increases the severity of injuries sustained by all roadusers in a crash.7 While the relationship between speed and crash involvement iscomplex, the relationship between speed and injury severity is consistent and direct.8There is clear and convincing evidence, supported by statistical analyses, that crashseverity increases with individual vehicle speed.91World Health Organization, Global Status Report on Road Safety 2018 (2018), vii.National Highway Traffic Safety Administration (NHTSA), Summary of Motor Vehicle Crashes 2017 Data(2019), 1.3Ibid., 5.4California Office of Traffic Safety, California Highway Safety Plan (2019), 5.5This estimate was calculated by the University of California, Institute for Transportation Studies usingStrategic Highway Safety Plan data and the National Safety Council’s Guide to Calculating Costs ofMotor-Vehicle Injuries.6National Highway Traffic Safety Administration (NHTSA), Summary of Motor Vehicle Crashes, 7.7National Transportation Safety Board (NTSB), Safety Study: Reducing Speed-Relating CrashesInvolving Passenger Vehicles (2017), ix.8Ibid.,12.9Federal Highway Administration (FHWA), Speed Concepts: Informational Guide (2009), 8.23
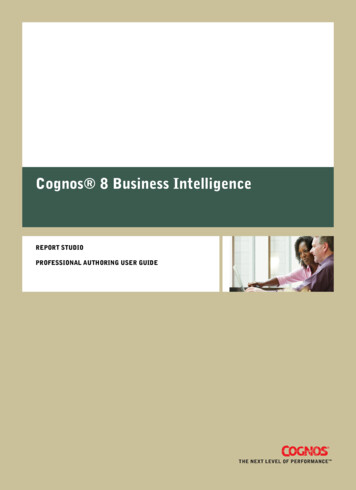
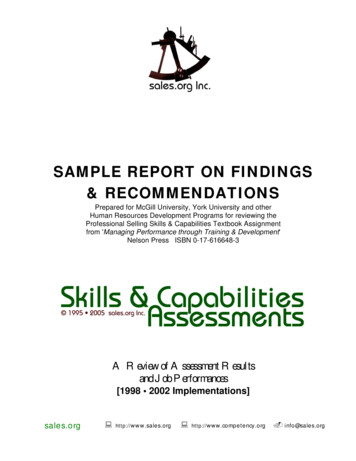
AB 2363 Zero Traffic Fatalities Task ForceCalSTA Report of FindingsThe relationship between speed and injury severity is especially critical for vulnerableroad users such as bicyclists and pedestrians. In the U.S., on average, a pedestrian iskilled in a motor vehicle crash every 88 minutes.10 In the event of a crash between avehicle and a pedestrian or bicyclist, the vehicle's speed will largely determine whetherthe person hit will survive. Exhibit 2-1 depicts this relationship, demonstrating that thefaster a vehicle is traveling, the less likely it is that the person will survive.Exhibit 2-1 – Relationship between Vehicle Speed, Crashes, and Fatalities11For the purposes of crash reporting, “speeding” is used to identify vehicles that aretraveling at speeds which are: 1) unsafe for conditions or 2) exceed the speed limit.Speeds that are unsafe for conditions are based on basic speed law which is defined asdriving at a speed greater than is reasonable or prudent considering weather, visibility,traffic, and roadway conditions. Because the definition of speeding includes these twodifferent conditions, it is unknown to what degree exceeding a posted or statutory speedlimit contributes to the total number of speeding-related crashes.In addition to the impact of absolute vehicle speed on both crash severity and crashfrequency, speed variance within a traffic flow is often cited as contributing to crash risk.However, the University of California Institute of Transportation Studies (UC ITS)Research Synthesis commissioned specifically for this report found that research onspeed variation and safety is limited and generally inconclusive. Furthermore, there is anabsence of research related to speed variation impacts on crash frequency or severity ofcollisions involving pedestrians and bicyclists in urban environments.10NHTSA, Summary of Motor Vehicle Crashes 2017 Data (2017), 1.Tefft, B.C. “Impact speed and a pedestrian’s risk of severe injury or death,” Accident Analysis &Prevention 50 (2013), 871-878.114
AB 2363 Zero Traffic Fatalities Task ForceCalSTA Report of FindingsGiven the rise in traffic fatalities and injuries, the contributing role of excessive speed tothose crashes, and the particular vulnerability of pedestrians, bicyclists, and scooterusers, transportation professionals and policymakers in the U.S. are struggling to findsolutions to make roadways safer. The issue of speed limits and speed management isan increasingly important topic among stakeholders as speeding has been repeatedlydemonstrated to be a main factor in crash injury and severity.Speeding, however, is a multi-faceted problem. There are many factors that caninfluence how fast drivers choose to operate their vehicles. These include the design ofthe roadway, the road’s posted speed limit, the enforcement of speed limits, and thedriver’s behavior. In their efforts to get drivers to slow down, practitioners use multipletools, including lowering speed limits, increasing enforcement, and changing theroadway infrastructure. Ultimately “any measures that can achieve reductions in averageoperating speeds, including lower speed limits, enhanced enforcement, andcommunications campaigns, as well as engineering measures, are expected to reducefatal and injury crashes.”12While many consider road design and engineering the effective countermeasure toreduce operating speed, many cities, including Portland, Seattle, and New York City,have also lowered the posted speed limits on their roadways. Although some subjectmatter experts maintain that lowering posted speed limits does not cause drivers to slowdown, recent research has indicated that this approach is effective. The UC ITSresearch synthesis found that research studies clearly indicate speed limit changescause changes in drivers’ speed. Moreover, “reducing vehicle speed limits will likelyreduce vehicle speeds and improve safety across most road environments.”13 UC ITSconcluded that “even though reducing speed limits may only have a small effect onvehicle speeds, those changes in speed result in meaningful safety improvements”especially for vulnerable road users such as bicyclist and pedestrians.”14Other studies support the finding that even a small change in vehicle operating speedcan have large safety impacts. According to one, “a reduction of 3 mph in averageoperating speed on a road with a baseline average operating speed of 30 mph isexpected to produce a reduction of 27% in injury crashes and 49% in fatal crashes.”15Furthermore, since pedestrians and bicyclists are particularly vulnerable to severe injuryand death when struck by higher-speed vehicles, “countermeasures aimed at reducingvehicle speeds have the potential to save lives.”16 National research results, as well asthe results of the UC ITS research synthesis, support the notion, which is advocated bymany California cities and local governments, that lowering speed limits will makestreets safer.In California and the rest of the U.S., establishing the speed limit is based on a longstanding methodology known as the 85th percentile speed. This methodology isdiscussed in Section 3.0 of this report. However, it is important to note that studies haveshown that using the 85th percentile speed to establish speed limits has actually12NHTSA, Countermeasures that Work: A Highway Safety Countermeasure Guide for State HighwaySafety Offices Ninth Edition (2017), 3-7.13University of California Institute of Transportation Studies (UC ITS), Research Synthesis for AB 2363Zero Traffic Fatalities Task Force (2019), 23.14Ibid., 23.15NHTSA, Countermeasures that Work, 3-7.16Ibid., 8-7.5
AB 2363 Zero Traffic Fatalities Task ForceCalSTA Report of Findingsincreased drivers’ operating speeds as an “unintended consequence.”17 This approachcreates a phenomenon known as “speed creep,” in which higher speed limits promptmotorists to drive faster, which in turn prompt higher speed limits.18While recent research has shown that changing speed limits is an effective method forreducing vehicle operating speeds and increasing road safety, the absolute magnitude ofoperating speed changes from speed limit changes alone are small but meaningful.Further, there are many broader trends and contexts to consider, including the inherenttrade-off between speed and safety, the safety advances presented by emerging vehicletechnologies, and recent statewide developments related to safety and transportation.These trends and contexts are discussed in the next section.2.2. Trends, Context, and ConsiderationsHistorically in the U.S., roadways have been designed with vehicles in mind, as typicaldesign standards “tend to look at streets as thoroughfares for traffic and measure theirperformance in terms of speed, delay, throughput and congestion.”19 The field of trafficengineering has traditionally approached road design from the perspective of movingvehicles from one point to another as quickly as possible. As highway networksexpanded to accommodate increasing numbers of vehicles in the first half of the 20thcentury, early attempts to regulate speed for safety gave way to the “consistent focus onimproving traffic service for ever-expanding motor vehicle fleets.”20 According to theFHWA, “the automobile has irrefutably altered the way in which transportation systemsand the built environment are designed and constructed, often at the expense ofpedestrians.”21Today, the traditional notion that roads should be designed to maximize vehiclethroughput is increasingly challenged as cities rethink the function and purpose of theirstreets, the different needs of road users such as bicyclists and pedestrians, and theexponential dangers of excessive speed. Most cities today strive to make their streetsmore complete, less dominated by driving, and safer.22 As NACTO puts it, “roadwaysonce conceived singularly as arterials for traffic have been recast and retrofitted aspublic spaces crucial to the economic success, safety and vitality of the city.”23This trend away from roads designed for vehicle throughput calls attention to thecontradiction between level of service and safety. Cities who wish to increase safety byreducing vehicle operating speeds must often balance these needs with the desires of itscommuters who do not want an increase in traffic congestion and slower vehiclethroughput. As UC ITS researchers put it, the crux of this issue is “the intuitive trade-offbetween speed and safety.”2417NTSB, Reducing Speeding-Related Crashes Involving Passenger Vehicles, 54.Ibid., 54.19National Association of City Transportation Professionals (NACTO), Urban Street Design Guide (2012),6.20UC ITS, Research Synthesis, 36.21NHTSA, How to Develop a Pedestrian Safety Action Plan (2009), 7.22UC ITS, Research Synthesis, 39.23NACTO, Urban Street Design Guide, 4.24UC ITS, Research Synthesis, 45.186
AB 2363 Zero Traffic Fatalities Task ForceCalSTA Report of FindingsIn the last several years, states across the U.S., including Washington and Oregon, areadopting speed-limit-setting laws that grant local agencies more flexibility to lower postedspeeds within their jurisdictions. While these national developments in speed managementare fairly recent, international speed management programs began to develop bestpractices in the mid-1990s that aimed to “minimize the severity of road traffic crashesthrough such programs as Vision Zero, Sustainable Safety, and Safe Systems.”25In addition to the countermeasures designed to improve safety by reducing vehicleoperating speeds, it is important to note that rapidly emerging vehicle technologies willalso likely impact safety. Already a considerable amount of research is beginning todescribe the safety benefits of various levels of emerging technology.26 These vehicletechnologies include forward collision warning (FCW), automatic emergency braking(AEB), lane departure warning (LDW), intelligent speed adaptation (ISA), lane keepingassistance (LKA), and blind spot warning (BSW) systems.Generally, these enhanced safety features are designed to reduce traffic crashes andfatalities and improve safety for both the vehicle occupants and non-occupants. Arecently AAA research synthesis found that while such features have their limitations,“current and future vehicle safety systems have the potential to dramatically reduce thenumber of crashes, injuries and fatalities on our roadways,” and that these systems, “ifinstalled on all vehicles, would have had the potential to help prevent or mitigate roughly40% of all crashes involving passenger vehicles, and 37% of all injuries and 29% of allfatalities that occurred in those crashes.”27 It will be important for transportation andtraffic safety professionals to track the latest vehicle safety technologies as they continueto develop.Within California, it is also critical to consider the work of the Zero Traffic Fatalities TaskForce within the broader context of the California Strategic Highway Safety Plan (SHSP).The SHSP is a coordinated, data-driven safety plan that provides a comprehensiveframework for reducing fatalities and serious injuries on California’s public roads with agoal of zero deaths. A federal requirement, the plan guides investment decisionstowards strategies and countermeasure with the most potential to save lives and preventinjuries. Spearheaded by CalSTA and its departments, over 900 safety stakeholdersfrom across the state contributed to the original SHSP. The 2020-2024 SHSP hasrecently been finalized and the SHSP Implementation Plan, which identifies specificactions, is currently underway.2.3. The 85th Percentile Speed – An Overview28Drivers play an important role in how posted speed limits are set. Many U.S. states andCalifornia rely on a long-standing and widespread methodology known as the 85thpercentile speed to establish speed limits. As its name implies, the 85th percentile speedis the velocity at which 85% of vehicles drive at or below on any given road. Thisapproach was developed in the U.S. in the mid-20th century and is still the dominant25Ibid., 50.Ibid., 69.27AAA Foundation for Traffic Safety, Potential Reductions in Crashes, Injuries, and Deaths from LargeScale Deployment of Advanced Driver Assistance Systems Research Brief (2018), 9.28This summary is drawn from numerous sources including: UC ITS’s Research Synthesis (2019);FHWA’s Speed Concepts: Informational Guide (2009); FHWA’s Methods and Practices for Setting SpeedLimits (2012); and California Department of Transportation’s (Caltrans) California Manual for SettingSpeed Limits (2014).267
AB 2363 Zero Traffic Fatalities Task ForceCalSTA Report of Findingsfactor in how speed limits are set in the U.S today. The 85th percentile methodologyassumes that most drivers will drive at a safe and reasonable speed based on the roadconditions. It is also based on the idea that speed limits are safest when they conform tothe natural speed driven by most drivers and that uniform vehicle speeds increase safetyand reduce the risks for crashes.Using the 85th percentile methodology to establish a posted speed limit is a two-stepprocess. First, traffic engineers calculate the 85th percentile speed for a given roadwayby conducting an engineering and traffic survey, also known as a speed or traffic survey.Engineers select a roadway and measure the speed of free-flowing traffic with radar orlidar guns. The survey results are then analyzed, yielding the speed at which 85% of thedrivers are traveling at or below.However, the 85th percentile speed does not automatically become the speed limit that isposted for that road. In the second step, engineers can apply rounding and adjustmentallowances based on a variety of other conditions, resulting in a speed limit that deviatesfrom the 85th percentile speed. California law places parameters and limits on thesedeviations. When using engineering and traffic surveys to post lower speed limits, themaximum amount that a posted speed limit can deviate from the 85th percentile speed is7 mph. Ultimately, the speed at which 85% of road users drive at or below exercises aprofound influence on the final speed limit that is posted for the road. UC ITS refers tothis reliance on driver behavior as “crowdsourcing” speed limits.29Section 4.0 contains a detailed analysis of the 85th percentile speed methodologyincluding its history, limitations, and usage in urban and rural settings.2.4. AB 2363 – Zero Traffic Fatalities Task ForceAB 2363 (Friedman – Chapter 650, Statutes of 2018) directed the Secretary ofTransportation to establish and convene the Zero Traffic Fatalities Task Force. Based onthe Task Force’s efforts, the Secretary shall prepare and submit a report of findings tothe Legislature by January 1, 2020 on the following issues:1) The existing process for establishing speed limits, including a detailed discussionon where speed limits are allowed to deviate from the 85th percentile.2) Existing policies on how to reduce speeds on local streets and roads.3) A recommendation as to whether an alternative to the use of the 85th percentileas a method for determining speed limits should be considered, and if so, whatalternatives should be looked at.4) Engineering recommendations on how to increase vehicular, pedestrian, andbicycle safety.5) Additional steps that can be taken to eliminate vehicular, pedestrian, and bicyclefatalities on the road.6) Existing reports and analyses on calculating the 85th percentile at the local, state,national, and international levels.7) Usage of the 85th percentile in urban and rural settings.8) How local bicycle and pedestrian plans affect the 85th percentile.29UC ITS, Research Synthesis, 27.8
AB 2363 Zero Traffic Fatalities Task ForceCalSTA Report of Findings2.5. Zero Traffic Fatalities Task Force and Advisory Group MembersCalSTA established and first convened the Task Force on June 25, 2019, whichincluded representatives from all of the mandated organizations as well as otherinterested stakeholders. A list of Task Force members and their organization ispresented in Exhibit 2-2. In addition, CalSTA formed an Advisory Group designed toprovide subject matter expertise to the Task Force. A list of Advisory Group membersand their organization is presented in
Zero Traffic Fatalities Task Force and Advisory Group Members . 9 2.6. Report of Findings – Approach and Timeline . limits, speeding-related fatalities continue to represent a large portion of Califo


![VWHPV 0RGHUQL]DWLRQ 3URMHFW 56 VHFWLRQ KWWS](/img/7/hi-dhs-ivv-monthly-status-rpt-february-2019-final.jpg)