Transcription
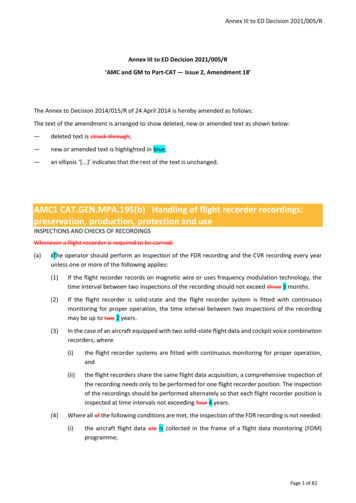
Marine Protected Area (MPA) WatchRegional ReportMendocino, Sonoma, Marin, San Francisco, and San Mateo CountiesJanuary 1, 2020 – June 30, arallones.org/
MPA Watch is a statewide collaborative effort to collect critical human use data toenhance the management and conservation of marine protected areas (MPAs). MPAWatch data informs the management, enforcement, and science of California's MPAsand allows us insight on how human uses are changing as a result of MPAimplementation. By involving local communities in this important work, MPA Watchprograms inspire and empower stewardship, and educate California communities aboutocean ecosystems. MPA Watch trains volunteers to observe and collect unbiased dataon coastal and marine resource use. The North-central Coast Marine Protected Area(MPA) Watch Program, organized by Greater Farallones Association’s Beach Watchprogram, engages 150 community scientists in 10 MPAs, spanning 5 counties.Summary: Following local, state, and federal health guidelines regarding COVID-19, GFA’s MPAWatch program suspended normal data collection from March 17, 2020. Staff resumedlimited surveys May 22, 2020. And current volunteers would could maintain socialdistancing resumed data collection on July 25, 2020. In-person trainings for newvolunteers are suspended to adhere to physical distancing guidelines. Beach closures varied between our 5 counties, however most beaches remained closed toall human uses until late May. Very low activity numbers and rates are due to limitednumber of surveys, and that the surveys represented here were primarily from late winterand during initial COVID-19 concerns. The larger number of surveys conducted in July, though not represented here, show anextraordinary increase in visitor used along coastal beaches and nearshore waters.North Central California MPA Watch ReportJanuary 1, 2020 – June 30, 2020Page 2
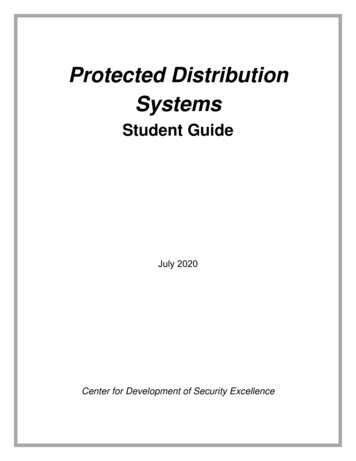
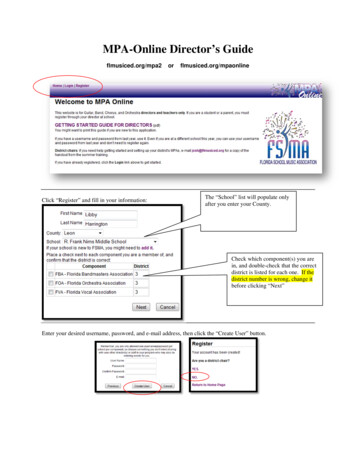
Human Use of MPAs January - June 2020OverviewMPAs by All Activity MPAs by Activity CountJanuary 1, 2020 - June 30, 2020413 EventsMontara SMR- 193 (47%)Año Nuevo SMCA - 79 (19%)Point Reyes SMR - 54 (13%)Bodega Head SMR - 39 (9%)Russian River SMCA - 14 (3%)Del Mar Landing SMR - 9 (2%)Russian River SMRMA- 9 (2%)Sea Lion Cove SMCA - 8 (2%)Estero de Limantour SMR - 7 (2%)Stewarts Poi nt SMR - 1 ( 1%)North Central California MPA Watch ReportJanuary 1, 2020 – June 30, 2020Page 3
Activity by MPAActivity ClassificationsOn-Shore - Activities that take place on a sandy or rocky beach. Excludes bluffs, trails, sea walls,parking lots, or other man-made structures. Includes recreation, tidepooling, shore-based fishing, etc.Off-Shore - Activities that take place offshore, typically in knee-deep water or deeper. Includes surfing, SCUBAdiving, kayaking, boat fishing, etc.Consumptive - An activity in which a natural resource (i.e. fish, kelp, shells) is being collected.Non-Consumptive - An activity in which a natural resource is not collected.North Central California MPA Watch ReportJanuary 1, 2020 – June 30, 2020Page 4
North Central California MPA Watch ReportJanuary 1, 2020 – June 30, 2020Page 5
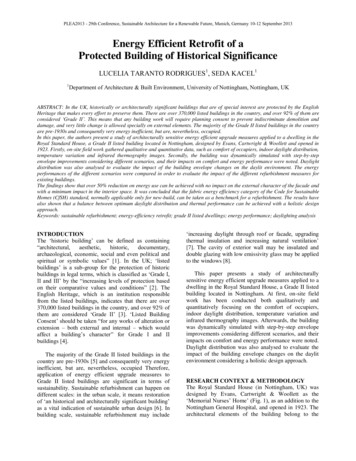
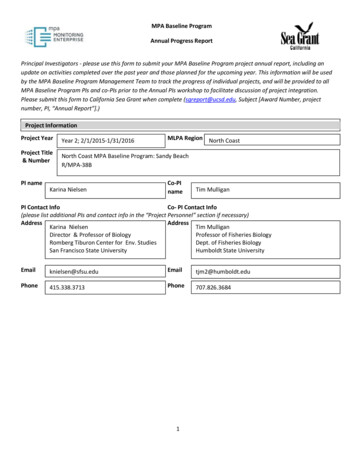
Activity Incidence by MPAThe charts below show incidence values for each MPA monitored by Greater Farallones AssociationBeach Watch program. Incidence is calculated as number of activities recorded divided by totalsurvey-miles.On Shore, Non-ConsumptiveJanuary 1 - June 1, All Years80January 1, 2020- June 1, 20206040200Sea LionDel MarCove SMCA LandingSMRStewarts RussianRussianPoint SMR River SMCA RiverSMRMABodega Estero de Point Reyes Montara Año NuevoHead SMR LimantourSMRSMRSMCASMROn-shore, Consumptive0.50January 1 - June 30, All YearsJanuary 1 - June 30, 20200.400.300.200.100.00Sea Lion Del Mar Stewarts RussianCove SMCA Landing Point SMRRiverSMRSMCANorth Central California MPA Watch ReportJanuary 1, 2020 – June 30, 2020Page 6RussianRiverSMRMABodega Estero dePointMontara Año NuevoHead SMR Limantour Reyes SMRSMRSMCASMR
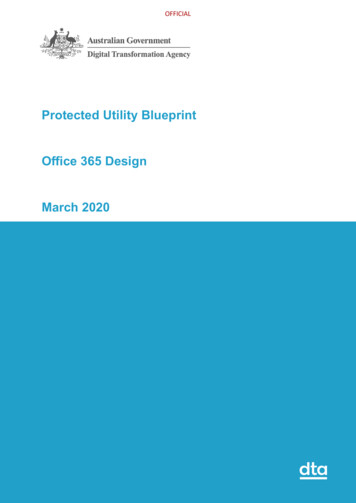
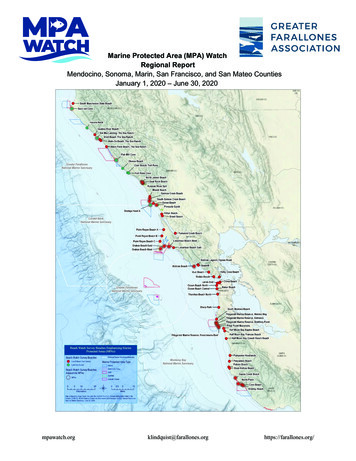
Offshore, Non-ConsumptiveJanuary 1- June 30, All Years6.005.004.003.002.001.000.00Sea LionCoveSMCADel Mar Stewarts RussianLanding Point SMR RiverSMRSMCAJanuary 1 - June 30, All YearsRussian Bodega Estero dePointMontara Año NuevoRiver Head SMR Limantour Reyes SMR SMRSMCASMRMASMROffshore, ConsumptiveJanuary 1 - June 30, All Years1.20January 1, 2020 - June 30, 20200.800.400.00Sea LionCoveSMCADel Mar Stewarts RussianLanding Point SMR RiverSMRSMCARussian Bodega Estero dePointMontara Año NuevoRiver Head SMR Limantour Reyes SMR SMRSMCASMRMASMRActivity Incidence by MPAOn-ShoreNon-ConsumptiveConsumptiveMPAJan 1 Jan 1, 2020Jun 30Jun 30,All Years2020Jan 1 Jan 1, 2020Jun 30Jun 30,All Years2020Sea Lion Cove SMCADel Mar Landing SMRStewarts Point SMRRussian River SMCARussian River SMRMABodega Head SMREstero de Limantour SMRPoint Reyes SMRMontara SMRAño Nuevo .000.000.420.000.000.00All MPAs Combined15.4615.650.040.08North Central California MPA Watch ReportJanuary 1, 2020 – June 30, 2020Page 7
Notes on Calculating IncidenceThe baseline rate for the reporting period was calculated by summing the total use count for each categoryduring the same period from each previous year and dividing this value by the transect miles surveyed ateach site. The miles surveyed were calculated by first identifying the length of each transect for all the MPA’sin question and multiplying the length of the transect by the number of surveys that had been taken alongthat transect during the same time period. For MPA’s with multiple transects, the total distance traveled foreach transect within the MPA were summed together to get the total miles surveyed within that MPA.Off-ShoreNon-ConsumptiveConsumptiveJan 1 Jan 1, 2020Jun 30Jun 30,All Years2020MPAJan 1 Jan 1, 2020Jun 30Jun 30,All Years2020Sea Lion Cove SMCADel Mar Landing SMRStewarts Point SMRRussian River SMCARussian River SMRMABodega Head SMREstero de Limantour SMRPoint Reyes SMRMontara SMRAño Nuevo .211.180.000.00All MPAs Combined0.550.470.060.12TotalCombinedMPAJan 1 Jan 1, 2020Jun 30Jun 30,All Years2020Sea Lion Cove SMCADel Mar Landing SMRStewarts Point SMRRussian River SMCARussian River SMRMABodega Head SMREstero de Limantour SMRPoint Reyes SMRMontara SMRAño Nuevo .504.501.679.3330.008.131.4631.7635.7479.00All MPAs Combined16.1216.32North Central California MPA Watch ReportJanuary 1, 2020 – June 30, 2020Page 8
Impacts of COVID-19Following local, state, and federal health guidelines regarding COVID-19, GFA’s MPAWatch program suspended normal data collection from March 17, 2020. Staff resumedlimited surveys May 22, 2020. And current volunteers would could maintain socialdistancing resumed data collection on July 25, 2020. In-person trainings for newvolunteers are suspended to adhere to physical distancing guidelines.Breakdown by MPASealion Cove State Marine Conservation AreaBetween the months of January and June 2020, GFA’s MPA Watch data suggests arate of 2.5 total uses per mile surveyed in this MPA. This is a decrease from 5.3 thebaseline data rate for these months (2014-2019). People observed in the MPA weresolely taking part in non-consumptive shore-based recreation. This accounted for 100%of the activities logged in the MPA Watch surveys.Del Mar Landing State Marine ReserveBetween the months of January and June 2020, GFA’s MPA Watch data suggests arate of 4.5 total uses per mile surveyed in this MPA. This is a decrease from 7.3 thebaseline data rate for these months (2014-2019). People observed in the MPA weresolely taking part in non-consumptive shore-based recreation. This accounted for 100%of the activities logged in the MPA Watch surveys.Stewarts Point State Marine ReserveBetween the months of January and June 2020, GFA’s MPA Watch data suggests arate of 1.6 total uses per mile surveyed in this MPA. This is a slight decrease from 5.8,the baseline data rate for these months (2014-2019). 100% of people observed in theMPA were taking part in non-consumptive shore-based recreation.Russian River State Marine Conservation AreaBetween the months of January and June 2020, GFA’s MPA Watch data suggests arate of 9.3 total uses per mile surveyed in this MPA. This is a notable decreasecompared to 23.96, the baseline data rate for these months (2014-2019). 100% ofpeople observed in the MPA were taking part in shore-based recreation.Russian River State Marine Recreational Management AreaBetween the months of January and June 2020, GFA’s MPA Watch data suggests arate of 30 total uses per mile surveyed in this MPA. This is a slight decrease from 35.51,the baseline data rate for these months (2014-2019). 100% of people observed in theMPA were taking part in shore-based beach recreation.North Central California MPA Watch ReportJanuary 1, 2020 – June 30, 2020Page 9
Bodega Head State Marine ReserveBetween the months of January and June 2020, GFA’s MPA Watch data suggests arate of 8.13 total uses per mile surveyed in this MPA. This is a notable decrease from15.84, the baseline data rate for these months (2014-2019). People observed in theMPA were solely taking part in non-consumptive shore-based recreation.Estero de Limantour State Marine ReserveBetween the months of January and June 2020, GFA’s MPA Watch data suggests arate of 1.46 total uses per mile surveyed in this MPA. This is a decrease from 3.27 thebaseline data rate for these months (2014-2019). People observed in the MPA wereprimarily taking part in non-consumptive shore-based recreation. This accounted foralmost 57% of the activities logged in the MPA Watch surveys. Consumptive activitiesaccounted form 43% of activities, 29% on shore, and 14% offshore.Point Reyes State Marine ReserveBetween the months of January and June 2020, GFA’s MPA Watch data suggests arate of 31.76 total uses per mile surveyed in this MPA. This is a large increase from12.69 the baseline data rate (2014-2019), which may be an artifact due to severalFederal Park Closures early in 2019. People observed in the MPA were primarily takingpart in non-consumptive activities both on and off-shore, such as beach and oceanrecreation. This accounted for almost 100% of the activities logged in the MPA Watchsurveys. No consumptive activities were observed.Montara State Marine ReserveBetween the months of January and June 2020, GFA’s MPA Watch data suggests arate of 35.74 total uses per mile surveyed in this MPA. This is a decrease compared to43.86 the baseline data rate for these months (2014-2019). People observed in theMPA were primarily taking part in non-consumptive shore-based recreation. Thisaccounted for 100% of the activities logged in the MPA Watch surveys.Año Nuevo State Marine Conservation Area between the months of January andJune 2020, GFA’s MPA Watch data suggests a rate of 7.9 total uses per mile surveyedin this MPA. This similar to 8.13, the baseline rate from these months (2014-2019).People observed in the MPA were primarily taking part in non-consumptive activities onshore, this accounted for 85% of the activities logged in the MPA Watch surveys.However we observed an increase in offshore non-consumptive activities from 1.09 inthe past to 12.00 this year.Next StepsNorth Central California MPA Watch ReportJanuary 1, 2020 – June 30, 2020Page 10
Greater Farallones Association intends to expand the volunteer pool in the Sonoma andMendocino region in 2021. Increasing our knowledge in this remote region strugglingwith severe kelp and abalone declines. MPA Watch intends to collaborate with theCalifornia Department of Fish and Wildlife (CDFW) to distribute MPA Watch reports toregional managers in order to improve the management and enforcement of MPAs.MPA Watch is also looking to expand its network of partner organizations to enhancethe scale and scope of MPA monitoring across California. MPA Watch will be makingour human use data available on our website to make it accessible to partners, resourceagencies, municipalities, and other interested parties. One of the hopes of MPA Watchis that volunteers and community members help spread knowledge and awareness ofMPAs to the communities that surround them, inspiring marine stewardship in ourpopulations.Additional InformationFor additional information on MPA Watch, including survey sites, participatingorganizations, protocols and datasheets, media kit, and how to get involved, pleasevisit mpawatch.org. Connect with MPA Watch on social media @MPAWatchOrg.For additional information regarding MPAs and regulations specific to the variousclassifications of MPAs please visit wildlife.ca.gov/MPAs. If you see an activity thatviolates MPA regulations, please call CalTip to report the violation at (888)-334-2258.For more information about the work the Greater Farallones Association does toconserve California’s Federal and California MPAs and other conservation projectsplease visit farallones.org.North Central California MPA Watch ReportJanuary 1, 2020 – June 30, 2020Page 11
Marine Protected Area (MPA) Watch Regional Report Mendocino, Sonoma, Marin, San Francisco, and San Mateo Counties January 1, 2020 – June 30, 2020 . North Central California MPA Watch Report January 1, 2020 – June 30, 2020 Page 2 MPA Watch is a statewide c