Transcription
Part I: Introductory MaterialsIntroduction to Data MiningDr. Nagiza F. SamatovaDepartment of Computer ScienceNorth Carolina State UniversityandComputer Science and Mathematics DivisionOak Ridge National Laboratory
What is common among all of them?2
Who are the data producers? What data?Application Data Application Category: Finance Producer: Wall Street Data: stocks, stock prices, stock purchases, Application Category: Academia Producer: NCSU Data: students admission data (name, DOB, GREscores, transcripts, GPA, university/schoolattended, recommendation letters, personalstatement, etc.3
Application Categories Finance (e.g., banks)Entertainment (e.g., games)Science (e.g., weather forecasting)Medicine (e.g., disease diagnostics)Cybersecurity (e.g., terrorists, identity theft)Commerce (e.g., e-Commerce) 4
What questions to ask about the data?Data Questions Academia:NCSU:Admission data1.Is there any correlation between the students’ GRE scores andtheir successful completion of a PhD program?2. What are the groups of students that share common academicperformance?3. Are there any admitted students who would stand out as ananomaly? What type of anomaly is that?4. If the student majors in Physics, what other major is he/shelikely double-major?5
Questions by Types? Correlation, similarity, comparison, Association, causality, co-occurrence, Grouping, clustering, Categorization, classification, Frequency or rarity of occurrence, Anomalous or normal objects, events, behaviors,Forecasting: future classes, future activity, 6
What information we need to answer?Questions Data Objects and Object Features Academia:NCSU:Admission data––Objects: StudentsObject’s Features Variables Attributes Dimensions & Types Name:String (e.g., Name Neil Shah) GPA:Numeric (e.g., GPA 5.0) Recommendation:Text (e.g., the top 2% in my career ) Etc.7
How to compare two objects?Data Object Object Pairs Academia:NCSU:Admission data––Objects: StudentsBased on a single feature: Similar GPA The same first letter in the last name– Based on a set of features: Similar academic records (GPA, GRE, etc.) Similar demographic records– Can you compute a numerical value for your similarity measureused for comparison? Why or Why not?8
How to represent data mathematically?Data Object & its Features Data Model What mathematical objects have you ntsVectorsVector spacesMatricesSetsGraphs, networks (maybe)Tensors (maybe)Time series (maybe)Topological manifolds (maybe) 9
Data object as vector with components Vector components: Features, orCity (Latitude, Longitude)--2-dimensional object Attributes, orRaleigh (35.46, 78.39) Boston (42.21, 71.5) DimensionsProximity(Raleigh, Boston) ? Geodesic distance Euclidean distance Length of the interstate route10
A set of data objects as vector spaces3-dimensional vector spaceAltitudeMoscowRaleighLatitudeLongitudeMining such data studying vector spaces11
Multi-dimensional vectors Vector components: Features, or Attributes, or DimensionsStudent (Name, GPA, Weight, Height, Income in K, ) - mutli-dimensionalS1 (John Smith, 5.0, 180, 6.0, 200)S2 (Jane Doe, 3.0, 140, 5.4, 70)Proximity(S1, S2) ? How to compare when vector components areof heterogeneous type, or different scales? How to show the results of the comparison?12
as matrices Example: A collection of text documents on the WebOriginal DocumentsParsed DocumentsD1: Child Safety at HomeD2: Infant & Toddler First AidYour Baby's Health andD3: Safety: From Infant toToddlerD1: Child Safety HomeD2: Infant ToddlerBab Health Safety InfantD3:Toddlert-d term-document matrixTerms Features 1D3:1010111T1:T2:T3:T4:T5:T6:T7:Mining such data studying matricesBabChildHealthHomeInfantSafetyToddler13
or as treest-d term-document umentD3:1010111D2president government partyelection political electednational districts helddistrict independence viceminister partiesIs D2 similar to D3?D3What if there are 10,000 terms?population areaclimate city milesprovince landtopography totalseason 1999square rateMining such data studying treestermseconomy millionproducts 1996growth copraeconomic 1997food scaleexports rice 14fish
0r as networks, or graphs w/ nodes & linkspresident government partyelection political electednational districts helddistrict independence viceminister partiesNodes DocumentsLinks Document similarity (e.g., if documentreferences another document )population areaclimate city milesprovince landtopography totalseason 1999square rateeconomy millionproducts 1996growth copraeconomic 1997food scaleexports rice fishMining such data studying graphs, or graph mining15
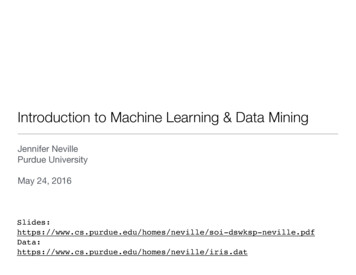
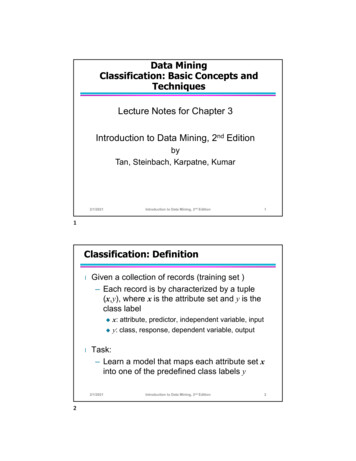
What apps naturally deal w/ graphs?Social NetworksSemantic WebDrug Design,Computer networksChemical compoundsCredit: Images are from Google images via search of keywordsWorld Wide WebSensor networks16
What questions to ask about graph data?Graph Data Graph Mining Questions Academia:NCSU:Admission data1. Nodes students; links similar academics/demographics2. How many distinct academically performing groups of studentsadmitted to NCSU?3. Which academic group is the largest?4. Given a new student applicant, can we predict which academicgroup the student will likely belong to?5. Are groups of student with similar demographics usually sharesimilar academic performance?6. Over the last decade, has the diversity in demographics ofaccepted student groups increased or decreased?7. 17
Recap: Data Mining and Graph MiningApplicationDataQuestionsData Objects FeaturesMathematical Data Representation (Data Model)VectorsGraphsMatricesNot one hat fits allTime seriesSetsTensors More than one modelsare neededManifoldsModels are related18
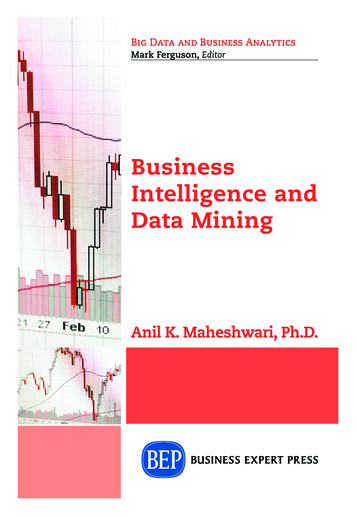
How much dayClimate Astrophysics Cosmology850TBWebMy laptop:60 GB (GigaBytes) – 109 Bytes1 TB (TeraByte) – 1012 Bytes1 PB (PetaByte) – 1015 Bytes19
It is not just the Size– but the ComplexityPetabytes Data20
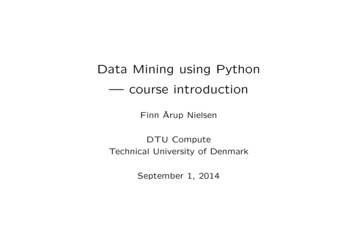
Data Describes Complex Patterns/PhenomenaHow to untangle the riddles of the complexity?Complex regulation Single gene 30k genesAnalytical tools that find the “dots”from data significantly reduce data.50 trans elements control singlegene expressionChallenge:How to “connect the dots” to answerimportant science/business questions?21
Connecting the DotsFinding the DotsSheer Volume of DataClimateNow: 20-40 Terabytes/year5 years: 5-10 Petabytes/yearFusionNow: 100 Megabytes/15 min5 years: 1000 Megabytes/2 minConnecting the DotsAdvanced Math Algorithms Huge dimensional space Combinatorial challenge Complicated by noisy data Requires high-performancecomputersUnderstanding the DotsProviding PredictiveUnderstanding Produce bioenergy Stabilize CO2 Clean toxic waste22
Why Would Data Mining Matter?Enables solving many large-scale data problemsFinding the DotsConnecting the DotsUnderstanding the Dots Howto effectivelyproduce bioenergy? How to stabilize carbondioxide? How to convert toxicinto non-toxic waste?.23Science Questions
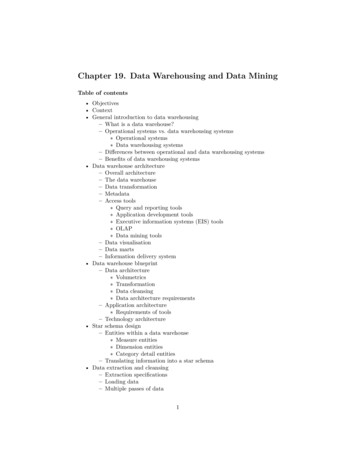
How to Move and Access the Data?Technology trends are a rate limiting factorMost of these data will NEVER be touched!Data doubles every 9 months; CPU ―18 months.Naturally distributedStreaming/Dynamicbut effectively immovablebut not re-computableRetrieval Rate Mbytes/sLatency and Speed – Storage PerformanceCPU, Disk, Network TrendDoubling:CPU: every 1.2 yearsDisk: every 1.4 yearsWAN: 0.7 years105MemoryDiskTapelog10(Object Size Bytes)Src: Richard Mount, SLACJ. W. Toigo, Avoiding a Data Crunch, Scientific American, May 2000MIPS/ MGB/ MkB/s24
How to Make Sense of Data?Know Your Limits & Be SmartMore dataNot humanly possible to browse a petabyte of data.Analysis must reduce data to quantities of interest.Ultrascale Computations:Must be smart about whichprobe combinations to see!PetabytesTerabytesPhysical Experiments:Must be smart about probeplacement!GigabytesMegabytesMore analysisTo see 1 percent of a petabyte at 10 megabytes per second takes:35 8-hour days!25
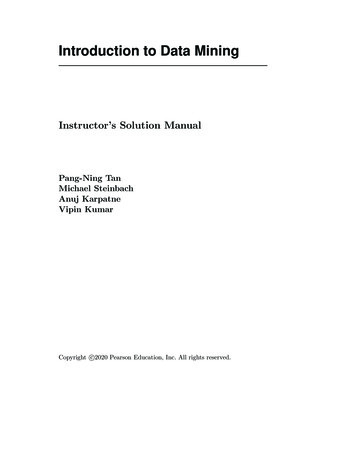
What Analysis Algorithms to Use?Even a simple big O analysis can elucidate simplicity.Analysis algorithms fail for a few gigabytes.Algorithmic Complexity:Calculate meansO(n)Calculate FFTO(n log(n))Calculate SVDO(r c)Clustering algorithmsO(n2)If n 10GB, then whatis O(n) or O(n2) on ateraflop computers?1GB 109 bytes1Tflop 1012 op/secDatasize nAlgorithm Complexitynnlog(n)n2100B10-10sec. 10-10 sec. 10-8 sec.10KB10-8 sec.10-8 sec.10-4sec.1MB10-6 sec.10-5 sec.1 sec.100MB10-4 sec.10-3 sec.3 hrs10GB10-2 sec.0.1 sec.3 yrs.For illustration chart assumes 10-12 sec.26(1Tflop/sec) calculation time per data point
Introduction to Data Mining Dr. Nagiza F. Samatova Department of Computer Science North Carolina State University and . Mining such data studying graphs, or graph mining. What apps naturally deal w/ graphs? 16 Cre