Transcription
Prediction and Analysis of Student Performanceby Data Mining in WEKAReport of Project submitted for the partial fulfillment of the requirements for thedegree of Bachelor of TechnologyInInformation TechnologySubmitted byAGNIK DEYREGISTRATION NO – 141170110101UNIVERSITY ROLL NO – 11700214006ABHIRUP KHASNABISREGISTRATION NO – 141170110097UNIVERSITY ROLL NO -11700214002AJEET KUMARREGISTRATION NO – 141170110104UNIVERSITY ROLL NO - 11700214009Under the Guidance of Mr. Sudarsan BiswasRCC Institute of Information TechnologyCanal South Road, Beliaghata, Kolkata – 700015[Affiliated to West Bengal University of Technology]Sample output to test PDF Combine only
AcknowledgementWe would like to express our sincere gratitude to Mr. Sudarsan Biswas of the department ofInformation Technology, whose role as project guide was invaluable for the project. We areextremely thankful for the keen interest he took in advising us, for the books and referencematerials provided for the moral support extended to us.Last but not the least we convey our gratitude to all the teachers for providing us the technical skillthat will always remain as our asset and to all non-teaching staff for the gracious hospitality theyoffered us.Place: RCCIIT, KolkataDate: .AGNIK DEYREGISTRATION NO – 141170110101UNIVERSITY ROLL NO – 11700214006B. TECH (IT) – 8TH SEMESTER, 2018 .ABHIRUP KHASNABISREGISTRATION NO – 141170110097UNIVERSITY ROLL NO -11700214002B. TECH (IT) – 8TH SEMESTER, 2018 .AJEET KUMARREGISTRATION NO – 141170110104UNIVERSITY ROLL NO - 11700214009B. TECH (IT) – 8TH SEMESTER, 2018Sample output to test PDF Combine only
RCC Institute of Information TechnologyCertificateThis is to certify that the project report titled “Prediction and Analysis of student performance byData Mining in WEKA” prepared under my supervision by Agnik Dey (Roll No.: 11700214006),Abhirup Khasnabis (Roll No.: 11700214002), Ajeet Kumar (Roll No.: 11700214009) of B. Tech.(IT) 8th Semester of 2018, be accepted in partial fulfillment for the degree of Bachelor ofTechnology in Information Technology.It is to be understood that by this approval, the undersigned does not necessarily endorse or approveany statement made, opinion expressed or conclusion drawn thereof, but approves the report onlyfor the purpose for which it has been submitted. Dr. Abhijit Das, Associate Professor & HeadMr. Sudarsan Biswas, Assistant ProfessorSample output to test PDF Combine only
RCC Institute of Information TechnologyCertificate of AcceptanceThe report of the Project titled [Prediction and Analysis of student performance by Data Miningin WEKA] submitted by Agnik Dey (Roll No.: 11700214006), Abhirup Khasnabis (Roll No.:11700214002), Ajeet Kumar (Roll No.: 11700214009) of B. Tech. (IT) 8th Semester of 2018 ishereby recommended to be accepted for the partial fulfillment of the requirements for B Tech (IT)degree in West Bengal University of TechnologyName of the ExaminerSignature with Date1. . 2. . .3. 4. . .Sample output to test PDF Combine only
TABLE OF CONTENTSAbstract11. Introduction1- What is Data Mining?1- What is knowledge Discovery Database (KDD)21.1 Application31.2 Motivation31.3 Problem Definition41.4 Planning41.4.1. Work Flow Diagram52. Background63. Literature Survey64. Design and Implementation8- Dataset and attribute selection8- Preprocessing8- Filters9- Classification10- Prediction of result11- Manually Prediction in WEKA12-Inbuilt WEKA Prediction14- Association Rule Mining16Sample output to test PDF Combine only
: What is association mining?16:16Apriori Algorithm- Apriori algorithm in WEKA: General Process1717- Sample Theoretical example: Procedure of student performanceAnalysis by rule generation method using Apriori algorithm inWEKA tools19- Practical work on Apriori in WEKA tools25- Result of Apriori Algorithm27- Useful Concepts35: Interestingness measures of rules in WEKA35- Approximate Association Rule Mining39- Visualization42: Visualization Chart between two attributes42: Visualize Classifier errors chart between predictedResult and actual result444.1 Result Analysis- Knowledge Discovery Database (KDD)46464.2 WEKA Limitation485. Conclusion and Future Work496. References/Bibliography50Sample output to test PDF Combine only
Page 1AbstractOver the years, several statistical tools have been used to analyze and predict students’performance from different point of view. One of the biggest challenges for higher educationToday is to predict the paths of students through the educational process. Successful students’result prediction in early course stage depends on many factors. Data mining techniques could beused for this kind of job. Data mining techniques are widely used in educational field to find newhidden patterns from student’s data. The hidden patterns that are discovered can be used tounderstand the problem arise in the educational field. Data Mining (DM), or Knowledge Discoveryin Databases (KDD), is an approach to discover useful information from large amount of data.Data mining techniques apply various methods in order to discover and extract patterns from storeddata Based on collected students’ information, different data mining techniques need to be used.For the purpose of this project WEKA data mining software is used for the prediction of finalstudent mark based on parameters in the given dataset. The dataset contains information aboutdifferent students from one college course in the past semester. Student data from the last semesterare used for test dataset.1. IntroductionNowadays, data mining is playing a vital role in educational institutions and one of the mostimportant areas of research with the objective of finding meaningful information from the datastored in huge dataset. Educational data mining (EDM) is a very important research area whichhelpful to predict useful information from educational database to improve educationalperformance, better understanding and to have better assessment of the students learning process.Data Mining or knowledge discovery has become the area of growing significance because it helpsin analyzing data from different perspectives and summarizing it into useful information. What is Data Mining?Data Mining is defined as extracting information from huge sets of data. In other words, we cansay that data mining is the procedure of mining knowledge from data.Data Mining could be a promising and flourishing frontier in analysis of data and additionally theresult of analysis has many applications. Data Mining can also be referred as KnowledgeDiscovery from Data (KDD).This system functions as the machine-driven or convenient extractionof patterns representing knowledge implicitly keep or captured in huge databases, datawarehouses, the Web, data repositories, and information streams. Data Mining is amultidisciplinary field, encompassing areas like information technology, machine learning,statistics, pattern recognition, data retrieval, neural networks, information based systems, artificialintelligence and data visualization.Sample output to test PDF Combine only
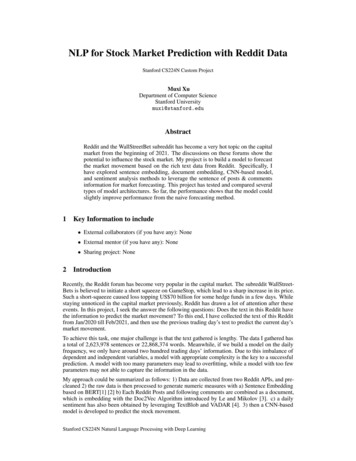
Page 2The application of data mining is widely prevalent in education system. Educational data miningis an emerging field which can be effectively applied in the field of education. The educationaldata mining uses several ideas and concepts such as Association rule mining, classification andclustering. The knowledge that emerges can be used to better understand students’ promotion rate,students’ retention rate, students’ transition rate and the students’ success. The data mining systemis pivotal and crucial to measure the students’ performance improvement. The classificationalgorithms can be used to classify and analyze the students’ data set in accurate manner. Thestudents’ academic performance is influenced by various factors like pa rents’ education, locality,economic status, attendance, gender and result.The main objective of the project is to use data mining methodologies to study and analyze theschool students’ performance. Data mining provides many tasks that could be used to study thestudents’ performance. In this paper, the classification task is employed to gauge students’performance and deals with the accuracy, confusion matrices and the execution time taken by thevarious classification data mining algorithms What is Knowledge Discovery Database (KDD)?Knowledge discovery in databases (KDD) is the process of discovering useful knowledge from acollection of data. This widely used data mining technique is a process that includes datapreparation and selection, data cleansing, incorporating prior knowledge on data sets andinterpreting accurate solutions from the observed results.Here is a basic outline of KDDSample output to test PDF Combine only
Page 31. 1 ApplicationOur project is on Educational Data Mining (EDM) field. It has several applications. The areas ofEDM are Analysis and visualization of dataProviding feedback for supporting instructorsRecommendations for studentsPredicting student performanceStudent modelingDetecting undesirable student behaviorsGrouping studentsSocial network analysisDeveloping concept mapsPlanning and scheduling1. 2. MotivationIn India, there is largest no. of educational institutes, so it is second largest in the world after UnitedStates. There is more competition between all institutes for attracting students to get enrollment intheir institutes so they focus on strength of students not quality of education at the time ofenrollment. Today Admission process of institutes has become very critical. There are manyproblems at the time of admission in institutes because many students apply for courses but seatsare limited, so there is no proper seat allocation of courses to the students so students are unableto get enroll in their interested courses. Some students have good marks but they get admission inother course (that is not according to their subjects) due to limited seats.So there is a proper attention is needed in admission process. Every year huge amount of studentdata is recorded in database however this data is not put in proper form. There is a requirement ofdata mining that handle these challenges & overcome them. Then there is enough information forbetter planning, evaluation and decision making. Data mining will extract hidden information fromstudent enrollment database, this information will be meaningful for institutes. Then a better &mined knowledge is present in database that can be use directly, there is no extra requirement. Themotive behind in this paper is based on classification model for enrollment in higher educationalcourses using data mining techniques. This is useful for predicting the students that are interestedto take admission in higher study course. By this study we will find some meaningful pattern thatcan be useful for institutes.Sample output to test PDF Combine only
Page 41. 3 Problem DefinitionData mining is widely used in educational field to find the problems arise in this field. Studentperformance is of great concern in the educational institutes where several factors may affect theperformance. For prediction the three required components are: Parameters which affect thestudent performance, Data mining methods and third one is data mining tool. These Parametersmay be psychological, personal, and environmental. We conduct this study to maintain theeducation quality of institute by minimizing the diverse affect of these factors on student’sperformance. In this Paper, Prediction of student Performance is done by applying Aprioriclassification techniques WEKA tool. By applying data mining techniques on student data we canobtain knowledge which describes the student performance. This knowledge will help to improvethe education quality, student’s performance and to decrease failure rate. All these will help toimprove the quality of institute.1. 4 PlanningThe main objective of this work is to use data mining methodologies to student’s performance inthe semester. Data mining provides many tasks that could be used to study the studentperformance. Our work will be divided into two main parts- one is prediction by classification andanother one is association rule mining by using the machine learning tool ‘WEKA’. At first wewill select our dataset and then perform preprocessing of it. After preprocess we will doclassification over the dataset and perform prediction of result. Then we will apply association rulemining technique over the dataset and generate some rules which will be analyzed later. At lastboth result of prediction and association will be visualized by ‘Knowledge Flow Representation’.Sample output to test PDF Combine only
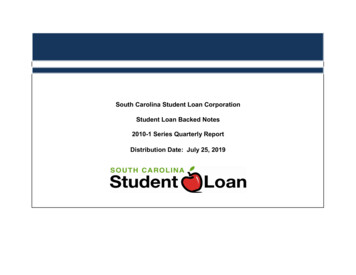
Page 51.4.1 Work Flow DiagramProblem StatementCollege StudentDatabaseCollection of Datafrom Last SemesterResultData PreprocessingData SelectionData CleaningData TransformationData MiningAssociationClassificationResult EvaluationKnowledge FlowRepresentationSample output to test PDF Combine only
Page 62. BackgroundHere is the background tool required for our project.Required Software (WEKA) –We have used a data mining software named as WEKA for this project. For the purposes of thisstudy, we select WEKA (Waikato Environment for Knowledge Analysis) software that wasdeveloped at the University of Waikato in New Zealand. WEKA tool supports to a wider range ofalgorithms & very large data sets. The WEKA (pronounced Waykuh) workbench contains acollection of visualization tools & algorithms. WEKA is open source software issued under theGNU General Public License. It contains tools for data pre-processing, classification, regression,clustering, association rules, and visualization. The original non-java version of WEKA was aTCL/TK, but the recent java based version is WEKA 3(1997), is now used in many differentapplication areas, in particular for education & research. WEKA’s main user interface is Explorer.The Experimenter is also there by which we can compare WEKA’s machine learning algorithms’performance. The Explorer interface has many panels by which we can access to main componentsof workbench. The Visualization tab allows visualizing a 2-D plot of the current working relation,it is very useful. In this study WEKA toolkit 3.8.1 is used for generating the association rules andprediction of result.WEKA supports several standard data mining tasks, more specifically, data preprocessing,clustering, classification, regression, visualization, and feature selection. All of WEKA'stechniques are predicated on the assumption that the data is available as a single flat file or relation,where each data point is described by a fixed number of attributes (normally, numeric or nominalattributes, but some other attribute types are also supported). WEKA provides access to SQLdatabases using Java Database Connectivity and can process the result returned by a databasequery. It is not capable of multi-relational data mining, but there is separate software for convertinga collection of linked database tables into a single table that is suitable for processing using WEKA.3. Literature SurveySamrat Singh, Dr. Vikesh Kumar [1] .Data Mining is a powerful tool for academic performance.Educational Data Mining is concerned with developing new methods to discover knowledge fromeducational database and can used for decision making in educational system.M. Goyal and R. Vohra [2] .Data analysis plays an important role for decision support irrespectiveof type of industry like any manufacturing unit and educations system. If data mining techniquessuch as clustering, decision tree and association are applied to higher education processes, it wouldhelp to improve students performance, their life cycle management, selection of courses, tomeasure their retention rate and the grant fund management of an institution.Jason Brownlee [3]. After you have found a well performing machine learning model and tunedSample output to test PDF Combine only
Page 7it, you must finalize your model so that you can make predictions on new data.Neelam Naik & Seema Purohit [4] . The quality higher education is required for growth anddevelopment of country. Professional education is one of the pillars of higher education. Datamining techniques aim to discover hidden knowledge in existing educational data, predict futuretrends and use it for betterment of higher educational institutes as well as students.Alaa M.El-Halees, Mohammed M. Abu Tair. [5] Educational data mining concerns withdeveloping methods for discovering knowledge from data that come from educational domain. Inthis paper we used educational data mining to improve graduate students’ performance, andovercome the problem of low grades of graduate students.B.K. Bharadwaj and S. Pal [6] .Now-a-days the amount of data stored in educational databaseincreasing rapidly. These databases contain hidden information for improvement of students'performance. The performance in higher education in India is a turning point in the academics forall students. This academic performance is influenced by many factors, therefore it is essential todevelop predictive data mining model for students' performance so as to identify the differencebetween high learners and slow learners student. In the present investigation, an experimentalmethodology was adopted to generate a database.Suchita Borkar, K. Rajeswari [7] .Education Data Mining is a promising discipline which has animperative impact on predicting students’ academic performance. In this paper, student’sperformance is evaluated using association rule mining algorithm. Research has been done onassessing student’s performance based on various attributes. In our study important rules aregenerated to measure the correlation among various attributes which will help to improve thestudent’s academic performance.Randhir Singh, M.Tiwari, Neeraj Vimal [8]. Educational institutions are important parts of oursociety and playing a vital role for growth and development of nation and prediction of student’sperformance in educational environments is also important as well. Student’s academicperformance is based upon various factors like personal, social, psychological etc.D.Magdalene Delighta Angeline [9].The objective of the educational institution that is producinggood results in their academic exams can be achieved by using the data mining techniques whichcan be applied to predict the performance of the students and to impart the quality of education inthe educational institutions. Data mining is used to extract meaningful information and to developrelationships among variables stored in large data set.Mrs. M.S. Mythili, Dr. A.R.Mohamed Shanavas [10] . In recent years, the analysis and evaluationof students‟ performance and retaining the standard of education is a very important problem inall the educational institutions. The most important goal of the paper is to analyze and evaluate theschool students‟ performance by applying data mining classification algorithms in WEKA tool.S. Anupama Kumar and Dr. Vijayalakshmi M.N [11] .Educational data mining is used to studythe data available in the educational field and bring out the hidden knowledge from it.Classification methods like decision trees, rule mining, Bayesian network etc can be applied onthe educational data for predicting the students behavior, performance in examination etcSample output to test PDF Combine only
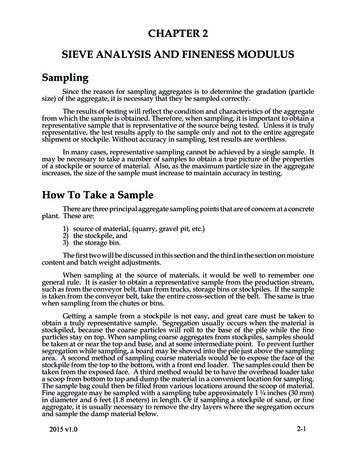
Page 84. Design and ImplementationThe followings are the step by step process of our project evaluation. Dataset and attribute selection- We have collected a dummy dataset contains theresult of students of last semester. The dataset contains 507 instances and 18 attributes. Ithas some missing values also. The data file has to be in either in ‘CSV’ format or ‘ARFF’format.Here is the sample of our dataset which is in ‘CSV’ format. PreprocessingData Preprocessing is the first step of evaluation of this project. For our project we willchoose WEKA Explorer interface. Here the source data file is selected from local machine.After loading the data in Explorer, we can refine the data by selecting different optionswhich is known as ‘Data Cleaning’ and can also select or remove attributes as per our need.The following is the preprocessed of our dataset. Left hand side of the above screen showsdetail of relation name, number of attributes and number of records. Right hand side givesdetails of attribute values, type, and number of distinct values. Specification of everyattribute is displayed in the right bottom of the screen.Sample output to test PDF Combine only
Page 9 Filters -The preprocess section allows filters to be defined that transform the data in variousways. The Filter box is used to set up the filters that are required. There are mainly twocategories of filters-Supervised and Unsupervised. Here we will choose unsupervisedcategory filters. In case if the dataset is contained with any numeric values we have to covertit nominal values( as Association in WEKA can only support nominal values) by using‘Numeric To Nominal’ filter under attribute section of Unsupervised filters. Another one filterwe will apply named as ‘Replace Missing Values’ which will replace all missing values ofour dataset and will make the dataset able to perform ‘Approximate Association RuleGeneration’ about which we will talk later on this paper.Sample output to test PDF Combine only
P a g e 10 Classification - To predict nominal or numeric quantities we have classifiers in WEKA.For our prediction purpose we have to choose a classifier. We will select a standardclassifier named as J48 for classification.From the above example we can say J48 is a good classifier as it gives an accuracy of97.43% because the percentage of correctly classified instances is often called accuracy orsample accuracy. The correctly and incorrectly classified instances show the percentage oftest instances that were correctly and incorrectly classified. The raw numbers are shown inthe confusion matrix, with a,b,c and d representing the class labels.Here are some others factor in classifier output TP Rate: rate of true positives (instances correctly classified as a given class)FP Rate: rate of false positives (instances falsely classified as a given class)Precision: proportion of instances that are truly of a class divided by the total instancesclassified as that classRecall: proportion of instances classified as a given class divided by the actual total in thatclass (equivalent to TP rate)F-Measure: A combined measure for precision and recall calculated as 2 * Precision *Recall / (Precision Recall)Sample output to test PDF Combine only
P a g e 11Prediction of result –First, the file with cases to predict needs to have the same structure thatthe file used to learn the model. The difference is that the value of the result attribute is “?” for allinstances (question marks represent missing values in WEKA). Train Dataset in ARFF Test Dataset in ARFFSample output to test PDF Combine only
P a g e 12Manually Prediction in WEKAi.ii.iii.iv.v.First we have to load the dataset in WEKA Explorer and go to the classify tab. In classifytab make sure the test options should be ‘Use Training Set’ and focus should be on Resultattribute only.Then we have to perform classification of Training set data by J48 Classifier.Now we have to change the Test options into ‘Supplied test set’.Now we have to Click on ‘Supplied test set’ by which ‘set’ tab will come.Now click on to ‘set’ tab and in Test instances select ‘Open With ‘ to load the test set whichis basically the same dataset of Training set except in the ‘Result’ attribute the values ofresult is removed and replaced with ‘?’ for all instances.Sample output to test PDF Combine only
P a g e 13vi.Now after loading the test data we have to perform the classification by J48 classifier onthe test dataset.vii.Now after classification of Test data in result list we have to select ‘Visualize Classifiererrors .It will show a graph known as visualization of WEKA classifier. Then we have tosave the visualization result which will be in ARFF format.viii.Now if we open the saved result of ‘visualization of classifier errors’ in WEKA ARFFviewer we can see a new attribute named as ‘Predicted RESULT’ is generated in testdataset which maybe or may not be similar with the original result attribute of traineddataset. This known as prediction of WEKA where WEKA predicts the result of studentperformance which further can be studied for analysis purpose.Here one more attribute is generated in test set known as ‘Prediction Margin’. The marginis defined as the difference between the probability predicted for the actual result and thehighest probability predicted for the other results. One hypothesis as to the goodSample output to test PDF Combine only
P a g e 14performance of boosting algorithms is that they increase the margins on the training dataand this gives better performance on test data.Inbuilt WEKA PredictionI.II.At first we have to load our dataset into WEKA Explorer.After loading our dataset go to classify tab and start classification by J48 classifier. Inclassify tab Test options can be ‘Cross Validation’.Sample output to test PDF Combine only
P a g e 15III.IV.V.VI.Then change the test option into ‘Supplied Test set and load the same dataset as test file.After loading the test file in classify tab under test options select more options to go tothe ‘classifier evaluation options’.Now in classifier evaluation options select the output predictions and choose ‘Plaintext’as prediction.Now perform the classification of test set by J48 Classifier. Now in classifier output itwill be seen that WEKA performs predictions on test set. In the result the ‘Predictederror’ column contains predicted value of Result attribute which is the predicted result oforiginal result of train data set. Thus WEKA performed prediction.Here one more column is generated named as ‘Prediction’ which has some certain valuesfor all instances. The ‘Prediction is defined as the difference between the probabilitySample output to test PDF Combine only
P a g e 16predicted for the actual result and the highest probability predicted for the other results.One hypothesis as to the good performance of boosting algorithms is that they increase themargins on the training data and this gives better performance on test data.In the following picture for some instances the ‘ ’ sign signifies that WEKA predictionfails to match the actual result.However from the two methods of prediction in WEKA ,they gives the same predicted result anddifference between the probability predicted for the actual result and the highest probabilitypredicted for the other results is same for both method. For the first method it is known as‘Prediction Margin ‘but in second method it is known as ‘Prediction’. Association Rule Mining What is association mining?Finding frequent patterns, associations, correlations, or casual structures among set of items orobjects in transaction databases, relational databases, and other information repositories. Apriori Algorithm –The apriori algorithm is an influential algorithm for mining frequent item sets for Booleanassociation rules.Aprori uses a “bottom up” approach where frequent subsets are extended one time at atime (a step known as candidate generation and groups of candidates are tested against the data).Sample output to test PDF Combine only
P a g e 17Apriori algorithm in Weka:General ProcessAssociation rule generation is usually split up into two separate steps:1. First, minimum support is applied to find all frequent item sets in a database.2. Second, these frequent item sets and the minimum confidence constraint are used to form rules.While the second step is straight forward, the first step needs more attention.Finding all frequent item sets in a database is difficult since it involves searching all possible itemsets.Support- The support for a rule X Y is obtained by dividing the number of transactionsWhich satisfy the rule, N (X Y), by the total number of transactions, NSupport (X Y) N (X Y) / NThe support is therefore the frequency of events for which both the LHS and RHS of the rule holdtrue. The higher the support the stronger the information that both type of events occur together.Confidence- The confidence of the rule X Y is obtained by dividing the number ofTransactions which satisfy the rule N (X Y) by the number of transactions which contain theBody of the rule, X.Confidence (X Y) N (X Y) / N (X)The confidence is the conditional probability of the RHS holding true given that the LHSHolds true. A high confidence that the LHS event leads to the RHS event implies causation orStatistical dependence.Sample output to test PDF Combine only
P a g e 18Lift- The lift of the rule X Y is the deviation of the support of the whole rule from theSupport expected under independence given the supports of the LHS (X) and the RHS (Y).Lift {X Y} confidence (X Y) / support (Y) support (X Y) / support (X). support (Y)Lift is an indication of the effect that knowledge that LHS holds true has on the probability ofThe RHS holding true. Hence Lift is a value that gives us information about the increase inProbability of the "then" (consequent RHS) given the "if" (antecedent LHS) part.Lift is exactly 1: No effect (LHS and RHS independent). No relationship betweenEvents.Lift greater than 1: Positive effect (given that the LHS holds true, it is more likely thatThe Operational risk management RHS holds true). Positive dependence between events.Lift is smaller than 1: Negative effect (when the LHS holds true,
What is Data Mining? Data Mining is defined as extracting information from huge sets of data. In other words, we can say that data mining is the procedure of mining knowledge from data. Data Mining could be a promising and flourishing frontier in analysis of data and a