Transcription
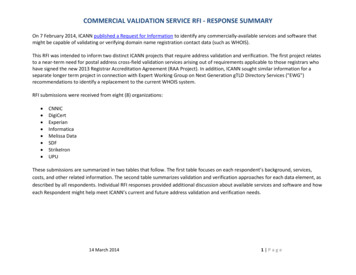
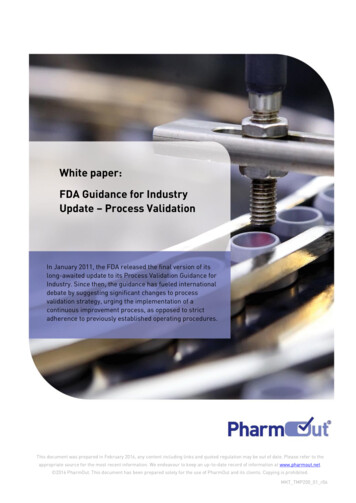
Development and validation of reversed phasehigh performance liquid chromatography(RP-HPLC) for quantification of captopril inrabbit plasmaActa Chromatographica33 (2021) 4, 315–321DOI:10.1556/1326.2020.00816 2020 The AuthorsMUHAMMAD FAWAD RASOOL1, UMBREENFATIMA QURESHI2, NAZAR MUHAMMAD RANJHA3,IMRAN IMRAN4, MOUQADUS UN NISA4 andABDUL MAJEED1p1Department of Pharmacy Practice, Faculty of Pharmacy, Bahauddin Zakariya University, 60800,Multan, PakistanORIGINAL RESEARCHPAPER2Department of Pharmaceutics, Faculty of Pharmacy, Bahauddin Zakariya University, 60800,Multan, Pakistan3Department of Pharmacy, University of Lahore, Gujrat Campus GT Road, Gujrat, Pakistan4Department of Pharmacology, Faculty of Pharmacy, Bahauddin Zakariya University, 60800, Multan,PakistanReceived: July 4, 2020 Accepted: August 18, 2020Published online: October 3, 2020ABSTRACTTh accurate rapid, simple and selective reversed phase high performance liquid chromatography (RPHPLC) has been established and validated for the determination of captopril (CAP). Chromatographicseparation was accomplished using prepacked ODSI C18 column (250 mm 3 4.6 mm with 5 mmparticle size) in isocratic mode, with mobile phase consisting of water: acetonitrile (60:40 v/v), pHadjusted to 2.5 by using 85% orthophosphoric acid at a flow rate of 1 mL/min and UV detection wasperformed at 203 nm. RP-HPLC method used for the analysis of CAP in mobile phase and rabbitplasma was established and validated as per ICH-guidelines. It was carried out on a well-definedchromatographic peak of CAP was established with a retention time of 4.9 min and tailing factor of1.871. The liquid–liquid extraction method was used for extraction of CAP from the plasma. Excellentlinearity (R2 5 0.999) was shown over range 3.125–100 mg/mL with mean percentage recoveries rangesfrom 97 to 100.6%. Parameters of precision and accuracy of the developed method meet the establishedcriteria. Intra and inter-day precision (% relative standard deviation) study was also performed whichwas less than 2% which indicate good reproducibility of the method. The limit of detection (LOD) andquantification for the CAP in plasma were 3.10 and 9.13 ng/mL respectively. The method was suitablyvalidated and successfully applied to the determination of CAP in rabbit plasma samples.KEYWORDSCAP, RP-HPLC, validation, plasma, system suitabilityINTRODUCTION*Corresponding author. Tel.: þ923336139819; fax: þ92 619210098E-mail: abdulmajeed@bzu.edu.pkExperimental drugCaptopril (CAP), chemically it is known as ine shown in Fig. 1. It is used in the treatment of high blood pressure and congestiveheart failure both in adults and youngsters. It blocks the conversion of angiotensin I toangiotensin II through inhibiting the angiotensin converting enzyme and inactivatesUnauthenticated Downloaded 05/04/22 10:33 PM UTC
Acta Chromatographica 33 (2021) 4, 315–321316Fig.1. Chemical structure of CAPbradykinin, a powerful vasodilator. The hypotensive effect ofCAP may results from the both inhibitory action on reninangiotensin system and simulating action on kallikrein kininsystem [1]. It differs from different ACE inhibitors throughthe presence of a sulfhydryl group [2]. CAP is a white to offwhite powder which is soluble in water (4.60 mg/mL),methanol and ethanol. It has practically highly solubility inwater and its bioavailability is 70%. Thus, it belongs to class1 of the Biopharmaceutical Classification System (BCS) [3].CAP has a short half-life of approximately 2 h. [4]. CAPmelting point is 104–108 8C with molecular weight of217.29. Its pKa value is 3.70 and log pa.w (biphasic system ofoctanol and water) is 0.34 [5].Several methods were reported for determination of CAPin rabbit plasma which includes gas chromatography (GC)[6], gas chromatography-mass spectrometry (GS-MS) [7, 8],high performance liquid chromatography (HPLC) [9–15]and liquid chromatography-mass spectrometry (LC-MS)[16] low-injection-analysis, capillary electrophoresismethods with laser-induced fluorescence detection (LIFD)[17]. However, most of compound do not exhibit nativefluorescence and decomposed and this method is highlysuitable with compounds contain thiol group [18]. The GCtechnique is restricted through sensitivity and the GC-MS orLC-MS methods may not be extensively used and thesetechniques require specific detectors, and fluorometer andothers require benzene for washing. Radioimmunoassay(RIA) and enzyme immunoassay methods are complicated,and involve specialized and expensive equipment that arenot generally available in all scientific settings and requiredhigh quantity of plasma which is not easily available in allpopulations. Among these methods, reversed phase highperformance liquid chromatography (RP-HPLC) is themostly used because of high sensitivity and selectivity andeconomical [19–21].This method was very economical and reliable for thedetermination and validation of drug in rabbit plasma andpharmaceutical dosage form [22]. Literature survey showedthat other methods presented many drawbacks including useof maximum solvents and consumption of time. Furthermore, the sensitivity is not high sufficient for the determination of CAP in plasma samples. We developed sensitiveand accurate validated HPLC assay with ultraviolet detectionfor determination of CAP in rabbit plasma. But this method,in comparison to already reported method required ashorter analysis time (10 min) and relatively low costinstrumentation needed for analysis. [23–25]. There is aneed to develop novel inexpensive economical method forthe quantification of CAP both in mobile phase and plasmawhich was not previously reported.The objective of this study aimed to generate reliable,accurate and precise data regardless its acceptance. Thereforchief purpose of this work is to develop a simple, precise,accurate and sensitive RP-HPLC method established for thedetermination of CAP. This method will provide other alternatives for already existing HPLC method with anadvantage of higher resolution, shorter run-time, economical, and using low flow rate.EXPERIMENTALInstrumentationAn isocratic High-Performance Liquid ChromatographicSystem (Agilent 1100 series Germany) equipped with autosampler, Diod detector, binary pump, column oven, vacuumdegasser quaternary solvent manager. Welchrome ODSIC18 column (250 mm 3 4.6 mm with 5 mm particle size)was utilized for detection of analyte. The computer runningsoftware Agilent chemstation 32 (HPLC software) was usedfor data acquisition and processing. Other instruments suchas Centrifuge machine (Hettich Zentrifugen Germany),Vortex mixer (Scilogex MX-S Germany), pH meter(OHAUS Corporation USA), Ultrasonic cleaner (FSF-010Sby Huanghua Instrument), Electric Balance (OHAUS Corporation USA), Syringe filter (0.22 mm ALLPURE Nylon),membrane filter (0.22 mm, Germany), Vacuum pump(Model AS-20 Germany), Filtration assembly (PyrexFrance), and Micro pipette were used.Drug sample and chemicalsPure sample of CAP was obtained as a gift from ValorPharmaceuticals, Islamabad, Pakistan. HPLC grade organicsolvents such as acetonitrile, methanol and orthophosphoricacid (85%) were obtained from Sigma Aldrich, Germany.Deionized water was obtained from drug testing laboratory,Multan from their in-house purification system. All chemicals and reagents were of HPLC grade.Chromatographic conditionsThe mobile phase consisted of water and acetonitrile in theratio of 60:40 (v/v) pH 2.5 adjusted with orthophosphoricacid (85%) was pumped through the column at a constantflow rate of 1 mL/min at ambient temperature with injectionvolume 20 mL and quantification was achieved at 203 nm.Selection and optimization of mobile phaseA solvent system of HPLC grade acetonitrile and water wasselected as mobile phase for good analyte solubility andstability of drug. To attain adequate resolution differentUnauthenticated Downloaded 05/04/22 10:33 PM UTC
Acta Chromatographica 33 (2021) 4, 315–321ratios of mobile phase had been tried for mobile phaseoptimization. In preliminary studies trials had been madewith water: acetonitrile (pH 2.5 adjusted with orthophosphoric acid 85%) in various proportions, like 70:30, 80:20,50:50 but 60:40 (v/v) showed maximum separation, betterpeak resolution and sensitivity.Drug-stock solutionThe mobile phase comprising of water and acetonitrile inratio of 60:40 (v/v) pH 2.5 adjusted with orthophosphoricacid (85%) was prepared. The mobile phase was sonicated,filtered through 0.22 mm filter paper and then degassed for10 min. Drug stock solution of 100 mg/mL was prepared in100 mL volumetric flask using mobile phase as diluents.Further dilutions of 100, 50, 25 12.5, 6.125, and 3.125 mg/mLdrug were prepared under the range of 100–3.125 mg/mLwith mobile phase as solvent.Drug-plasma solutionBlood samples have been collected from healthy rabbits incitrated tubes (bolton scientific restrained) and immediatelycentrifuged at 4,500 rpm for 20 min. The supernatant liquidwas collected and saved at 20 8C. The study was performedwith the approval of ethical committee for utilization oflaboratory animals, Bahauddin Zakariya University MultanPakistan. After thawing the plasma samples were spikedwith above mentioned drug concentration under the rangeof a 100–3.125 mg/mL.Drug extraction from plasmaDrug was extracted from plasma samples by using liquid–liquid extraction technique. Two milliliter of acetonitrile asdeproteinizer was added in equal volume of rabbit plasmavortexed for 20 min at 2,000 rpm and centrifuged for 20 minat 4,000 rpm. Supernatant layer was removed and transferred to another test tube and evaporated to completedryness at 40 8C. Then 100 mL mobile phase was added andagain vortexed for 10 min at 2,000 rpm. Sample was filteredthrough 0.22 mm membrane filter and then 20 mL of samplewas injected to HPLC system for analysis and detection wasdone at 203 nm.Construction of calibration graphsAliquots ranging from 3.125 to 100 mg/mL were transferredfrom their stock solution into volumetric flasks. Chromatographic conditions were applied in triplicate for thesesolutions and chromatograms were recorded. Preparation ofcalibration curves of CAP was done by plotting the averagepeak area verses corresponding concentrations at 203 nmand regression equations were calculated.Method validationValidation of proposed HPLC method was accomplishedaccording to guidelines of the International conference onthe Harmonization of Technical Requirements for the317Registration of Pharmaceuticals for Human Use (ICH) [26].Various parameters like, selectivity, linearity, limit ofdetection (LOD), limit of quantification (LOQ), accuracy,precision and robustness of drug in plasma were assessed.SelectivityThe selectivity of developed method was performed byevaluating blank as well as CAP samples The RT wasdetermined under similar chromatographic conditions.Selectivity was calculated by matching the chromatograms ofsix repeat injections of each blank with the standarddrug [27].LinearityThe linearity of an analytical technique is the functionalityto bring out results that are directly proportional to theconcentration of analyte in sample within a given range andis evaluated by means of regression analysis. The linearity ofthe technique was evaluated with repeatedly injectingdifferent concentrations of the standard solution of thecaptopril. Calibration curve was constructed by plottingsample peak area (mean) against concentration and regression equation was computed.Limits of detection and quantificationLOD is the lowest amount of analyte in a sample that can bedetected however not quantified as an exact value while theLOQ is the lowest quantity of analyte in a sample that maybe quantitatively determined with suitable precision andaccuracy [3]. The LOD and LOQ were calculated weredetermined based on calibration curve using Eqs. (1) and (2)respectively [26].3:3 3σLOD ¼(1)SLOQ ¼103σS(2)wherein, σ is the standard deviation of y-intercept of calibration curve and s is the slope of calibration curve.Accuracy and precisionAccuracy of an analytical technique that measures thecloseness of measured values to the authentic or true values.accuracy was determined by estimating the % recovery ofknown concentration of CAP spiked in three differentworking standards (50, 25, and 12.5 mg/mL) It was evaluatedas percentage relative standard deviation (RSD) among themeasured values and true values. Minimal of three concentration levels had been selected and five runs had beenperformed for each concentration and then peak area wascalculated as given in Table 2. Precision of a method is ameasure of the ability to create reproducible results. Precision was determined by calculating % RSD of peak area ofthree different concentrations (50, 25, and 12.5 mg/mL) eachUnauthenticated Downloaded 05/04/22 10:33 PM UTC
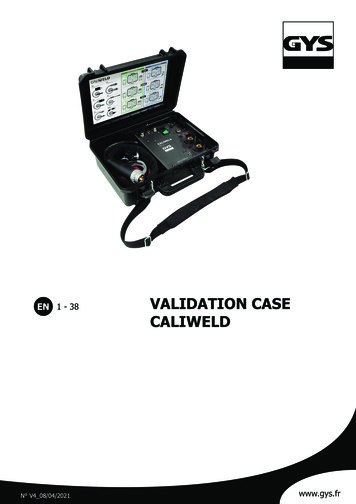
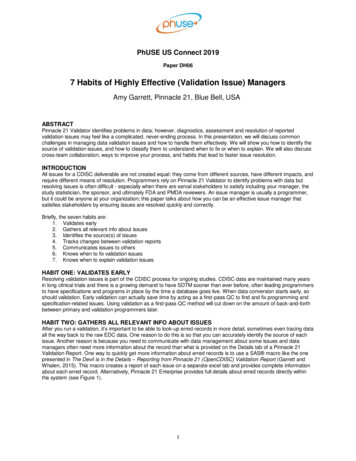
318Acta Chromatographica 33 (2021) 4, 315–321in triplicate within day over the entire calibration curverange.Table 1. Results of system suitability studyRobustnessThe robustness of method was evaluated by deliberatevariation in chromatographic conditions including analyticalinstrument, wavelength, pH, mobile phase composition,column oven temperature and flow rate [28]. The robustnessof the developed technique was evaluated by altering mobilephase ratio and flow rate.System suitabilityIn order to verify the suitability of chromatographic systemfor intended analysis, system suitability test was performedby six replicate injections of standard solution of CAP (50mg/mL) and determining % RSD between obtained retentiontime, tailing factor (10%), number of theoretical plates.Drug stability studiesThe drug stability in a biological fluid is a function of thestorage conditions as well as chemical properties of CAP wasstudied in rabbit plasma using freeze-thawing method. Thesamples of drug were freezed at 20 8C for a period of 24 h.Samples were removed after 24 h from refrigerator andallowed to de-freeze then injected into HPLC system foranalysis.Application to plasma samplesThe assay was applied to an open-label, single-dose (50 mgCAP) pharmacokinetic study in 6 healthy rabbits. Albinorabbits of weight about 2.0–2.5 kg obtained from animalhouse of Pharmacology Laboratory, Faculty of Pharmacy;Bahauddin Zakariya University Multan, Punjab (Pakistan).The research protocols were studied and approved by thedepartmental animal ethics committee. All rabbits werehoused in well maintained separate chamber with propertemperature conditions (25 1 8C). Rabbits which havealready received any drug or those whose weight was lessthan 2 kg were excluded from study. After drug administration, blood samples for analytical determinations werecollected in heparinized tubes. Liquid–liquid extractionmethod was used for the extraction of CAP from rabbitplasma samples. Within 30 min after blood collection, bloodplasma was separated. To 1 mL plasma samples, acetonitrilein equal volume was added. The tubes were vortex-mixed at2,000 rpm for 2 min and was centrifuged at 2,000 rpm for 20min. The supernatant portion was removed and transferredto another test tube and evaporated to complete dryness at40 8C for a period of 30 min, then stored at 20 8C untilanalysis after filtering through a 0.22-mm filter paper.RESULTS AND DISCUSSIONDeveloping a sensitive, simple and accurate stability indicating RP-HPLC method for the determination of CAP bothParametersRetention time (min)Peak areaTailing factorTheoretical platesMean (n 5 6)% 016– 2 2–in mobile phase and rabbit plasma with satisfactory precision for good analytical practice was the main goal of thiswork. To optimize the separation and highest analyticalsensitivity for drug, different mobile phase compositionshave been checked. Such as ratios (80:20, 70:30, 50:50 v/v) ofmobile phase were tested as trial solvent for system suitability approach. The variation within the mobile phaseleads to considerable modifications within the chromatographic parameters like peak symmetry and retention time.But, the ratio of (60:40 v/v) yields the best consequences interms of peak resolution and retention time. The pH impactconfirmed the optimized conditions when pH value is 2.5generating properly resolved and sharp peaks for the drugassay at wavelength 203 nm.System suitabilityThe HPLC system became equilibrated with the preliminarymobile phase composition, followed by six injections of thesame standard. These six consecutive injections were used toassess the system suitability on each day of method validation. Parameters of system suitability were peaks symmetry(tailing element), area, theoretical plates and determinationof retention time had been summarized in Table 1. Thecapacity factor was in the within in range as reported [29].LinearityTo establish linearity of the proposed method six differentconcentration of drug solution were prepared and analyzed.Standard curve was generated at concentrations of 100, 50,25, 12.5, 6.125, and 3.125 mg/mL for CAP. The calibrationcurve was shown to be linear in the above mentioned rangein rabbit plasma. Curve was obtained by plotting peak areaagainst concentrations of the drug. Linear calibration curvewas generated by using linear regression analysis and obtained over the respective standard concentrations range.The curve, slope, intercept and the correlation coefficientwere determined. It was found that regression coefficientand regression equation had been within limits as proven inFig. 2.LOD and LOQLOD and LOQ values were calculated from the knownquantities of CAP in rabbit plasma. The LOD and LOQvalues were found to be 3.10 and 9.13 ng/mL respectively.Recovery (%)The accuracy was measured at five concentration levels (50,25, 12. 5, 6.25, and 3.125%) by using known quantities ofUnauthenticated Downloaded 05/04/22 10:33 PM UTC
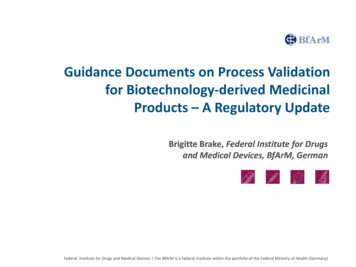
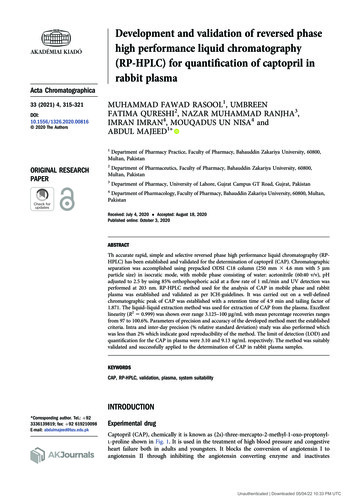
Acta Chromatographica 33 (2021) 4, 315–321319Table 4. Inter-day precision for determination of CAPAdded concentration(mg/mL)502512.56.253.125Measured SD%RSD 0.290.0990.04010.0287Table 5. Robustness results of different conditionsFig. 2. Representative calibration curve of CAPConditionsTable 2. Percentage recoveries of CAP in plasmaConcentration(mg/mL)Concentration found(mean SD)%RSD% Recovery 0.0560.0345spiking drug analytes. Three injections of each concentrationwere injected into system and % recoveries have beencalculated as shown in Table 2.Mobile phasecompositionWater:Acetonitrile(70:30)Mobile phasecompositionWater:Acetonitrile(80:20)Changes in flow rate(1.2 mL/min)Changes in flow rate(0.8 mL/min)Addedconc.(mg/mL)Measuredconc.(mg/mL)% RSD502512.546.15 0.95422.29 1.1311.21 0.4042.0675.0693.603502512.545.15 0.9022.35 0.91611.30 045.1222.3311.29 9050.172Accuracy and precisionIn intra-day and inter-day precision and accuracy assay wereperformed. Slight variations in retention times wereobserved using the mobile phases that had been prepared ondifferent days. Five replicates of every concentration havebeen injected in to system on two alternate days in each caseand % RSD and % accuracy and precision were calculated.The outcomes of this studies predicted that compound wasnot affected only slight changes in retention time wasobserved. Intra-assay and inter-assay precision and accuracyof the purposed method is illustrated in Tables 3 and 4respectively.RobustnessRobustness was determined by small changes in thecomposition of mobile ratio and flow rates. Peak area of thedrug was measured in every step and % RSD was calculatedTable 3. Intra-day precision for determination of CAPAdded concentration(mg/mL)502512.56.253.125Measured SD%RSD 0520.03210.025which was given in Table 5. These values have been withinlimits which imply that the advanced technique turned intorobust [7].Specificity and selectivityThe chromatograph of CAP demonstrated absence ofinterference of any other peaks during analysis. Resolutionbetween and release media peak was found to be 3.59 0.26which confirmed the specificity of developed RP-HPLCmethod for CAP. No peak was observed at the retentiontime of analyte in blank sample indicated in Fig. 3 thatshowed proposed method is highly specific for CAP analysis.Fig. 3 represents the chromatograms of CAP in mobilephase, solvents, rabbit plasma spiked with CAP and blankplasma. No change was found within the chromatogram ofCAP both in mobile phase and rabbit plasma extraction.That’s why, this method was accurate and precise for thedrug [30].The stability of CAP was determined by diluting samplesin mobile phase. The samples were checked after 3 consecutive days of storage. The observed data was compared withfresh prepared samples. In each analysis RSD (%) valueswere determined which found to be less than 3%. This indicates that CAP is stable in mobile phase for at least 3 days.The stability of CAP in plasma was determined by periodicanalysis of spiked samples. Results indicated no degradationUnauthenticated Downloaded 05/04/22 10:33 PM UTC
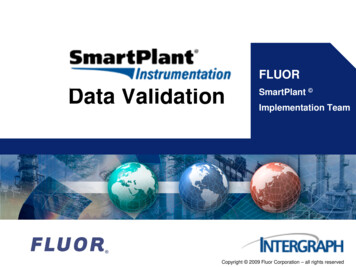
Acta Chromatographica 33 (2021) 4, 315–321320Fig. 3. chromatograms of (A) Drug solution in Mobile phase. (B) Mobile phase (solvent). (C) Drug in rabbit Plasma. (D) Blank plasmaPharmacokinetic analysisThe developed method was applied to the determination ofCAP in plasma samples. Plasma samples were periodicallycollected up to 10 h after oral administration of CAP tabletsto six healthy rabbits. Fig. 4 illustrates the mean plasma drugconcentration vs time profile of CAP following an oral dosecontaining 50.0 mg. The plasma level of CAP reached amaximum at almost 0.75 h after the administration. Fromthe results presented in Fig. 4 it can be concluded thatmaximum level of drug concentration was attained in asample taken after approximate 1 h of oral administration ofCAP powder. Hence time to reach maximum concentration(tmax) was 1 h due to its immediate dissolution in biologicalfluids. In short duration of time maximum concentration ofCAP was achieved in blood. Mean plasma concentration of1000C o n c e n t r a t io n ( n g /m l)was observed after 3 success which showed high stability ofCAP at 208. Furthermore, CAP was stable through at leastfor two freeze–thaw cycles.80060040020000246810T im e s ( h )Fig. 4. Mean plasma concentration of CAP after single doserepresenting mean SD (n 5 2)CAP after single dose was 800 ng/mL within 1 h was achieved. Similar pharmacokinetic profiles that were obtainedcorrespond to pharmacokinetic profiles that were previouslyreported in the literature [31, 32].Unauthenticated Downloaded 05/04/22 10:33 PM UTC
Acta Chromatographica 33 (2021) 4, 315–321CONCLUSIONThe proposed method is sensitive, selective, economical andspecific for the determination of CAP in rabbit plasma.Percent RSD was less than 2.0%, which indicates developedmethod is highly precise. The run time of 4.9 min allowedanalysis of large number of samples in shorter time duration.The method was validated over a concentration range of3.125–50 mg/mL (r2 5 999) and possessed good accuracyand precision for monitoring the pharmacokinetics of CAPin rabbits. Consequently, this approach has significance forthe evaluation of CAP in pharmaceutical novel formulationssuch as microgels, multi drug pharmacokinetics and humanplasma. Furthermore, this method can be useful in routinequality control analysis.Conflict of interest: The authors declared there is no conflictof interest, financial or otherwise.ACKNOWLEDGMENTSThe authors are very thankful to Department of PharmacyPractice, Faculty of pharmacy Bahauddin Zakariya University, Multan, Pakistan for the support of this work. Authorsare also thankful to VALOR Pharmaceuticals, Islamabad,Pakistan for gift sample of CAP.REFERENCES1 Sultana, N.; Arayne, M. S.; Naveed, S. Chin. Chem. Soc.-Taip. 2010,57(1), 62–7.2 Ivanovic, D.; Medenica, M.; Malenovic, A.; Jancic, B. Accredit. Qual.Assur. 2004, 9(1–2), 76–81.3 Gadad, A. P.; Reddy, A. D.; Dandagi, P. M.; Masthiholimath, V. S.Asian J. Pharm., 2014, 6(2), 137–43.4 Chikukwa, M. T.; Walker, R. B.; Khamanga, S. M. Pharmaceutics2020, 12(8), 712.5. Poulin, P.; Theil, F. P. J. Pharm. Sci. 2002, 91(1), 129–56.6 Matsuki, Y.; Fukuhara, K.; Ito, T.; Ono, H.; Ohara, N.; Yui, T.;Nambara, T. J. Chromatogr. A 1980, 188(1), 177–83.7 Funke, P. T.; Ivashkiv, E.; Malley, M. F.; Cohen, A. I. Anal. Chem.1980, 52(7), 1086–9.8 Franklin, M.; Addison, R.; Baker, P.; Hooper, W. Biomed. Appl.1998, 705(1), 47–54.3219 Shimada, K.; Tanaka, M.; Nambara, T.; Imai, Y.; Abe, K.; Yoshinaga,K. Biomed. Appl. 1982, 227(2), 445–51.10 Bahmaei, M.; Khosravi, A.; Zamiri, C.; Massoumi, A.; Mahmoudian,M. J. Pharmaceut. Biomed. 1997, 15(8), 1181–6.11 Jarrott, B.; Anderson, A.; Hooper, R.; Louis, W. J. Pharm. Sci. 1981,70(6), 665–7.12 Pereira, C.; Tam, Y.; Collins-Nakai, R.; Ng, P. J. Chromatogr. 1988,425(1), 208–13.13 Hayashi, K.; Miyamoto, M.; Sekine, Y. J. Chromatogr. B: Biomed.Appl. 1985, 338, 161–9.14 Klein, J.; Colin, P.; Scherer, E.; Levy, M.; Koren, G. Ther. DrugMonit. 1990, 12(1), 105–10.15. Khedr, A.; El-Sherief, H. Biomed. Chromatogr. 1998, 12(2), 57–60.16 Salem, I. I.; Saif, W. A.; Jmeian, Y.; Al Tamimi, J. I. J. Pharmaceut.Biomed. 37(5), 2005, 1073–80.17 P erez-Ruiz, T.; Mart ınez-Lozano, C.; Galera, R. Electrophoresis27(12), 2006, 2310–6.18 P erez-Ruiz, T.; Mart ınez-Lozano, C.; Sanz, A.; Galera, R. Electrophoresis 2005, 26(12), 2384–90.19 Muhammad Ranjha, N.; Majeed, A.; Hussain, I.; Fawad Rasool, M.Curr. Pharm. Anal. 2017, 13(5), 446–51.20 Ayad, M. M.; Hosny, M. M.; Ibrahim, A. E.; El-Abassy, O. M.; Belal,F. F. Acta Chromatogr. 2020, 1–6.21 Abbas, G.; Saadullah, M.; Rasul, A.; Shah, S.; Khan, S. M.;Hanif, M.; Masood Ahmed, M. Acta Chromatogr. 2020, 32(3),157–65.22. Zuo, Y. High-performance liquid chromatography (HPLC): Principles, practices and procedures. Nova Science Publishers, Incorporated; 2014.23. Zuo, Y.; Wang, C.; J. Zhou; Sachdeva, A.; Ruelos, V. C. Anal. Sci.2008, 24(12), 1589–92.24. Zuo, R.; Zhou, S.; Zuo, Y.; Deng, Y. Food Chem. 2015, 182 242–5.25. Zhou, S.; Zuo, R.; Zhu, Z.; Wu, D.; Vasa, K.; Deng, Y.; Zuo, Y. Anal.Methods 2013, 5(5), 1307–11.26. Guideline, I. H. T. In Validation of analytical procedures: text andmethodology Q2 (R1); International Conference on Harmonization,Geneva, Switzerland; 2005.27 Tran, Q. H.; Nguyen, T. T.; Pham, K. P. Int. J. Anal. Chem. 2020, 2020.28. Surve, D. H.; Jindal, A. B. J. Pharmaceut. Biomed. 2019, 175,112765.29 Syed, H. K.; Liew, K. B.; Loh, G. O. K.; Peh, K. K. Food Chem. 2015,170 321–6.30 Sultana, N.; Arayne, M. S.; Naveed, S. J. Chin. Chem. Soc.-Taip.2010, 57(3A), 378–83. 31 Banoglu, E.; Ozkan,Y.; Atay, O. Il Farmaco 2000, 55(6–7), 477–83.32 Huang, T.; He, Z.; Yang, B.; Shao, L.; Zheng, X.; Duan, G.J. Pharmaceut. Biomed. 2006, 41(2), 644–8.Open Access. This is an open-access article distributed under the terms of the Creative Commons Attribution-NonCommercial 4.0 International License (https://creativecommons.org/licenses/by-nc/4.0/), which permits unrestricted use, distribution, and reproduction in any medium for non-commercial purposes, provided theoriginal author and source are credited, a link to the CC License is provided, and changes – if any – are indicated.Unauthenticated Downloaded 05/04/22 10:33 PM UTC
high quantity of plasma which is not easily available in all populations. Among these methods, reversed phase high performance liquid chromatography (RP-HPLC) is the mostly used because of high sensitivity and selectivity and economical [19–