Transcription
UC Berkeley College of ChemistryChemistry 105Instrumental Methods in Analytical ChemistryReverse-Phase High-PerformanceLiquid Chromatography Analysis ofBiomoleculesShort ReportLab Partners:Author:Jonathan MelvilleJake Precht, Phuong Tran, and Jeremy HsuGraduate Student Instructors:Richard Cooper & Daniel MortensenApril 23, 2014
1TheoryRP-HPLC, or Reverse-Phase High-Performance Liquid Chromatography is a type of chromatography the features a liquid mobile phase, higher resolving power than traditionalliquid chromatography, and a specific combination of stationary- and mobile-phases thatresults in separations that are the opposite of a “traditional” HPLC. Chromatography, in general, utilizes the flow of a “mobile-phase” containing the analyte througha “stationary-phase” – depending on the intermolecular forces of attraction between theindividual analytes and the stationary- and mobile-phases, the various components ofthe sample will exit the chromatographic “column” at different times[?] . A substancethat experiences greater intermolecular forces of attraction to the stationary-phase willbe slowed, and will exit the column later than a substance without such attraction. Ifthe mobile-phase is a liquid (as opposed to, say, a gas), the process is considered “liquidchromatography”; HPLC improves upon this process by pumping a pressurized liquidmobile-phase through an adsorbant stationary-phase, yielding far greater separation andresolving power than regular gravitationally-run liquid chromatography. The labelling“reverse-phase” is far more arbitrary in origin – historically, chromatographic columnsutilized a polar stationary-phase and a nonpolar mobile-phase; “reverse-phase chromatography”, by contrast, uses a nonpolar stationary-phase and a polar mobile-phase, resultingin an inverted separation from “normal-phase” chromatography: more polar analytes willtend to elute earlier due to decreased interaction with the now-nonpolar stationary-phase.Because of its versatility, ease-of-use, and superior separation, HPLC is one of themost commonly-used classes of chromatography (itself one of the most common analyticalmethods), along with other methods like gas chromatography and column chromatography.2Results and DiscussionThis section contains only tabulated results from the Appendix. Derivations can be foundin Appendix A on page 5. Graphs can be found in Appendix B on page 12. Raw data1
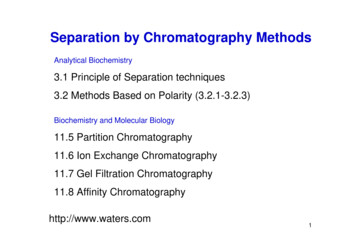
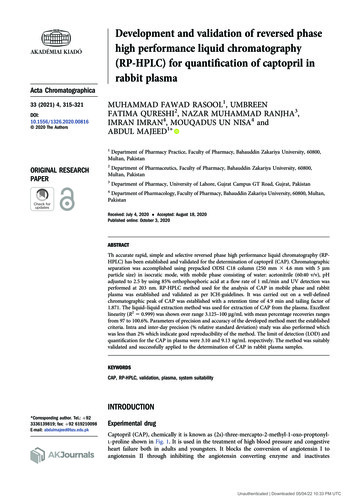
Figure 1: Methionine, a nonpolar amino acid and one of our peptidescan be found in Appendix A.1 on page 5.2.1ResultsDue to experimental failures that are detailed further in the appendix, we were unableto absolutely and quantitatively determine the concentration of peptides in our unknownsample. However, we were able to determine the ratios of peptides in our sample relativeto the concentration of our calibration samples:Peak 1:4.1349840.6316 0.0517850.0123122 1690. ppm (relative)Peak 2:11.9641115.3068 0.024430.0328822.2 131.3 ppm (relative) (?!)Accuracy and ErrorOf course, our accuracy in this experiment was exceedingly low. Ignoring the fact that weare missing a crucial piece of data to turn our relative concentration values into absoluteones (due to a failure for the instrument to read our sample, no less), the data we do haveconspires to give us abysmal fits that lead to nonsensical data. A brief examination ofour calibration curves shows that our error bars are gigantic and our R2 values abysmal(even, in one case, producing a negative slope that directly caused the apparently negativeconcentration of peptide seen above). Because of the vast amounts of missing data pointsin our tables (every N/A was a point not found on the instrument), we are simply notable to calculate anything with any degree of confidence.2
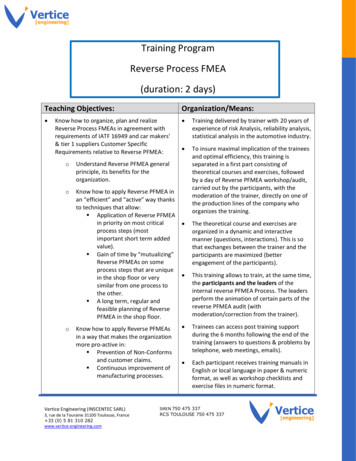
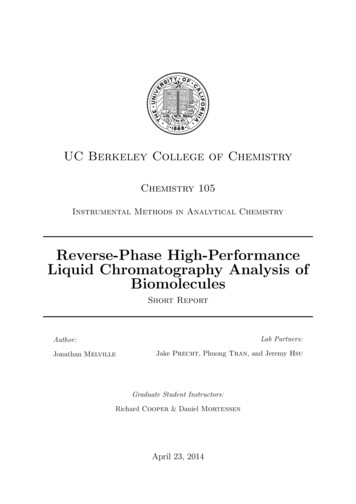
Figure 2: Bradykinin, a blood-vessel-dilating peptide that is comparatively polar2.3DiscussionWhile we cannot make many quantitative statements about the success of our experiment,we can still state certain facts with a reasonable degree of certainty. We can, for instance,determine the identity of the first and second peaks eluted by looking at the structuresof the two peptides analyzed.Methionine, the first peptide, is a rather small essential amino acid and is largelynonpolar in character due to the presence of a fairly lengthy alkyl chain. Comparedto the much larger bradykinin, enriched with numerous amines, amides, imines, andaromatic groups, we can say with a reasonable amount of certainty that the first peakis that of bradykinin and the second is methionine. Because we are performing reversephase HPLC, our stationary phase is a rather waxy resin with long alkyl chains thatgive it significant nonpolar character, whereas our mobile phases are comparatively polarin nature. As a result, the more nonpolar methionine is more slowed by intermolecularinteractions with the stationary phase, allowing the more polar bradykinin to elute first.Our data was analyzed using the HPLC’s built-in light source, an Agilent 1100/1200Diode Array Detector that filters light from a tungsten-filament bulb through a couplinglens, a deuterium lamp, an achromatic lens, a holmium oxide filter, a support lens, aflow cell, and a spectro lens befor finally passing through a programmable slit and ontoa grating which projects a final spectrum[3] . Because our sample only called for UVirradiation and not visible light (a detail noticeable in the ACQ.TXT data reports), onlythe deuterium lamp is used.Because of the data loss that plagued this entire experiment, we are unable to calculate the niceties of our isocratic separations, such as the number of theoretical plates.3
For the exact same reasons, we are unable to determine the amount of peptide in ourunknown sample. We were able to determine the relative concentrations (1690. ppm and-131.3 ppm) by using the relative response factor, but even this approach is unhelpful dueto abysmal correlation coefficients (ranging from 0.65 to 0.05) and simply nonsensical answers (negative concentration?!). While it is possible that our poor outputs are the resultof detection limits and exceeding the linear range of the instrument, it is unlikely that oursamples deviated so significantly from reasonable values that virtually none of them wereable to construct a decent fit. Changing the wavelength of the detector would changethe response factors of our analytes; methionine, containing little to no π-conjugation,is likely not an exceptional absorber compared to bradykinin, which has large, extendedπsystems that likely absorb electrons of UV/Vis light readily. This also explains thecomparatively lower absorption values of methionine compared to bradykinin.Nevertheless, the many flaws that riddled this experiment were likely a result of poorexperimental preparation and instrumental methods rather than shortcomings of theHPLC instrument itself. Because our group was one of the last groups to complete thislab, we were forced to make do with insufficient quantities of peptide starting material,and whilst coordinating our sample preparation with another group we inadvertentlyscrewed up the preparation of several of our samples. We most likely failed to get allof our results out of the HPLC due to a combination of this experimental error andincorrect setup of the HPLC methods, causing several of our key analytical data pointsto be dropped. Worst of all, we were unable to recreate and rerun our samples becausewe had run out of lab time over the semester with which to attempt to fix our mistakes.HPLC is a useful analytical method, even over other comparable separation methodslike electrophoresis or other forms of chromatography, because it combines the relativeease-of-use of many chromatographic methods with the high-precision data that manymore qualitative chromatographic methods lack.4
References[1] SHU HPLC ; Yuri Kazakevich. http://hplc.chem.shu.edu/ (accessed April 22, 2014).[2] ccessed Apr 19, 2014).ACalculationsA.1Peak Resolution DataRA,B 2 tret,A tret,BWA WBRA,B peak resolutiontret retention timeW baseline widthA.1.11000 ppm std.TrialMethodPeak 1 (min)Peak 2 (min)Peak 1 widthPeak 2 CN/AN/AN/AN/AN/A3CN/AN/AN/AN/AN/AA.1.2500 ppm std.TrialMethodPeak 1 (min)Peak 2 (min)Peak 1 widthPeak 2 0.17623.44827586215
A.1.3100 ppm std.TrialMethodPeak 1 (min)Peak 2 (min)Peak 1 widthPeak 2 2.198N/A0.16N/A9CN/A2.341N/A0.187N/AA.1.410 ppm std.TrialMethodPeak 1 (min)Peak 2 (min)Peak 1 widthPeak 2 .2123.0174563591A.1.51 ppm std.TrialMethodPeak 1 (min)Peak 2 (min)Peak 1 widthPeak 2 1713.5643044619A.1.60.1 ppm std.TrialMethodPeak 1 (min)Peak 2 (min)Peak 1 widthPeak 2 1863.50270270276
A.1.7Unknown SolutionTrialMethodPeak 1 (min)Peak 2 (min)Peak 1 widthPeak 2 3A.1.8Bradykinin std.TrialMethodPeak 1 (min)Peak 2 (min)Peak 1 widthPeak 2 widthResolutionN/AN/AN/AN/AN/AN/AN/ABradykinin Error Log443 41e0 53462317MethodMethod started:67 41e0 53462319MethodCP MacroCP Macro21:51:21 04/09/14021:51:21 04/09/14021:51:21 04/09/145001 Error Method started67 41e0 5346234bMethod0Data not available; Data Analysis not doned5 1da7 5346234bALS21:51:21 04/09/14Analyzing rawdata 080-2001.D70 41de 5346234921:50:33 04/09/14500Missing Vial, no Run possible70 41de 5346234921:50:31 04/09/1401 Missing vial (80)67 41e0 53462349Methodline# 20 vial# 80 inj# 1Instrument running sample Vial 80fb3 1da7 53462349ALS021:51:23 04/09/140Method completed21:51:23 04/09/147
A.1.9Methionine std.TrialMethodPeak 1 (min)Peak 2 (min)Peak 1 widthPeak 2 widthResolutionN/AN/AN/AN/AN/AN/AN/AMethionine Error Log443 41e0 534625d5MethodMethod started:67 41e0 534625d7MethodALSMethodCP MacroCP Macro022:02:57 04/09/14022:02:57 04/09/145001 Error Method started67 41e0 5346260322:02:57 04/09/140Data not available; Data Analysis not doned5 1da7 53462603A.222:02:56 04/09/14Analyzing rawdata 081-2201.D70 41de 5346260122:02:15 04/09/14500Missing Vial, no Run possible70 41de 5346260122:02:13 04/09/1401 Missing vial (81)67 41e0 53462601Methodline# 22 vial# 81 inj# 1Instrument running sample Vial 81fb3 1da7 53462600ALS022:02:59 04/09/140Method completed22:02:59 04/09/14Bradykinin and Methionine CalibrationThese calibration curves could not be created, due to a lack of any data (whatsoever)from their respective samples1 . As a result, we are completely unable to create calibrationcurves for these analytes, as well as calculating LoD or quantitative determination of theunknown peptide mixture, due to the lack of a known standard to use as a reference.Nevertheless, we will attempt to answer as many of these questions as possible using1See error logs on pages 7 and 8.8
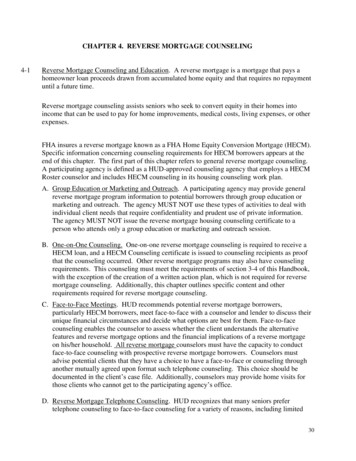
relative values.Based on the error logs, it is likely that human error was responsible for this dataloss, as the samples simply failed to run. This could be caused by an incorrect method orby physical misplacement of the samples into the HPLC chamber. Whatever the cause,however, there is no way for us to make up for this lost information (by interpolation orthe like) because there is simply no data to interpolate from.A.3fi Response Factor CalculationAifAstd stdBecause of the limitations detailed earlier regarding the peptide standards, we areunable to calculate absolute response factor and must settle for relative response factor:fri fifstd AiAstdWe can calculate this value by plotting analyte concentration against response (in theform of area or height) and taking the slope of the best-fit line.Unfortunately, in this instance “best-fit” may be a misnomer. “Mediocre-fit” is probably more accurate.9
10
Based on these graphs, we receive the following relative response factors (averagingout over multiple injections; injections were plotted separately because the data pointswere clearly stratified):Peakfri,1fri,2,3fri,avgPeak 1.012312 .051785 .03205Peak 2.03288A.4-.02443.00844Relative Unknown ConcentrationsUsing the previously calculated relative response factors, it is possible to calculate “relative unknown concentrations” in terms of the calibration solutions we created for curvefitting. Because our “1000 ppm” standard does not actually contain 1000 ppm of bothpeptides, these “relative concentrations” are ratios to the actual concentration of thestandards created, something we could determine quantitatively if our reference valueshad not been lost.Peak 1:40.63164.13498 0.0517850.0123122 1690. ppm (relative)Peak 2:11.9641115.3068 0.024430.032882 131.3 ppm (relative) (?!)11
A.5Detection LimitsOnce again, without concrete values to pin our relative numbers to, we cannot quantitatively determine this value. Qualitatively, however, a cursory glance at the error bars ofour “calibration curves” assures us that hitting the detection limit is likely the least ofour worries.BChromatographs12
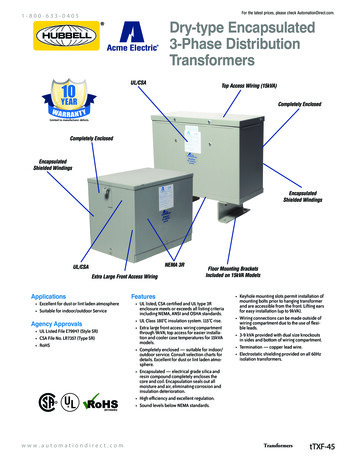
Data File C:\CHEM32\1\DATA\9 APRIL 2014\CHEM105 2014-04-09 14-47-10\071-0201.DSample Name: 1000Standard Acq. Operator: Chem 105Seq. Line :2Acq. Instrument : 305 Lat HPLCLocation : Vial 71Injection Date : 4/9/2014 2:59:51 PMInj :1Inj Volume : 20.0 µlSequence File: C:\Chem32\1\DATA\9 APRIL 2014\CHEM105 2014-04-09 14-47-10\CHEM105.SMethod: C:\CHEM32\1\DATA\9 APRIL 2014\CHEM105 2014-04-09 14-47-10\CHEM105C.MLast changed: 4/2/2014 2:18:05 PM by Chem 1051.134DAD1 A, Sig 254,4 Ref 360,100 (071-0201.D)mAU60502.3114030202.1681000123456789 Area Percent Report Sorted By:SignalMultiplier::1.0000Dilution::1.0000Use Multiplier & Dilution Factor with ISTDsSignal 1: DAD1 A, Sig 254,4 Ref 360,100Peak RetTime Type WidthAreaHeightArea#[min][min][mAU*s][mAU]%---- ------- ---- ------- ---------- ---------- -------- 11.134 BB0.1262 550.5673265.42467 59.512122.168 BV0.2501 100.074944.98669 10.817332.311 VB0.1326 274.4924933.14954 29.6705Totals :925.13476103.56089 *** End of Report ***305 Lat HPLC 4/9/2014 3:10:05 PM Chem 105Page1 of 1min
Data File C:\CHEM32\1\DATA\9 APRIL 2014\CHEM105 2014-04-09 14-47-10\071-0202.DSample Name: 1000Standard Acq. Operator: Chem 105Seq. Line :2Acq. Instrument : 305 Lat HPLCLocation : Vial 71Injection Date : 4/9/2014 3:11:27 PMInj :2Inj Volume : 20.0 µlSequence File: C:\Chem32\1\DATA\9 APRIL 2014\CHEM105 2014-04-09 14-47-10\CHEM105.SMethod: C:\CHEM32\1\DATA\9 APRIL 2014\CHEM105 2014-04-09 14-47-10\CHEM105C.MLast changed: 4/2/2014 2:18:05 PM by Chem 105DAD1 A, Sig 254,4 Ref 360,100 (071-0202.D)mAU-1.5-2-2.5-3-3.5-40123456789 Area Percent Report Sorted By:SignalMultiplier::1.0000Dilution::1.0000Use Multiplier & Dilution Factor with ISTDsNo peaks found *** End of Report ***305 Lat HPLC 4/9/2014 3:21:41 PM Chem 105Page1 of 1min
Data File C:\CHEM32\1\DATA\9 APRIL 2014\CHEM105 2014-04-09 14-47-10\071-0203.DSample Name: 1000Standard Acq. Operator: Chem 105Seq. Line :2Acq. Instrument : 305 Lat HPLCLocation : Vial 71Injection Date : 4/9/2014 3:23:03 PMInj :3Inj Volume : 20.0 µlSequence File: C:\Chem32\1\DATA\9 APRIL 2014\CHEM105 2014-04-09 14-47-10\CHEM105.SMethod: C:\CHEM32\1\DATA\9 APRIL 2014\CHEM105 2014-04-09 14-47-10\CHEM105C.MLast changed: 4/2/2014 2:18:05 PM by Chem 105DAD1 A, Sig 254,4 Ref 360,100 23456789 Area Percent Report Sorted By:SignalMultiplier::1.0000Dilution::1.0000Use Multiplier & Dilution Factor with ISTDsNo peaks found *** End of Report ***305 Lat HPLC 4/9/2014 3:33:18 PM Chem 105Page1 of 1min
Data File C:\CHEM32\1\DATA\9 APRIL 2014\CHEM105 2014-04-09 14-47-10\072-0401.DSample Name: 500Standard Acq. Operator: Chem 105Seq. Line :4Acq. Instrument : 305 Lat HPLCLocation : Vial 72Injection Date : 4/9/2014 3:45:31 PMInj :1Inj Volume : 20.0 µlSequence File: C:\Chem32\1\DATA\9 APRIL 2014\CHEM105 2014-04-09 14-47-10\CHEM105.SMethod: C:\CHEM32\1\DATA\9 APRIL 2014\CHEM105 2014-04-09 14-47-10\CHEM105A.MLast changed: 3/18/2014 3:50:33 PM by Chem 1056.440DAD1 A, Sig 254,4 Ref 360,100 .19120-1002468min Area Percent Report Sorted By:SignalMultiplier::1.0000Dilution::1.0000Use Multiplier & Dilution Factor with ISTDsSignal 1: DAD1 A, Sig 254,4 Ref 360,100Peak RetTime Type WidthAreaHeightArea#[min][min][mAU*s][mAU]%---- ------- ---- ------- ---------- ---------- -------- 11.209 BB0.1403 495.9514253.40386 31.428722.113 BV0.2614 103.359914.758206.550032.191 VV0.085780.6233412.105835.109142.501 VV0.167065.417535.918534.145554.843 BB0.11558.373281.091580.530666.440 BV0.1376 533.2204656.76577 33.790576.697 VV0.1579 291.0736726.97762 18.4455Totals :1578.01961305 Lat HPLC 4/9/2014 3:55:43 PM Chem 105161.02139Page1 of 2
Data File C:\CHEM32\1\DATA\9 APRIL 2014\CHEM105 2014-04-09 14-47-10\072-0401.DSample Name: 500Standard *** End of Report ***305 Lat HPLC 4/9/2014 3:55:43 PM Chem 105Page2 of 2
Data File C:\CHEM32\1\DATA\9 APRIL 2014\CHEM105 2014-04-09 14-47-10\072-0402.DSample Name: 500Standard Acq. Operator: Chem 105Seq. Line :4Acq. Instrument : 305 Lat HPLCLocation : Vial 72Injection Date : 4/9/2014 3:57:07 PMInj :2Inj Volume : 20.0 µlSequence File: C:\Chem32\1\DATA\9 APRIL 2014\CHEM105 2014-04-09 14-47-10\CHEM105.SMethod: C:\CHEM32\1\DATA\9 APRIL 2014\CHEM105 2014-04-09 14-47-10\CHEM105A.MLast changed: 3/18/2014 3:50:33 PM by Chem 1050.875DAD1 A, Sig 254,4 Ref 360,100 20-40-500123456789 Area Percent Report Sorted By:SignalMultiplier::1.0000Dilution::1.0000Use Multiplier & Dilution Factor with ISTDsSignal 1: DAD1 A, Sig 254,4 Ref 360,100Peak RetTime Type WidthAreaHeightArea#[min][min][mAU*s][mAU]%---- ------- ---- ------- ---------- ---------- -------- 10.875 BV0.3477 1113.1934839.63150 48.583121.513 VV0.041515.755485.486660.687632.022 VV0.2473 594.3069530.24431 25.937342.122 VV0.1684 382.4687228.53759 16.692156.060 BV0.2640 118.480676.282185.170966.332 VV0.193467.113464.677872.9290Totals :2291.31877305 Lat HPLC 4/9/2014 4:07:19 PM Chem 105114.86010Page1 of 2min
Data File C:\CHEM32\1\DATA\9 APRIL 2014\CHEM105 2014-04-09 14-47-10\072-0402.DSample Name: 500Standard *** End of Report ***305 Lat HPLC 4/9/2014 4:07:19 PM Chem 105Page2 of 2
Data File C:\CHEM32\1\DATA\9 APRIL 2014\CHEM105 2014-04-09 14-47-10\072-0403.DSample Name: 500Standard Acq. Operator: Chem 105Seq. Line :4Acq. Instrument : 305 Lat HPLCLocation : Vial 72Injection Date : 4/9/2014 4:08:42 PMInj :3Inj Volume : 20.0 µlSequence File: C:\Chem32\1\DATA\9 APRIL 2014\CHEM105 2014-04-09 14-47-10\CHEM105.SMethod: C:\CHEM32\1\DATA\9 APRIL 2014\CHEM105 2014-04-09 14-47-10\CHEM105A.MLast changed: 3/18/2014 3:50:33 PM by Chem 1050.873DAD1 A, Sig 254,4 Ref 360,100 14901.450-30-400123456789 Area Percent Report Sorted By:SignalMultiplier::1.0000Dilution::1.0000Use Multiplier & Dilution Factor with ISTDsSignal 1: DAD1 A, Sig 254,4 Ref 360,100Peak RetTime Type WidthAreaHeightArea#[min][min][mAU*s][mAU]%---- ------- ---- ------- ---------- ---------- -------- 10.873 BV0.3515 1115.8868439.03070 48.807021.450 VV0.06595.075101.289020.222031.893 VV0.1489 300.4579526.36786 13.141541.969 VV0.0733 139.6346426.571476.107452.076 VV0.0780 158.5137028.016826.933162.149 VV0.1589 333.2902527.98861 14.577676.156 BV0.3180 147.915666.252996.469686.485 VV0.210185.549845.361733.7418Totals :2286.32399305 Lat HPLC 4/9/2014 4:18:57 PM Chem 105160.87920Page1 of 2min
Data File C:\CHEM32\1\DATA\9 APRIL 2014\CHEM105 2014-04-09 14-47-10\072-0403.DSample Name: 500Standard *** End of Report ***305 Lat HPLC 4/9/2014 4:18:57 PM Chem 105Page2 of 2
Data File C:\CHEM32\1\DATA\9 APRIL 2014\CHEM105 2014-04-09 14-47-10\073-0601.DSample Name: 100Standard Acq. Operator: Chem 105Seq. Line :6Acq. Instrument : 305 Lat HPLCLocation : Vial 73Injection Date : 4/9/2014 4:31:13 PMInj :1Inj Volume : 20.0 µlSequence File: C:\Chem32\1\DATA\9 APRIL 2014\CHEM105 2014-04-09 14-47-10\CHEM105.SMethod: C:\CHEM32\1\DATA\9 APRIL 2014\CHEM105 2014-04-09 14-47-10\CHEM105A.MLast changed: 3/18/2014 3:50:33 PM by Chem 1051.146DAD1 A, Sig 254,4 Ref 360,100 1002468min Area Percent Report Sorted By:SignalMultiplier::1.0000Dilution::1.0000Use Multiplier & Dilution Factor with ISTDsSignal 1: DAD1 A, Sig 254,4 Ref 360,100Peak RetTime Type WidthAreaHeightArea#[min][min][mAU*s][mAU]%---- ------- ---- ------- ---------- ---------- -------- 11.146 BB0.1168 353.1389847.47415 39.804722.110 BV0.229597.195345.16706 10.955532.195 VV0.083878.5872112.428978.858142.462 VV0.147674.404787.259968.386756.386 BV0.1241 202.5648223.59933 22.832566.667 VV0.147681.288278.065729.1626Totals :887.17940305 Lat HPLC 4/9/2014 4:41:26 PM Chem 105103.99518Page1 of 2
Data File C:\CHEM32\1\DATA\9 APRIL 2014\CHEM105 2014-04-09 14-47-10\073-0601.DSample Name: 100Standard *** End of Report ***305 Lat HPLC 4/9/2014 4:41:26 PM Chem 105Page2 of 2
Data File C:\CHEM32\1\DATA\9 APRIL 2014\CHEM105 2014-04-09 14-47-10\073-0602.DSample Name: 100Standard Acq. Operator: Chem 105Seq. Line :6Acq. Instrument : 305 Lat HPLCLocation : Vial 73Injection Date : 4/9/2014 4:42:51 PMInj :2Inj Volume : 20.0 µlSequence File: C:\Chem32\1\DATA\9 APRIL 2014\CHEM105 2014-04-09 14-47-10\CHEM105.SMethod: C:\CHEM32\1\DATA\9 APRIL 2014\CHEM105 2014-04-09 14-47-10\CHEM105A.MLast changed: 3/18/2014 3:50:33 PM by Chem 1050.852DAD1 A, Sig 254,4 Ref 360,100 0123456789 Area Percent Report Sorted By:SignalMultiplier::1.0000Dilution::1.0000Use Multiplier & Dilution Factor with ISTDsSignal 1: DAD1 A, Sig 254,4 Ref 360,100Peak RetTime Type WidthAreaHeightArea#[min][min][mAU*s][mAU]%---- ------- ---- ------- ---------- ---------- -------- 10.852 BV0.3558 1071.7044738.37623 56.652321.455 VV0.086610.962651.811070.579532.063 VV0.2603 493.3574524.36183 26.079842.138 VV0.1800 244.3564822.62403 12.917156.165 BV0.252871.341303.803283.7712Totals :1891.7223490.97643 305 Lat HPLC 4/9/2014 4:53:05 PM Chem 105Page1 of 1min
Data File C:\CHEM32\1\DATA\9 APRIL 2014\CHEM105 2014-04-09 14-47-10\073-0603.DSample Name: 100Standard Acq. Operator: Chem 105Seq. Line :6Acq. Instrument : 305 Lat HPLCLocation : Vial 73Injection Date : 4/9/2014 4:54:31 PMInj :3Inj Volume : 20.0 µlSequence File: C:\Chem32\1\DATA\9 APRIL 2014\CHEM105 2014-04-09 14-47-10\CHEM105.SMethod: C:\CHEM32\1\DATA\9 APRIL 2014\CHEM105 2014-04-09 14-47-10\CHEM105A.MLast changed: 3/18/2014 3:50:33 PM by Chem 1050.820DAD1 A, Sig 254,4 Ref 360,100 30-400123456789 Area Percent Report Sorted By:SignalMultiplier::1.0000Dilution::1.0000Use Multiplier & Dilution Factor with ISTDsSignal 1: DAD1 A, Sig 254,4 Ref 360,100Peak RetTime Type WidthAreaHeightArea#[min][min][mAU*s][mAU]%---- ------- ---- ------- ---------- ---------- -------- 10.820 BV0.3312 995.7688637.81387 51.888521.464 VV0.090127.896264.167531.453631.568 VV0.052425.149477.633291.310541.880 VV0.1588 264.8377421.33795 13.800452.044 VV0.2770 533.5647623.49139 27.803566.241 BV0.292271.839783.271333.7435Totals :1919.05686305 Lat HPLC 4/9/2014 5:04:46 PM Chem 10597.71537Page1 of 2min
Data File C:\CHEM32\1\DATA\9 APRIL 2014\CHEM105 2014-04-09 14-47-10\073-0603.DSample Name: 100Standard *** End of Report ***305 Lat HPLC 4/9/2014 5:04:46 PM Chem 105Page2 of 2
Data File C:\CHEM32\1\DATA\9 APRIL 2014\CHEM105 2014-04-09 14-47-10\074-0801.DSample Name: 100Standard Acq. Operator: Chem 105Seq. Line :8Acq. Instrument : 305 Lat HPLCLocation : Vial 74Injection Date : 4/9/2014 5:17:05 PMInj :1Inj Volume : 20.0 µlSequence File: C:\Chem32\1\DATA\9 APRIL 2014\CHEM105 2014-04-09 14-47-10\CHEM105.SMethod: C:\CHEM32\1\DATA\9 APRIL 2014\CHEM105 2014-04-09 14-47-10\CHEM105B.MLast changed: 4/2/2014 2:00:08 PM by Chem 105DAD1 A, Sig 254,4 Ref 360,100 3456789 Area Percent Report Sorted By:SignalMultiplier::1.0000Dilution::1.0000Use Multiplier & Dilution Factor with ISTDsSignal 1: DAD1 A, Sig 254,4 Ref 360,100Peak RetTime Type WidthAreaHeightArea#[min][min][mAU*s][mAU]%---- ------- ---- ------- ---------- ---------- -------- 11.108 BB0.1259 377.3036846.85508 58.607122.104 BV0.2398 110.272725.59915 17.128832.190 VV0.081081.8142113.08161 12.708342.471 VV0.157274.394336.93048 11.5558Totals :643.7849372.46632 *** End of Report ***305 Lat HPLC 4/9/2014 5:27:18 PM Chem 105Page1 of 1min
Data File C:\CHEM32\1\DATA\9 APRIL 2014\CHEM105 2014-04-09 14-47-10\074-0802.DSample Name: 100Standard Acq. Operator: Chem 105Seq. Line :8Acq. Instrument : 305 Lat HPLCLocation : Vial 74Injection Date : 4/9/2014 5:28:44 PMInj :2Inj Volume : 20.0 µlSequence File: C:\Chem32\1\DATA\9 APRIL 2014\CHEM105 2014-04-09 14-47-10\CHEM105.SMethod: C:\CHEM32\1\DATA\9 APRIL 2014\CHEM105 2014-04-09 14-47-10\CHEM105B.MLast changed: 4/2/2014 2:00:08 PM by Chem 105DAD1 A, Sig 254,4 Ref 360,100 123456789 Area Percent Report Sorted By:SignalMultiplier::1.0000Dilution::1.0000Use Multiplier & Dilution Factor with ISTDsSignal 1: DAD1 A, Sig 254,4 Ref 360,100Peak RetTime Type WidthAreaHeightArea#[min][min][mAU*s][mAU]%---- ------- ---- ------- ---------- ---------- -------- 11.477 BV0.105829.457084.006564.034022.011 VV0.2417 400.0751621.64254 54.788332.089 VV0.1815 300.6877720.94538 41.1777Totals :730.2200146.59448 *** End of Report ***305 Lat HPLC 4/9/2014 5:38:57 PM Chem 105Page1 of 1min
Data File C:\CHEM32\1\DATA\9 APRIL 2014\CHEM105 2014-04-09 14-47-10\074-0803.DSample Name: 100Standard Acq. Operator: Chem 105Seq. Line :8Acq. Instrument : 305 Lat HPLCLocation : Vial 74Injection Date : 4/9/2014 5:40:23 PMInj :3Inj Volume : 20.0 µlSequence File: C:\Chem32\1\DATA\9 APRIL 2014\CHEM105 2014-04-09 14-47-10\CHEM105.SMethod: C:\CHEM32\1\DATA\9 APRIL 2014\CHEM105 2014-04-09 14-47-10\CHEM105B.MLast changed: 4/2/2014 2:00:08 PM by Chem 105DAD1 A, Sig 254,4 Ref 360,100 .506-402468min Area Percent Report Sorted By:SignalMultiplier::1.0000Dilution::1.0000Use Mult
RP-HPLC, or Reverse-Phase High-Performance Liquid Chromatography is a type of chro-matography the features a liquid mobile phase, higher resolving power than traditional liquid chromatography, and a speci c combination of stationary- and mobile-phases that results in separations th