Transcription
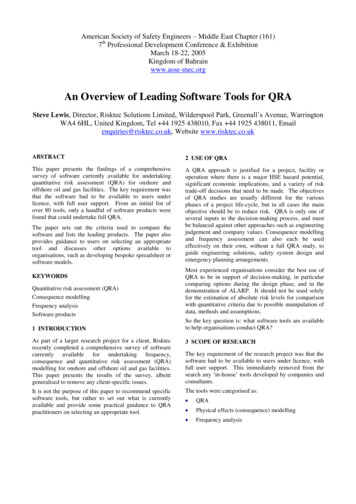
American Society of Safety Engineers –Middle East Chapter (161)7th Professional Development Conference & ExhibitionMarch 18-22, 2005Kingdom of Bahrainwww.asse-mec.orgAn Overview of Leading Software Tools for QRASteve Park,Greenall’sAvenue,WarringtonWA4 6HL, United Kingdom, Tel 44 1925 438010, Fax 44 1925 438011, Emailenquiries@risktec.co.uk, Website www.risktec.co.ukABSTRACT2 USE OF QRAThis paper presents the findings of a comprehensivesurvey of software currently available for undertakingquantitative risk assessment (QRA) for onshore andoffshore oil and gas facilities. The key requirement wasthat the software had to be available to users underlicence, with full user support. From an initial list ofover 80 tools, only a handful of software products werefound that could undertake full QRA.A QRA approach is justified for a project, facility oroperation where there is a major HSE hazard potential,significant economic implications, and a variety of risktrade-off decisions that need to be made. The objectivesof QRA studies are usually different for the variousphases of a project life-cycle, but in all cases the mainobjective should be to reduce risk. QRA is only one ofseveral inputs to the decision-making process, and mustbe balanced against other approaches such as engineeringjudgement and company values. Consequence modellingand frequency assessment can also each be usedeffectively on their own, without a full QRA study, toguide engineering solutions, safety system design andemergency planning arrangements.The paper sets out the criteria used to compare thesoftware and lists the leading products. The paper alsoprovides guidance to users on selecting an appropriatetool and discusses other options available toorganisations, such as developing bespoke spreadsheet orsoftware models.Quantitative risk assessment (QRA)Consequence modellingFrequency analysisSoftware productsMost experienced organisations consider the best use ofQRA to be in support of decision-making, in particularcomparing options during the design phase, and in thedemonstration of ALARP. It should not be used solelyfor the estimation of absolute risk levels for comparisonwith quantitative criteria due to possible manipulation ofdata, methods and assumptions.1 INTRODUCTIONSo the key question is: what software tools are availableto help organisations conduct QRA?KEYWORDSAs part of a larger research project for a client, Risktecrecently completed a comprehensive survey of softwarecurrently available for undertaking frequency,consequence and quantitative risk assessment (QRA)modelling for onshore and offshore oil and gas facilities.This paper presents the results of the survey, albeittgeneralised to remove any client-specific issues.3 SCOPE OF RESEARCHIt is not the purpose of this paper to recommend specificsoftware tools, but rather to set out what is currentlyavailable and provide some practical guidance to QRApractitioners on selecting an appropriate tool.The tools were categorised as:The key requirement of the research project was that thesoftware had to be available to users under licence, withfull user support. This immediately removed from thesearch any ‘in-house’tools developed by companies andconsultants. QRA Physical effects (consequence) modelling Frequency analysis
Excluded from the scope were tools specifically designedfor: Maintainability analysis (e.g. RCM Toolkit)Face-to-face demonstrations of leading QRA models(NEPTUNE, SAFETI and SHEPHERD DESKTOP) wereprovided by the software suppliers to confirm details oftheir functionality. These included their consequencemodels PHAST and FRED. Structural response analysis (e.g. ANSYS, DYNA3D, USFOS)5 LEADING SOFTWARE TOOLS Project risk analysis (e.g. Active Risk Manager) Evacuation models (e.g. EXODUS, EGRESS) Human factors analysis (e.g. HEART)4 RESEARCH METHODAn initial list of over 80 software tools was identified bysearching the internet and visiting the websites of thesoftware providers. Information was documented foreach tool on three key aspects: scope (i.e. scientificcontent), validation status of the model and user-relatedaspects.From this list, a subset of ‘leading’software providerswas selected based on criteria including: user base,validation of the software model, ease of use andresources required, quality of product support, andcontinuous improvement. A total of 18 consequence, 16frequency and 6 QRA leading tools were selected forfurther scrutiny.An initial desktop assessment was then made of each ofthese leading tools to determine whether the tool is ableto conduct the range of calculations required for a fullQRA without the need for other, separate, ‘off-line’calculations. Over 80 calculation requirements werereviewed, covering: Risk measures Risk presentation Physical effects modelling Impact, vulnerability, escalation modelling Frequency modelling Cost-benefit analysis Sensitivity and uncertainty analysis Hydrocarbon and non-hydrocarbon hazardsThis initial assessment was made based on informationreadily and publicly available from the software websites,supplemented in some cases by previous experience ofusing the tools.The initial assessment was then issued to the providers tocorrect any errors or misunderstandings and providemore specific details on any limitations of the tool. Abrief questionnaire was also issued to give the providersthe opportunity to fully represent their software; 60% ofproviders responded.The leading consequence, frequency and QRA tools areshown in Figure 1. The list does not claim to beexhaustive, but is considered to be representative of themost commonly used tools.Figure 1 –Leading Software ToolsSOFTWAREAERMOD/ISC T TREE AND EVENT TREE FFAULT TREE FFAULTREASEFFIREXCFLACSCFREDCFT PROFESSIONALFHAZ FIRE/EXPLOSIONCHAZ PROFESSIONALCKAMELEON FIREXCLEAKFLOGAN F&ETAFNEPTUNEQOILMAPCOSISCPHASTCPLATOQPSA PROFESSIONALFRISKCURVESQRISKMANFRISKPLOT FTRACECC Consequence modellingF Frequency assessmentQ Quantitative risk assessmentPROVIDERTRINITYCentury l Global SolutionsRELCONTRINITYTRINITYCITDNVRM BBWIShell Global SolutionsShell Global SolutionsSafer Systems
6 KEY FINDINGS –CONSEQUENCEMODELLINGrelative extent to which the two alternatives may over- orunder-predict the possible actual consequences.There is no single“best”toolthatsolvesallproblems.What is important is the selection of the appropriate toolfor the specific situation being modelled, i.e. the toolshould be proportionate to the magnitude of the hazard,as illustrated in Figure 2.While scale models, e.g. wind tunnel testing, were notwithin the scope of the study, they should not beforgotten. Although they can be slow to set up, they canbe cost-effective, for example to provide detailedinformation on the global flow, dispersion andfluctuations of smoke and gas around an entire offshorestructure, to determine the impact on the TR habitability.Figure 2 –Leading Consequence ToolsIncreasing level of accuracy and time, cost & CANARYHAZ PROFPHENOMENOLOGICAL MODELSSCOPECFD MODELSKAMELEON/KAMELEON FIREXFLACSAUTOREAGASCEBAMEXSIM**Release, fire,explosion and gasdispersionConfined/ventedexplosionsKAMELEON modelsdispersion/fire, othersmodel explosionFairly simple, robust,used as screeningtools to provide rapidindication of physicaleffectsGreater accuracythan empiricalmodels but less thanCFDAppropriate fordesign decisions foroffshore & congestedonshore tsolvesallproblemsThere are several well used, accepted and generallysimilar empirical/physically based computational suitesfor dispersion, fire and explosion modelling. Referred toas“screeningtools”,theyoften use exactly the sameequations, e.g. Chamberlain jet fire, TNO explosion, etc.7 KEY FINDINGS –FREQUENCY ANALYSISFrequency assessment tools may be sub-divided intothose which provide either fault tree or event treemodelling or those which carry out both. The leadingfrequency analysis tools are illustrated in Figure 3.Figure 3 –Leading Frequency ToolsFAULT TREE ONLYEVENT TREE ONLYFT PROFESSIONALCABTREEFAULTREASERISKMANDDMTFAULT & EVENTTREECARAFAULT TREE PSA PROFRISKSPECTRUMFAULT TREE &EVENT TREELOGAN F&ETASAPHIRECAFTAThe powerful fault tree and event tree tools were createdfor analysing complex safeguard systems, for example,nuclear power plant where multiple redundancy anddiversity exists. Oil and gas industry applications tend tobe less demanding and often use simpler tools orspreadsheets, though occasionally these powerful toolsare used.For offshore explosion modelling, in general, as it is thenear field that is of interest, results are stronglyinfluenced by obstacles or confinement, and sosophisticated CFD tools are often more appropriate.Use of the tools tends to be in line with their country oforigin, e.g. UK, Norway and USA.Onshore it is the far field that is generally of mostinterest, so scaling/correlation models can be fit forpurpose, e.g. TNT, TNO, CAM, Baker, etc. which areincluded in the screening tools. CFD may be required forvery congested plant areas.There are some predictive database models for blowouts,process leaks and ship collisions, but none for personneltransportation, as illustrated in Figure 4.The SCOPE phenomenological tool provides a greaterdegree of accuracy than scaling models but less than thatprovided by CFD (with less time and cost).Whichever tool is selected it needs to be applied withplausible, yet appropriately conservative assumptions formethod and input data.Where ambiguity exists for particularly problematic orhighly sensitive issues, the more effective approach maybe to compare results from, for example, the two mainalternative methods. This would provide a view of theNone of the tools are integrated with consequence tools.Figure 4 –Hazardous Event Frequency ToolsBLOWOUTFREQUENCYMODELLINGBLOWFAMLEAK FREQUENCYMODELLINGLEAKSHIP COLLISIONMODELLINGCOLLIDECRASH
8 KEY FINDINGS –QRA9 SOFTWARE QRA TOOL OR t”tooldesigned for both offshore and onshore QRA. However,a handful of products stand out as technical leaders, seeFigure 5.The advantages and disadvantages of integrated softwaretools for QRA compared to spreadsheet approaches areoutlined in Figure 6.Figure 5 –Leading QRA ToolsOFFSHORE QRAONSHORE QRA –ONSHORE QRA –“INTEGRATED”note 5“NON-INTEGRATED”NEPTUNEnote 1SAFETInote 3PLATOnote 2SHEPHERDnote 4RISKCURVES EFFECTS DAMAGERISKPLOTFigure 6 –Integrated QRA Models versusSpreadsheet ModelsINTEGRATED QRA MODELSAdvantages Inclusion of manymodels in a commoncomputingenvironment Models validatedagainst experimentNotes1)‘Computational workbench’linking modules to MS Excel/ VBA2)Concentrates on escalation of fire and explosion events takingaccount of geometry3)Incorporates PHAST physical effects tool4)FRED physical effects tool is part of suite but user is not constrainedto using ne“on-line”withinsoftwareratherthan “off-line”byothertools. SAFETIisarguablymore integrated than SHEPHERDAll of the QRA tools tend to concentrate on determiningrisks for sites/installations. There are no commerciallyavailabletoolsfor“coarse”QRAof offshore facilities tocompare different options at the concept selection stage,though some consultants have developed in-housemodels.Offshore and onshore QRA tools tend to be packagedseparately, reflecting the different characteristics thatneed to be modelled, e.g. offshore evacuation, or onshorefar field impact on the public.Onshore is better served and software products aregenerally well used and accepted, arguably becauseonshore risks are simpler to model. Non-hydrocarbon orchemical risks (e.g. transport) still need to be quantified“off-line”,thoughtheytend to be less critical onshorethan oretool, twaremodelrather than having to be done by other external tools. Inpractice, most companies develop bespoke, installationspecific, linked spreadsheet models.In practice, most companies develop bespoke,installation-specific spreadsheet models for theiroffshore facilities Software qualityassured by supplier Technical support fromsoftware supplier Available“off-theshelf”enablingearlystart of work Recognised andgenerally acceptedwithin the industryDisadvantages Difficulty of use andunderstanding –onerous user trainingand familiarityrequirements (butdecent results requirecomplex modelling) Lack of control andflexibility –user unableto modify software (canbe an advantage) Lack of transparency –hidden assumptions andcalculation methods,“blackbox”(requireshigh quality technicaluser manual) High initial and ongoingcosts (licences)SPREADSHEET MODELSAdvantagesDisadvantages Relatively easy tounderstand Prone to errors by theanalyst Lower user trainingrequirements andeasier userfamiliarisation Can be personal toanalyst and difficult toupdate by otherswithout errors (requirescareful QA) Good spreadsheetmodels providetransparentcalculations andassumptions Better control –userable to developspreadsheet model tolevel of detail required(flexibility ofcalculation andpresentation) Lower external cost(but man-hour timecan be expensive) Macro programming canbe difficult to check More time consuming todemonstrate validation Perception –lesssophisticated (whenreverse is often true)
10 SOFTWARE QRA TOOL OR BESPOKESOFTWARE DEVELOPMENT?12 CONCLUSIONLarger organisations with multiple facilities who want aflexible but more robust approach than one-offspreadsheets, ha
software tools, but rather to set out what is currently available and provide some practical guidance to QRA practitioners on selecting an appropriate tool. 2 USE OF QRA A QRA approach is justified for a project, facility or operation where there is a major HSE hazard potential, significant economic implications, and a variety of risk trade-off decisions that need to be made. The objectives of .