Transcription
Investment Trading and Strategy DevelopmentAn Interactive Qualifying Project Submitted to the FacultyofWORCESTER POLYTECHNIC INSTITUTEIn partial fulfillment of the requirements for the Degree of Bachelor of ScienceBy:Alexander ArnalChuka EbiEthan PatrickJune 1, 2014Approved By:Professor Prof. Michael J. Radzicki and Professor Hossein Hakim
Abstract:The internet along with online brokers have opened up investment trading toanyone who is interested in pursuing it as a viable means of income. In order to do soeducation on the subject has become invaluable as many covet the methodology ofdeveloping a winning strategy. The goal of the project was to develop such a processthrough the scientific method by testing in a simulated trading environment. By testingand optimizing ideas, viable trading strategies were produced that function in variousmarkets including foreign exchange, crude oil futures, and technology stocks. Thesestrategies along with a basic understanding of background information serve as a startingpoint to inform an individual to the possibilities of investment trading.
Contents1. INTRODUCTION. 21.1 INTRO . 11.2 PROJECT DESCRIPTION . 11.3 CHOSEN MARKETS . 22. BACKGROUND . 22.1 INTRO TO FOREX MARKET . 22.2 INTRODUCTION TO CRUDE OIL FUTURES . 72.3 INTRODUCTION TO TECHNOLOGY STOCKS . 132.4 FUNDAMENTALS OF TRADING . 172.5 TRADING FUNDAMENTALS- BUYING AND SELLING . 202.6 TRADING FUNDAMENTALS-BASIC RISK MANAGEMENT . 212.7 INDICATORS . 252.8 TRADESTATION . 453 METHODOLOGY . 473.1 FOREX STRATEGY . 483.2 STOCK STRATEGY . 543.3 CRUDE OIL STRATEGY . 584.0 TAKEAWAYS AND CONCLUSION. 645.0 REFERENCES . 65
List of TablesTable 1 Currency symbols and distribution . 4Table 2 Forex Market times . 5Table 3 Crude oil Potential gains . 10Table 4 Strategy results from Feb 18 to Feb 21 . 53Table 5 Examples of trades taken by the strategy . 61List of FiguresFigure 1 Daily Trading Volume chart . 2Figure 2 Crude oil Barrel. 7Figure 3 Crude oil candlestick chart . 9Figure 4 Crude oil gains by season . 12Figure 5 Being “Bullish”. 13Figure 6 Microsoft (MSFT) traded through NYSE (created using Tradestation) . 15Figure 7 Performance of the technology sector traded through NASDAQ . 17Figure 8 Candlesticks . 18Figure 9 Examples of Doji . 19Figure 10 Examples of when to short and when to buy . 21Figure 11 200 period Moving Average. Exponential: Green; Simple: Orange . 27Figure 12 Relative Strength Index . 29Figure 13 RSI 70/30 crossover signals . 29Figure 14 MACD indicator . 30Figure 15 MACD crossover signals. 31Figure 16 Exponential moving averages . 32Figure 17 BOP on the USD/JPY Daily Chart in 2010 . 33Figure 18 EURJPY with an Aroon indicator . 36Figure 19 USDCHF with Momentum . 38Figure 20 Bollinger bands . 40Figure 21 Fast stochastic indicator . 43Figure 22 Slow Stochastic Oscillator . 45Figure 23 Trade station charting . 46Figure 24 60 min forex trading strategy example. 51Figure 25 15 min forex trading strategy example. 52Figure 26 Trend Lines in use . 52Figure 27 Left: Potential buy signal; Right: potential short signal . 55Figure 28 Example of a three line moving average crossover system . 56Figure 29 MACD example . 57Figure 30 This is the trade analysis of the Technology stock trading strategy . 58Figure 31 Woodie’s pivot points . 59Figure 32 Crude oil Moving average crossover . 60
1. Introduction1.1 IntroThe world of investing has been undergoing a dramatic change for the lastthe 20 years. With the introduction of computers and Internet, the masses now havea chance to trade things that only professionals had access too. With this huge shift,normal individuals now had the access to manage their own wealth and determineits path. Fast forward to present day and becoming a trader is even easier. With thecontinued advances in computer technology, people can trade things from currencyto lumber futures contracts in their own house.With this new world, came new careers, in industries other than finance.Take computer science for example; this major is one of the hottest each yeararound the United States for its usefulness in any profession. By combining thisever-growing technology, computer science, and finance disciplines a new fieldgrew. This area focuses on heavy data analysis to create tools in order to have amarket edge. With all of these new opportunities, also comes great risk. Just becausesomeone can invest their own money doesn’t mean they should.1.2 Project DescriptionThe main goals behind this project were really to learn the fundamentals of achosen market and apply the disciplines of math, economics, finance, and computerscience to create a trading system. The trading system could either be automatic ormanual using the Tradestation platform (an online broker). Each individual in the1 Page
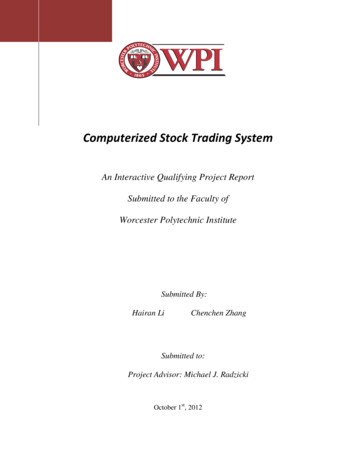
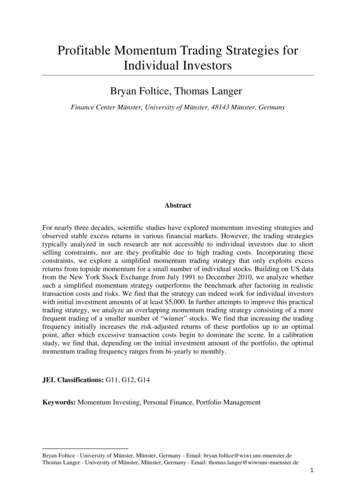
group focused on a different strategy then the other in order to gain a broader senseof the markets. The project lasted for 3 terms with the end goal of being able to testthe trading systems with ample time and learn from both our winners and ourlosers.1.3 Chosen MarketsAs mentioned above, each individual in the group focused on a different marketin order to gain a broader depth of knowledge. The markets that ended up beingpicked were the Forex market, technology stocks and crude oil futures. Below arethe in-depth descriptions and fundamentals of each market.2. Background2.1 Intro to Forex MarketThe foreign exchange market, also known as Forex, is where people from aroundthe world trade currencies for other currencies. There are various reasons a person maydesire to do so, perhaps they wish to travel abroad and need to exchange their currencyfor expenses. For example if someone from the United States wanted to travel toGermany they would have to trade in their United States Dollars for some Euros. If acompany wishes to do businessin a foreign country they willhave to buy up large amountsof foreign currency to supporttheir operations. Oil is pricedFigure 1 Daily Trading Volume chartin United States Dollar so a2 Page
company based in Japan wanting to buy Oil from Saudi Arabia would need some USdollars. A relatively new use of the Forex market is to make money in a similar fashionto trading stocks. Regardless of the reason, a total of 5 trillion exchanges hands eachday, fifty times the New York stock exchange. (Source 2.1.1) To put that in perspectivethe United States GDP is around 15 trillion, as in one third of the US GDP is tradeddaily. Of that 5 trillion only 1.49 trillion is comprised of retail traders, a number whichstill dwarfs the various stock exchanges worldwide.Currency PairsRetail traders are those that use Forex for making money as opposed to businessor travel. When a transaction is made in the Forex market a person will buy or sell pairsof currencies; one currency is traded for another. The two currencies being exchangedare called a pair. For example in order to trade the United States Dollar for JapaneseYen, the Dollar would be sold in return for purchasing Yen. Each currency is assigned asymbol, a three letter abbreviation, in this case United States Dollar is assigned USD, andJapanese Yen is shortened to JPY. So the pair being traded here would be USDJPY. Theorder determines which currency is being exchanged for the other. The price of the pairshows how much of the second currency can be bought with the first currency, this is theexchange rate. For example if the price of USDJPY is 100 then each United StatesDollar will buy 100 Japanese yen, and if someone from Japan wanted to buy USD itwould cost them 100 yen. The following are known as major currencies since theyaccount for the majority of the currencies traded throughout the world.3 Page
Table 1 Currency symbols and %03.20%02.65%03.80%United StatesDollarEuro zone membersEuroJapanYenGreat ollarNew ZealandDollarA pair which includes USD and any of the majors are known as major pairs. Themajor pairs are USDJPY, USDCHF, USDCAD, NZDUSD, GBPUSD, EURUSD, andAUDUSD. Any pair that exclude USD are referred to as cross pairs. Cross pairsamongst majors are known as major cross pairs or minors; examples of these would beEURCAD or GBPJPY. There is another category, exotic pairs which include a currencysymbol from emerging economies such as Africa. One such example would be USDZARwhich is the US dollar and the South African Rand. (Source 2.1.2) These comprise verysmall percentages of the pairs being traded and as such are accompanied by larger coststo trade.Advantages to ForexThere are many advantages to trading Forex over other markets such as stocks oroptions.No CommissionsWhile individual brokers may charge commissions, the majority do not. Instead brokersmake their money in forex through what is known as the spread, the difference betweenthe bid-ask spread. (Source 2.1.3)4 Page
No fixed lot sizeIn Forex the trader determines the amount of a currency they wish to purchase. This isknown as the lot size; a standard lot is 100,000 units of currency. Many brokers allowpurchasing of variable lot size though which may be as low as 25 dollars. Compare thisto commodities which restrict order sizes to contracts. (Source 4)Low transaction costsThe transaction cost is the bid-ask spread mentioned before and can be as low as one pipwhen trading major pairs. (Source 2.1.3)A 24-hour marketThe Forex market is open 24 hours a day, 5 days a week. There are four individualexchanges, located in London, New York, Sydney, and Tokyo. These four exchangesoffer overlapping times and allow for the Forex market to stay open 24 hours. The timesare as follows Table 2 Forex Market timesMarket CenterLondon(Great Britain)New York(United States)Sydney(Australia)Tokyo(Japan)Opening Time(EST)3:00 AM8:00 AM5:00 PM7:00 PMClosing Time(EST)11:00 AM4:00 PM1:00 AM3:00 AMNo one can corner the marketThe retail Forex market sees 1.49 trillion changing hands each day. The size of thismarket makes it impossible for any single entity to control the market for any extendedperiod of time. (Source 2.1.3)5 Page
LeverageForex brokers allow traders to control large amounts of currency with very smallaccounts. Leverage gives the possibility to make reasonable profits with little capitol. Inthe US leverage is restricted to a maximum of 50-to-1. The implications f this are thatwith as 2,000 account a trader can buy a standard lot, totaling 100,000. This meansthat the profits and losses are earned on 100,000 instead of only 2,000. In othercountries leverage is allowed to go as high as 500-to-1. That would mean that same 2,000 account could control 1,000,000 of currency. (Source 2.1.3)High LiquidityAgain the sheer size of the Forex market brings an advantage; liquidity. High liquiditymeans that when an order is placed it will be quickly filled. In forex there is highliquidity at any time of day, when a trader wants in their order will almost certainly befilled near instantly. (Source 2.1.3)Low Barriers to EntryLastly a major advantage of forex is the barrier to entry is nearly non-existent. There areonline brokers that allow account sizes of as little as 25. In addition there are muchfewer government restrictions on forex allowing “day trading” with no minimumrequired capitol. Day trading refers to a trading style where someone will enter and exitthe market multiple times a day and at the end of the day will have all positions closed.In order to do this in stocks there is a minimum requirement of 25,000. (Source 2.1.3)6 Page
2.2 Introduction to Crude Oil FuturesFigure 2 Crude oil BarrelTICK SYMBOL: CLMARKET TYPE: Futures/CommoditiesHOURS OF TRADING: 5:45pm-5pm MTWTFINSTRUMENT TYPE: ContractCONTRACT EQUIVALENT: delivery for 1000 barrelsMARIGIN REQUIRMENT: avg 3500 per contract, 3800 maintenance marginOverview:After researching numerous different markets, the market of crude oil seems tostand out in terms of consistency, liquidity and potential gains.Crude oil is perhaps the most important commodity in the whole world. It literallyis the driver behind everything. Cars need oil, planes need oil, houses need oil etc., andso it is no wonder why the investing worldview of oil for the most part is as an indicatorof economic health. The more demand for oil, the higher the growth and vice-versa. Thishas created a market that attracts companies, countries and speculators alike. Oil is afutures contract, which means it is essentially a deal for product in the future because ittrades 1 month in advance.7 Page
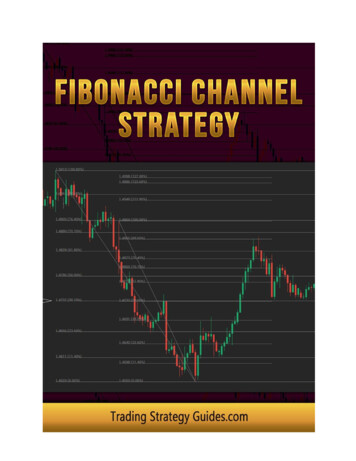
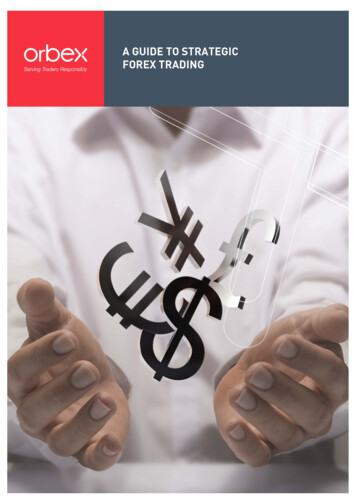
Consistency:Perhaps the best part about the crude oil markets is its relative consistencycompared to the average market. Crude prices have a long-term range of 80- 120, withfew exceptions stemming from market distress or political issues. Since oil moveseverything, there must be implications when the price isn’t at an affordable price. Whenoil becomes too costly, everything seems to suffer over time. If gas is more expensive,less people will want to drive and it will cost more to fly. Over the summer of 2013, oilhad reached a peak price of 112 due to political concerns in the Middle East that couldaffect supplies. Although the price wasn’t at the peak for very long, the effects could beseen within months. During the earnings report over the summer, Wal-Mart was quotedas saying their income was down because of the drastic increase in the price of oil.Companies like Wal-Mart and Target, who are really affected by the bottom line, lose alot of money because shipping their normal goods goes up so much. The last time oil gotway to high in price was right before the crash of 2009 when the price had hit 140 abarrel. If no one can afford oil, then the world slows down. This has actually been one ofthe factors attributed to the financial crisis. The price of oil always has a lot of room onthe upside since people are generally bullish about a non-renewable resource. However ifthe price does drop to a significant level, then OPEC will step in and change that. (1)OPEC stands for Organization of the Petroleum Exporting Countries. This organizationliterally has all the power in the world when it comes to oil. They decide how muchproduct gets put into the market as well as the price to be sold at. Since they controldemand, they clearly wouldn’t let the price fall below a point where they won’t makemoney, thus effectively creating a price base for oil. With these clear tops and bottomsdefined for both economic and political reasons, it makes oil a lot more consistent in the8 Page
long run and less subject to dramatic actions from other markets. Below is the 1-yearchart of CL to demonstrate this consistency of price range.Figure 3 Crude oil candlestick chartLiquidity:Oil is by far the number one commodity traded and for good reason. When thisproduct drives all production and manufacturing in the world, you can assume that thereis a lot of it to be traded. Liquidity usually means how quick can something be turned intocash. For the markets however, it means how quick can an order get filled as well as getout. Oil has tens of thousands of contracts traded each day, which really increases theodds of getting filled on time.Potential GainsCrude oil is something that can only really be traded on the futures market. Afutures market is defined as “An auction market in which participants buy and sellcommodity/future contracts for delivery on a specified future date.”(2)9 Page
For crude oil the ticker symbol is CL. Each contract of CL is equivalent to 1000 barrelson delivery. That means if you activate your contract or it expires, then you have to payfor 1000 barrels of crude oil delivery to your house. This is almost impossible to happenon accident if you are an amateur trader because brokerage firms primarily are trying toprotect you and your money. For CL the contract is continuous so a small trader doesn’tneed to worry about getting oil at their front doorstep. That being said, the price of oil isabout 100 on average so 1000 barrels is going to be equivalent to 100,000 of oil. Thisis where the real beauty of futures lies. For on average of 3500 someone can open 1contract of CL. That means that for only 3500, you can trade with near 100k. Keep inmind that this significantly increases the risk as well as the potential gains.Below are some examples of crude oil trades that demonstrate the type of gains one couldpotentially see.Table 3 Crude oil Potential 00 Cash 00:00FEESCOMMISSIONS AMOUNT BALANCE100,970.91100,970.91BOT 1 /CLK4 @98.481.47-2.25BOT 1 /CLK4 @98.481.47-2.25BOT 1 /CLK4 @98.481.47-2.25SOLD -1 /CLK4 @98.511.47-2.25SOLD -1 /CLK4 @98.511.47-2.25SOLD -1 /CLK4 @98.511.47-2.25Cash balance at the start of business day 20.03 CST100,967.19100,963.47100,959.7530 100,986.0330 101,012.3130 101,038.59101,038.5910 P a g e
Above, this data shows that at 8:00:24 the trader bought 3 contracts of CLK4 at 98.48. From 8:00:40-8:00:48 the trader sold all 3 contracts for 98.51. This was atotal gain of 3 cents or ticks. Since 1 contract trades with the equivalent of 1000barrels, each cent movement yields 10 either up or down. Since the trader is using3 contracts, each cent movement is now 30. Since the gains were 3 cents, the totalamount of money made was 90 in about 30 seconds of being in the market.What are the main drivers in the price of CRUDE OIL?After studying oil for the past 2 years, this is the best list of events that moveoil in price considerably.1) Economic news relating to China and America. Since both of these countriesare the biggest consumers of oil in the world, their economic status greatlypaints a picture of what demand is going to be.2) Political issues/tension in an area of high supply. Anytime there is an issue inthe Middle East, oil is one of the first things to rally as fear sets in.3) Overall market crashes or rallies. Oil is connected to everything so it issubject to huge moves like when the price rose to 140 a barrel in 2009before tanking down to 40 after the crash happened.4) Weekly news releases. Each week the EIA releases the total stockpiles of oiland its derivatives. This report can either be everything or nothingdepending on the other news out at the time.11 P a g e
5) Seasonality. Oil has natural cycles of high and low demand like driving in thesummer or heating oil for the winter. These types of trends can be seen overtime quite clearly. Below is a chart actually demonstrating this.Figure 4 Crude oil gains by season12 P a g e
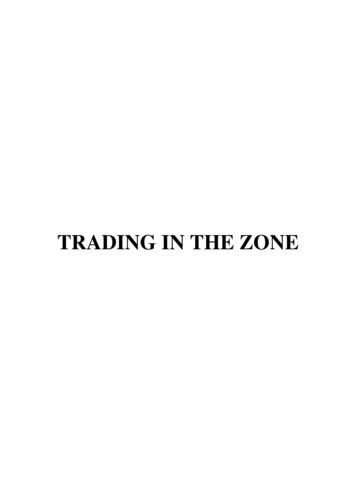
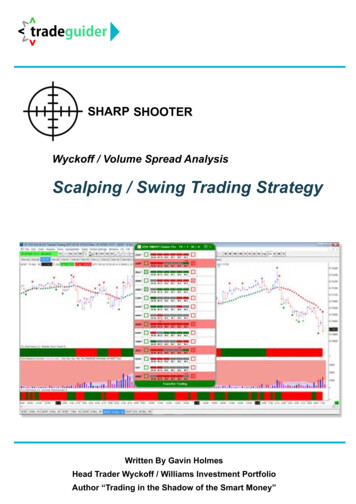
2.3 Introduction to Technology StocksFigure 5 Being “Bullish”Stock, or equity, is a type of financial instrument that demonstrates ownership in acorporation. A holder of stock (a shareholder) possesses the privilege to own a part of thecorporation's assets and earnings. Ownership is determined by the number of shares aperson owns relative to the number of outstanding shares. For example, if a company has3,000 shares of stock outstanding and one person owns 300 shares, that person wouldown and have claim to 10% of the company's assets. The market that enables shares ofstock to be issued and traded is known as the stock market. Publicly traded companiescan take part in this market and use it to raise large sums of capital. When companies areprofitable, stock market investors make money through the dividends the companies payout and by selling appreciated stocks at a profit called a capital gain. The downside is thatinvestors can lose money if the companies whose stocks they hold lose money, the stocks'prices goes down and the investor sells the stocks at a loss. This can be combatted by theinvestor going “bearish”; this means that the investor bets on the shares falling and makesa profit of the companies’ losses. Shares are traded through exchanges. The two biggest13 P a g e
exchanges in the United States are the New York Stock Exchange (NYSE) and theNasdaq (NSDQ). Today, most trades are executed electronically, and even the stocksthemselves are almost always held in electronic form, as opposed to physical certificates.For most companies there are two main types of stocks: Common Stock Preferred StockCommon stock is what people who talk about stocks are usually referring to. Actually,most of a companies’ shares are issued is in this manner. Common shares representownership in a company and a claim (dividends) on a portion of profits. Investors get onevote per share to elect the board members, who oversee the major decisions made bymanagement. Over a long period, the common stock, by means of capital growth, bringsabout higher returns than almost all other forms investment. Although, the opportunityfor higher returns come at a cost since common stocks entail the most risk. If a companygoes bankrupt and liquidates, the common shareholders will not receive money until thecreditors, bondholders and preferred shareholders are paid. In some instances an investorwho possesses common stock may never see dividends if the company performs verypoorly.Preferred stock represents some degree of ownership in a company but does not comewith the same voting rights, although this ultimately depends on the company. Withpreferred shares, investors are guaranteed a fixed dividend forever. This is in starkcontrast to common stock, which has variable dividends that are never guaranteed.Another advantage is that in the event of liquidation, preferred shareholders are paid offbefore the common shareholder but still after debtholders. Preferred stock may also be14 P a g e
callable, meaning that the company has the option to purchase the shares fromshareholders at any time for any reason (usually for a premium).The stock market, naturally, is broad with hundreds of thousand companies from varioussectors being traded on a daily basis. For the purpose of this project, the focus wastrained on one sector in particular. Namely, the technology sector.Figure 6 Microsoft (MSFT) traded through NYSE (created using Tradestation)The Technology sector is a category of stocks that relates to the research, developmentand/or distribution of technologically based goods and services. This sector comprises ofenterprises that revolve around the manufacturing of electronics, creation of software,computers and any services relating to information technology. Within the technologysector, there are four major types that make up the majority of the technology companiesin today’s market: Semiconductors Software Networking and Internet Hardware15 P a g e
Semiconductors This s the industry term for computer chips. Industries in this field werethe first tech companies to go public. Semiconductors are the foundation of mosttechnology needs to provide further innovation and success. They are ubiquitous and arearguably the backbone of the technology sector. Semiconductor stocks are considered themost stable within the technology industry. Examples of companies within this field areIntel Corporation (INTC) Entegris Incorporated (ENTG), and PDF SolutionsIncorporated (PDFS).Software is the technology that enables interaction between a human and a devicescapabilities. Nothing much happens in the modern world. Computers are everywhere andrepresent critical components of everything from pacemakers to cars, but none of thosecomputers do anything without software. As such, it is not surprising that software is ahuge industry as well. Software requires virtually no infrastructure and is difficult toprotect via patents. Hence, Software is often considered to be less stable thansemiconductors. Examples include: Microsoft Corporation (MSFT), Oracle Corporation(ORCL) and AVG Technologies (AVG)Networking and Internet This field is the one I spent a higher degree of time on. It isarguably the biggest tech innovation since the microchip. The internet itself hasfacilitated major changes to commerce and has underpinned entirely new businessmodels like store-free retailing and software as a service. Networking is in many respectsa sub-sector of the other mega-sectors; it requires hardware and software to function.That said, it is large enough and important enough to stand on its own. The number ofinternet companies that rise fast and fall just as quickly is has increased exponentiallyover the past decade and the stocks in this field are considered the most16 P a g e
volatile. Examples of companies under this field are Facebook Incorporated (FB), TwitterIncorporated (TWTR), LinkedIn (LNKD), and Cisco Systems (CSCO).Hardware This field can be broken down into many sub-sectors, includingcommunications equipment, computers and peripherals, networking equipment, technicalinstruments and consumer electronics etc. Examples of companies are: HewlettPackard(HP), Tesla Motors(TSLA), Apple(AAPL).The sector itself has been on an upwards trend since the tech bubble burst of the 2000s,and an exponential growth post-recession of 2008. On a whole, Technology stocks arenot as often traded in comparison to their counterparts in construction, finance etc. Agood reason would be their volatility and nascent nature, but with the right tools andanalysis
The Forex market is open 24 hours a day, 5 days a week. There are four individual exchanges, located in London, New York, Sydney, and Tokyo. These four exchanges offer overlapping times and allow for the Forex market to stay open 24 hours. The times are as follows Table 2 Forex Marke