Transcription
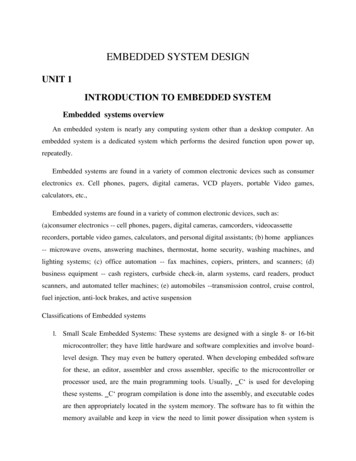
Embedded SystemsAdaptive embedded systemsTwo applications to societyobservationsDevika SubramanianDepartment of Computer ScienceRice //www.cs.rice.edu/ devikaObservation driven, task-specific decision makingMachine LearningEmbedded Adaptive SystemsPrior knowledgePrior knowledgeTraining dataLearningalgorithmPredictive modelobservationsLearningalgorithmSystem fora taskModelactionsEnvironmentEnvironmentCalculate decisions on the basis of learned models of systemsResearch questions in adaptiveembedded system designWhy embed learning? We cannot calculate and implement anaction-choice/decision-makingstrategy for the system at designtime. System dynamics are unknown/partiallyknown.System dynamics change with time.A one-size-fits-all solution is notappropriate – customization is needed. Representation: What aspects of the task,environment and system dynamics do weneed to observe and model for decisionmaking?Learning: How can we build and maintainembedded models in changing environments?Decision making/acting: How can we usethese models effectively to make decisionswith scarce resources in changingenvironments?1
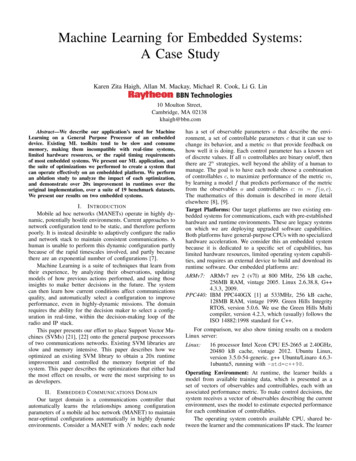
Approach Roadmap of talkDesign and validatealgorithms for large-scalereal world, socially relevantproblems.Publish in the applicationcommunity journals; getcommunity to routinely usethe methods.Abstract task-levelanalysis and presentmethods to the AIcommunity. Two case-studies Unknown system, changing dynamics Submarine School 101The NRL Navigation TaskTracking human learning on a complex visualmotor task.Predicting the evolution of internationalconflict.The NRL Navigation TaskMine configurationchanges with everygame. Pilot a submarine to a goal througha minefield in a limited time period Distance to mines revealed viaseven discrete sonarsGame has a strategicand a visual-motorcomponent! Time remaining, as-the-crow-fliesdistance to goal, and bearing to goalis given Actions communicated via a joystickinterface50% of class weeded out by this game!Task QuestionsLearning curves1009070S360S450S540S130S2 485001Success %80Successfullearnerslook rners areDOA! Is the game hard? What is the source ofcomplexity?Why does human performance plateau out at 80%?Is that a feature of the human learning system orthe game? Can machine learners achieve higherlevels of competence?Can we understand why humans learn/fail to learnthe task? Can we detect inability to learn earlyenough to intervene?How can we actively shape human learning on thistask?Navy takes 5 days to tell if a person succeeds/fails.2
Mathematical characteristicsof the NRL task A partially observable Markov decisionprocess which can be made fully observableby augmentation of state with previousaction.State space of size 1014, at each step achoice of 153 actions (17 turns and 9speeds).Feedback at the end of up to 200 steps.Challenging for both humans and machines.Reinforcement r2, .actionTaskReinforcement Learning, Barto and Sutton, MIT Press, 1998.Reinforcement learning/NRLtask Representational hurdles State and action spaces have to be manageablysmall.Good intermediate feedback in the form of anon-deceptive progress function needed. Appropriate credit assignment policy needed tohandle the two types of failures (timeouts andexplosions are different).Q-learning is too slow to converge (becausethere are up to 200 steps in a single trainingepisode). Algorithmic hurdles State space design 0.75 if s is an all-blocked state and s’ is a not-all-blocked state 0.5 Diff in sum of sonars/1000 if s’ is an all-blocked state 0.5 Diff in range/1000 abs(bearing - 6)/40 otherwisespeed: 0, 20 and 40.turn: -32, -16, -8, 0, 8, 16, 32.Automated discovery of abstract state spaces for reinforcement learning,Griffin and Subramanian, 2001.The dense reward functionr(s,a,s’) 0 if s’ is a state where player hits mine. 1 if s’ is a goal state 0.5 if s’ is a timeout stateBinary distinction on sonar: is it 50?Six equivalence classes on bearing: 12,{1,2}, {3,4}, {5,6,7},{8,9}, {10,11}State space size 27 * 6 768.Discretization of actionsCredit assignment policy Penalize the last action alone in a sequencewhich ends in an explosion.Penalize all actions in sequence which endsin a timeout.3
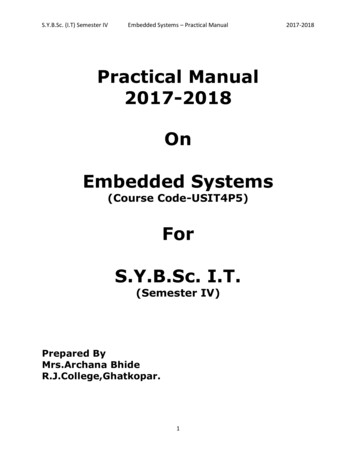
Simplification of valueestimation Results of learning complete policyEstimate the average local reward for eachaction in each state.r1sr2s’Blue: learn turnsonlyr3Red: learn turnand speedtInstead of learning QHumans makemore effectiveuse of trainingexamples. ButQ-learner gets tonear 100% success.Open question:Q( s, a ) α [ r max Q ( s ' , a ' )] (1 α )Q ( s, a ) When does thisa'We maintain an approximationapprox work?Q ' ( s, a ) (running avg of rewards at s for a ) * pct of wins from sQ(s,a) is the sum of rewards from s to terminal state.Griffin and Subramanian, 2000Full Q learner/1500 episodesFull Q learner/10000 episodesFull Q learner/failure after 10KWhy learning takes so longStateswhere3 or fewerof the 153action choicesare correct!Griffin and Subramanian, 20004
Lessons from machine learningTask QuestionsTask level Task is hard because states in which action choice iscritical occur less than 5% of the time.Staged learning makes task significantly easierA locally non-deceptive reward function speeds uplearning. Reinforcement learning Long sequence of moves makes credit assignmenthard; a new cheap approximation to global valuefunction makes learning possible for such problems.Algorithm for automatic discretization of large,irregular state spaces. Is the game hard? Is it hard for machines? Whatis the source of complexity?Why does human performance plateau out at 80%?Is that a feature of the human learning system orthe game? Can machine learners achieve higherlevels of competence?Can we understand why humans learn/fail to learnthe task? Can we detect inability to learn earlyenough to intervene?How can we actively shape human learning on thistask?Griffin and Subramanian, 2000, 2001ChallengesTracking human learningPrior knowledgeLearningalgorithmModelStrategy mappingsensor panelsto joystickaction (sensor panel,joystick action)(time coursedata) High-dimensionality of visual data (11 dimensionsspanning a space of size 1014)Large volumes of dataNoise in dataNon-stationarity: policies change over timeInterventionsto aidlearningExtract strategy and study its evolution over timeEmbedded learner design Representation Use raw visual-motor data stream to inducepolicies/strategies.Learning Direct models: lookup table mapping sensors attime t and action at t-1 to distribution ofactions at time t. (1st order Markov model)Decision-making Compute “derivative” of the policies over time,and use it (1) to classify learner and selectinterventions, (2) to build behaviorallyequivalent models of subjectsStrategy: mapping from sensorsto action distributionswWindow ofw games5
Surely, this can’t work! There are 1014 sensor configurationspossible in the NRL Navigation task.However, there are between 103 to 104 ofthose configurations actually observed byhumans in a training run of 600 episodes.Exploit sparsity in sensor configurationspace to build a direct model of thesubject.How do strategies evolve overtime? Distance function between strategies: KLdivergencewwOverlap sΔ P (Π (i, i w), Π (i w s, i 2 w s )Results: model derivativeBefore shift (episode 300)Siruguri and Subramanian, 2002After shift (episode 320)Model derivative for HeiSiruguri and Subramanian, 20026
How humans learn Behaviorally equivalent modelsSubjects have relatively staticperiods of action policy choicepunctuated by radical shifts.Successful learners have conceptualshifts during the first part oftraining; unsuccessful ones keeptrying till the end of the protocol!Generating behaviorallyequivalent models ModelNRL taskSubject Cea: Day 5: 1To compute action a associated withcurrent sensor configuration s in a givensegment, take 100 neighbors of s in lookup table. perform locally weighted regression(LWR) on these 100 (s,a) pairs.SubjectSubject Cea: Day 5: 2SubjectModelModelSubject Cea: day 5: 3SubjectModel7
Subject Cea: Day 5: 4SubjectModelSubject Cea: Day 5: 6SubjectModelSubject Cea: Day 5: 8SubjectModelSubject Cea: Day 5: 5SubjectModelSubject Cea: Day 5: 7SubjectModelSubject Cea: Day 5: 9SubjectModel8
Comparison with global methodsSummary We can model subjects on the NRL task inreal-time, achieving excellent fits to theirlearning curves, using the available visualmotor data stream.One of the first in cognitive science todirectly use objective visual-motorperformance data to derive evolution ofstrategy on a complex task.Siruguri and Subramanian, 2002LessonsWhere’s the science? Neural correlates Are there neuralcorrelates tostrategy shiftsobserved in thevisual-motor data?Learn simple models from objective, lowlevel data!Non-stationarity is commonplace, need todesign algorithms robust with respect to it.Fast new algorithms for detecting changepoints and building predictive stochasticmodels for massive, noisy, non-stationary,vector time series data.Task Questions Can we adapt training protocols in the NRLtask by identifying whether subjects arestruggling with strategy formulation orvisual-motor control or both?Can we use analysis of EEG data gatheredduring learning as well as visual-motorperformance data to correlate ‘brainevents’ with ‘visual-motor performanceevents’? Can this correlation separatesubjects with different learningdifficulties?9
The (new) NRL Navigation TaskGathering performance data256 channel EEG recordingFusing EEG and visualmotor dataThe coherence function EEGDataArtifactRemovalCoherencecomputation VisualizationMechanismPerformanceDataFrequency bands Coherence map of connections ineach band Δ (0-5 Hz)θ (5-9 Hz)α (9-14 Hz)β (14-30 Hz)γ (40-52 Hz)Coherence provides the means tomeasure synchronous activitybetween two brain areasA function that calculates thenormalized cross-power spectrum, ameasure of similarity of signal in thefrequency domainC xy ( f ) S xy ( f ) 2[ S xx ( f ) S yy ( f )]Topological coherence mapBackFront10
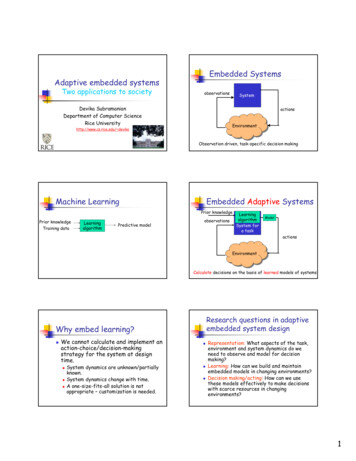
Subject moh progression chartControlControlTargetTargetTarget - controlTarget - controlSubject bil progression chartResults (subject moh)ResultsResults (subject bil)Subject GSubject is a nearexpert performerSubject is inskill refinementphaseBaluch, Zouridakis, Stevenson and Subramanian, 2005, 2006Baluch, Zouridakis, Stevenson and Subramanian, 2005, 200611
ResultsSubject VSubjectneverlearned agood strategyIt wasn’tfor lackof trying. There are distinct EEG coherence map signaturesassociated with different learning difficulties Lack of strategy Shifting between too many strategiesSubjects in our study who showed a move from alow level of performance to a high level ofperformance show front to back synchrony in thegamma range or long range gamma synchrony(LRGS). We are conducting experiments on more subjectsto confirm these findings. (14 subjects so far, andmore are being collected right now.)Baluch, Zouridakis, Stevenson and Subramanian, 2005, 2006What else is this good for? Using EEG readouts to analyze theeffectiveness of video games for relievingpre-operative stress in children (A. Patel,UMDNJ).Using EEG to read emotional state ofplayers in immersive video games (M. Zyda,USC).Analyzing human performance on anyvisualmotor task with significant strategiccomponent.Publications Details, please Human Learning and the Neural Correlates of Strategy Formulation, F. Baluch, D. Subramanian and G.Zouridakis, 23rd Annual Conference on Biomedical Engineering Research, 2006.Understanding Human Learning on Complex Tasks by Functional Brain Imaging, D. Subramanian, R.Bandyopadhyay and G. Zouridakis, 20th Annual Conference on Biomedical Engineering Research, 2003.Tracking the evolution of learning on a visualmotor task Devika Subramanian and Sameer Siruguri,Technical report TR02-401, Department of Computer Science, Rice University, August 2002.Tracking the evolution of learning on a visualmotor task Sameer Siruguri, Master's thesis under thesupervision of Devika Subramanian, May 2001.State Space Discretization and Reinforcement Learning, S. Griffin and D. Subramanian, Technicalreport, Department of Computer Science, Rice University, June 2000.Inducing hybrid models of learning from visualmotor data , Proceedings of the 22nd AnnualConference of the Cognitive Science Society, Philadelphia, PA, 2000.Modeling individual differences on the NRL Navigation task, Proceedings of the 20th AnnualConference of the Cognitive Science Society, Madison, WI, 1998 (with D. Gordon).A cognitive model of learning to navigate, Proceedings of the 19th Annual Conference of the CognitiveScience Society, Stanford, CA, 1997 (with D. Gordon).Cognitive modeling of action selection learning, Proceedings of the 18th Annual Conference of theCognitive Science Society, San Diego, 1996 (with D. Gordon)Roadmap of talk Four case-studies Unknown system, changing dynamics Tracking human learning on a complex visualmotor task.Predicting the evolution of internationalconflict.12
Adaptive SystemsPrior knowledgeWire newsLearningalgorithmModelTask QuestionModels ofconflict evolution SystemEarly warningof conflictIs it possible to monitor news media fromregions all over the world over extendedperiods of time, extracting low-level eventsfrom them, and piece them together toautomatically track and predict conflict inall the regions of the world?TheThe worldworldAnalysis of wire storiesThe Ares AP, AFP,BBC, Reuters, Relevance filterSingularitydetectionModelsHubs &AuthoritiesOver 1 millionarticles on theMiddle East from1979 to 2005 90415790415790415Embedded learner design Representation Learning Identify relevant stories, extract event datafrom them, build time series models and graphtheoretic models.Identifying regime shifts in events data,tracking evolution of militarized interstatedisputes (MIDs) by hubs/authorities analysis ofevents dataDecision-making Issuing early warnings of outbreak of RBJORUGAISRGOVTa rget W eis AFD193EGY31IRQ31CHR223AUS32CHR32ISRSET54W ie s eventGoldstein sca le(MIL ENGAGEMENT)-10(HALT NEGOTIATION)-3.8(MIL ENGAGEMENT)-10(MIL ENGAGEMENT)-10(MEET)1(MEET)1(MIL ENGAGEMENT)-10(MIL ENGAGEMENT)-10(CUT AID)-5.6(MEET)1(MEET)1(MIL larity detectionon aggregated eventsdataHubs and authoritiesanalysis of eventsdataIdentifying relevant stories Only about 20% of stories contain events thatare to be extracted. The rest are interpretations, (e.g., op-eds), or areevents not about conflict (e.g., sports)We have trained Naïve Bayes (precision 86%and recall 81%), SVM classifiers (precision92% and recall 89%) & Okapi classifiers(precision 93% and recall 87%) using a labeledset of 180,000 stories from Reuters.Surprisingly difficult problem! Lack of large labeled data sets;Poor transfer to other sources (AP/BBC)The category of “event containing stories” is not wellseparated from others, and changes with timeLee, Tran, Singer, Subramanian, 200613
Okapi classifier RelNew articleIrrOkapi measure takestwo articles and givesthe similarity between them.Event extractionReuters data set:relevant categoriesare GVIO, GDIP, G13;irrelevant categories:1POL, 2ECO, 3SPO,ECAT, G12, G131,GDEF, GPOLDecision rule: sum of top N Okapi scores in Rel set sum of top N Okapi scores in Irr setthen classify as rel; else irrParse sentencePronoun de-referencingKlein and Manning parserSentence fragmentationConditional random fieldsWe extract who (actor) did what (event) to whom (target)Correlative conjunctionsExtract embedded sentences (SBAR)Not exactly the same as NER14
ResultsEvents BARIis stateof the artcoderin politicalscience200 Reuters sentences; hand-labeled with actor, target,and event codes (22 and RBJORUGAISRGOVTarget W eis AFD193EGY31IRQ31CHR223AUS32CHR32ISRSET54W ies eventGoldstein scale(MIL ENGAGEMENT)-10(HALT NEGOTIATION)-3.8(MIL ENGAGEMENT)-10(MIL ENGAGEMENT)-10(MEET)1(MEET)1(MIL ENGAGEMENT)-10(MIL ENGAGEMENT)-10(CUT AID)-5.6(MEET)1(MEET)1(MIL 36 events from April 1979 to October 2003 in Levantdata set (KEDS).Stepinksi, Stoll, Subramanian 2006What can be predicted?Singularity detectionStoll and Subramanian, 2004, 2006Singularities MID start/endbiweekDaterangeevent11/79 to8/80Start of Iran/Iraq war105-1114/83 to7/83Beirut suicide attack, end of Iran/Iraq war2441/91 to 2/91Desert Storm413-4251/95 to 7/95Rabin assassination/start of Intifada483-51810/97 to2/99US/Iraq confrontation via Richard Butler/armsinspectors522-5394/99 to11/99Second intifada Israel/Palestine17-35Interaction graphs Model interactions between countriesin a directed YPALPLUNKISRTarget W eis CodeISR223AFD194ISR223ISR223EGY31ARBISREGYAFDW ies eventGoldstein scale(MIL ENGAGEMENT)-10(HALT NEGOTIATION)-3.8(MIL ENGAGEMENT)-10(MIL ENGAGEMENT)-10(MEET)1UNKPALPL15
Hubs and authorities forevents data Hubs/Authorities picture ofIran Iraq warA hub node is an important initiator ofevents.An authority node is an important target ofevents.Hypothesis: Identifying hubs and authorities over aparticular temporal chunk of events data tellsus who the key actors and targets are.Changes in the number and size of connectedcomponents in the interaction graph signalpotential outbreak of conflict.2 weeks prior to Desert StormValidation using MID data Number of bi-weeks with MIDS in Levant data: 41out of 589.Result 1: Hubs and Authorities correctly identifyactors and targets in impending conflict.Result 2: Simple regression model on change inhubs and authorities scores, change in number ofconnected components, change in size of largestcomponent 4 weeks before MID, predicts MIDonset.Problem: false alarm rate of 16% can be reducedby adding political knowledge of conflict.Stoll and Subramanian, 2006Current work Extracting economic events alongwith political events to improveaccuracy of prediction of botheconomic and political events.16
The research teamPublications An OKAPI-based approach for article filtering, Lee, Than, Stoll, Subramanian, 2006Rice University Technical Report.Hubs, authorities and networks: predicting conflict using events data, R. Stoll and D.Subramanian, International Studies Association, 2006 (invited paper).Events, patterns and analysis, D. Subramanian and R. Stoll, in Programming for Peace:Computer-aided methods for international conflict resolution and prevention, 2006,Springer Verlag, R. Trappl (ed).Four Way Street? Saudi Arabia's Behavior among the superpowers, 1966-1999, R. Stolland D. Subramanian, James A Baker III Institute for Public Policy Series, 2004.Events, patterns and analysis: forecasting conflict in the 21st century, R. Stoll and D.Subramanian, Proceedings of the National Conference on Digital Government Research,2004.Forecasting international conflict in the 21st century, D. Subramanian and R. Stoll, inProc. of the Symposium on Computer-aided methods for international conflictresolution, 2002.The fine structure of adaptiveembedded systemsEmbedded Adaptive SystemsPrior knowledgeobservationsLearningalgorithmSystem fora taskactionsPrior knowledgeModelobservations lculate decisions on the basis of learned models of systemsNon-stationarity is pervasive. Robust algorithms for detection.The vision “Systemidentification” forlarge, non-stationary(distributed) systems.Off-the-shelfcomponents forputting togetherfeedback controllerswith performanceguarantees for ptingcomplexmodels isexpensive;lightweightlocal modelsare rightchoice.Collaborators Tracking human learning Diana Gordon, ONR/University ofWyoming and Sandra Marshall, San DiegoState University, George Zouridakis,University of HoustonTracking conflict Richard Stoll, Rice University17
Students StudentsHuman learning Richard Thrapp, NationalInstrumentsPeggy Fidelman, PhD inCS/UT AustinIgor Karpov, PhD in CS/UTAustinPaul RamirezGwen Thomas, Green HillsTony BerningGunes Ercal (CRA mentee)Deborah Watt (CRAmentee) Scott Griffin, RationalScott Ruthfield,MicrosoftChris Gouge, MicrosoftStephanie Weirich (Asst.Prof. at UPenn)Sameer Siruguri, MSLisa Chang, MS, IBMNuvan Rathnayake, RicejuniorIan Stevenson, PhDneuroscience,NorthwesternFarhan Baluch, Universityof Houston, MS 2006Conflict Michael Friedman, Rice sophomoreAdam Larson, Rice seniorAdam Stepinski, Rice sophomoreClement Pang, Rice juniorBenedict Lee, MS 2007Derek Singer, Rice juniorSponsors Conflict analysis: NSF ITR 0219673Human learning: ONR N00014-96-1-053818
embedded system design . more effective use of training examples. But Q-learner gets to near 100% success. Griffin and Subramanian, 2000 Full Q learner/1500 episodes Full Q learner/10000 episodes Full Q learner/failure after 10K Why learni