Transcription
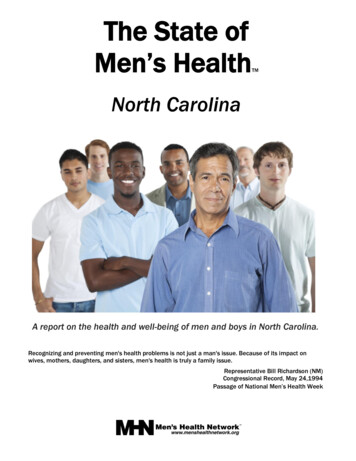
The State ofMen’s HealthTMNorth CarolinaA report on the health and well-being of men and boys in North Carolina.Recognizing and preventing men's health problems is not just a man's issue. Because of its impact onwives, mothers, daughters, and sisters, men's health is truly a family issue.Representative Bill Richardson (NM)Congressional Record, May 24,1994Passage of National Men’s Health Week
The State ofMen’s HealthTMNorth CarolinaNational Men’s Health Week provides an opportunity to call attention to theimportance of a healthy lifestyle and the benefits of seeking early detectionand treatment of diseases. Heart disease and cancers of the prostate, colon,and testicle remain a serious concern for men. Fortunately, the long-termoutlook is often favorable if these afflictions are diagnosed early.Recognizing and preventing men's health problems is not just a man'sissue. Because of its impact on wives, mothers, daughters, and sisters,men's health is truly a family issue.Representative Bill Richardson (NM)Congressional Record, May 24,1994Passage of National Men’s Health WeekP.O. Box 75972Washington, DC 20013202.543. MHN.1 (6461) x 1011
Table of ContentsIntroduction3Life Expectancy at Birth: Male and Female4Life Expectancy: Gender and Race5Age Adjusted Death Rates for the Top Causes of Death in North Carolina, by Gender6State-Specific Leading Causes of Mortality, by Gender and Race7Years Potential Life Lost8Leading Causes of Death for Boys9Two Specific Causes of Death: A Closer Look10Suicide in North Carolina11Prostate Cancer Mortality12Prostate Cancer Incidence Rates, by State13Prostate Cancer Death Rates, by State14Explaining the Gender Mortality Gap15Why the Gender Mortality Gap?16Aging in America: Effect on the Male-Female Ratio18Male – Female Ratio by Age Groups: North Carolina and USA19Points of Hope by Eric "Ric" Bothwell20Addendum21Life Expectancy, USA22Obesity and Its Complications23Diabetes23The Commonwealth Fund Study24The Weaker Sex?26Men’s Health Week Proclamation27Men’s Health ek.org 2017 Men’s Health Network2
IntroductionIt has been called the “silent crisis” for good reason. It’s Men’s Health. Overall, men live“sicker” and shorter lives than women. It’s common knowledge that a woman the same ageas her husband will most likely live longer than he will. But the true crisis lies in the popularacceptance of these statistics. Closer inspection indicates that we do not have to accept thisas a fact of life.Men die at higher rates than females of the same age for a number of reasons, due in nosmall part to a society that encourages men to engage in risky behaviors, where men work atthe most dangerous jobs, and where men put their work above their own safety. Yet onebehavior may well be the most threatening to their longevity of all – not being aware of theirown health care needs. According to studies by the Commonwealth Fund and the Centers forDisease Control and Prevention (CDC) cited in this report, men are far less likely than womento have regular contact with a doctor over the course of their lifetime and are half as likely aswomen to have a preventive health exam. This means that men often do not receive anypreventive care for potentially life-threatening conditions, nor are those conditions diagnosedearly when they are easier to treat and/or cure.According to the National Center for Health Statistics at CDC, overall per capita spending onhealthcare nearly doubled in 12 years, from 4,128 in 2000 to 7, 826 in 2013, andcontinues to grow.1 However, due to the factors mentioned above, the health of America’smen has not benefited in proportion to this increase. In short, many men die long before theirtime because of diseases that could have been prevented if only they had known.This is also a family crisis. Almost half of elderly widows who live in poverty were not living inpoverty before the death of their husbands. In terms of lost years for societal contributions,the numbers are staggering.For over two decades Men's Health Network has been seeking to educate the public on healthdisparities among men and women, and to support a new generation with the tools to turn thetide on these statistics. Education plays a major role in the understanding and eventualelimination of health disparities between men and women, rich and poor. Access to healthcare services is also key, and the ongoing changes in our health care delivery systems providepromise for a more engaged male, with retail clinics and neighborhood urgent care centersmaking health care more accessible to both men and women whose work schedules orlifestyles otherwise hinder their access to a health care provider.This extensive report sheds light on the current male health crisis in our communities andshould be the impetus for all of us to push for broader solutions nationwide and mostimportantly, bring the focus back home where we need to encourage our own men to leadhealthier lifestyles. The report provides the data needed to begin to understand the problem,offering a starting point for changes in policies and attitudes that will allow us to improve thehealth and wellbeing of men and boys and their families.For ideas on how to improve the health and wellbeing of men and boys in your state, contact:state@menshealthnetwork.org1National Center for Health Statistics. Health, United States, 2014. Retrieved January, 15, 2016.3
North Carolina: Life Expectancy at Birth: 2010Simply put, there is a silent crisis in America and in NorthCarolina, a crisis of epic proportions: On average,American men live shorter and less-healthy lives thanAmerican women. As shown below, this is also true forNorth Carolina.Silent Health Crisis“There is a silent health crisis inAmerica.it’s that fact that, onaverage, American men live sickerand die younger than Americanwomen.”This higher mortality of men leads to striking disparities inDr. David Gremillionlife expectancy as reflected in the statistics. The disparityMen’s Health Networkis also illustrated by a 1990 study which found a lifeexpectancy of 56.5 years for men living on two SouthDakota reservations, and 97 for Asian women living in one New Jersey county.2What does this mean for spouses and families? In North Carolina, among women married tomen the same age as themselves, more than 12% could be widows as they enter retirement(see page 19 of this report).North Carolina vs US Life Expectancy at Birth, 20103(The most current data available to compare state with 47372All (US)All (NC)Females(US)Females(NC)Males(US)Males(NC)More than one-half the elderly widows now living in poverty werenot poor before the death of their husbands.Meeting the Needs of Older Women: A Diverse and Growing Population,The Many Faces of Aging, U.S. Administration on AgingLifelines—Long and Short. Harvard Magazine: 1998. http://www.harvard- magazine.com/issues/mj98/right.lifelines.html Retrieved June 3, 2003.3 Social Science Research Council. Measure of America. HD index and supplemental indicatorsby state: 2013-14 dataset. Life expectancy at birth. Measure of America A Project of the Social Science Research Council.Retrieved January 11, 2016. www.measureofamerica.org 24
North Carolina vs US, Life Expectancy at Birth by Race and Gender, 20104(The most current data available to compare state with national)88.990.085.484.183.585.081.4 80.880.080.380.278.778.4 77.876.775.775.072.772.371.270.0WF (US)WM (US)65.0WF (NC)WM (NC)BF (US)BM (US)BF (NC)BM (NC)HF (US)HM (US)HF (NC)HM (NC)APF (US)APM (US)APF (NC)APM (NC)AIF (US)AIM (US)AIF (NC)AIM (NC)Female/Race (Population)LifeExpectancy(Years)Male/Race (Population)LifeExpectancy(Years)White (US)White (NC)Black (US)Black (NC)Hispanic (US)Hispanic (NC)Asian/Pac. Islander (US)Asian/Pac. Islander (NC)Amer. Indian/Alaskan Native (US)Amer. Indian/Alaskan Native (NC)81.480.878.477.885.4*88.9*83.580.3White (US)White (NC)Black (US)Black (NC)Hispanic (US)Hispanic (NC)Asian/Pac. Islander (US)Asian/Pac. Islander (NC)Amer. Indian/Alaskan Native (US)Amer. Indian/Alaskan Native (NC)76.775.772.371.280.2*84.1*78.772.7* No significant data availableIn 2013, the county with the highest life expectancy in North Carolina for men (79.2) wasWake County, and for women (83.2) was Chatham County.5IbidInstitute for Health Metrics and Evaluation. Life Expectancy in US Counties, by gender. lth-map Retrieved January 13, 2016.455
Every year, in every state, the death rate for men is higher than the rate for women.North Carolina: Age-Adjusted Death Rates (All Ages) for the Leading Causes of Death, by Sex(1999 - 52.0150.0100.062.450.057.140.529.555.5 53.427.921.6 22.330.824.018.5 21.415.5 19.75.30.0Mortality rates per 100,000; Age-Adjusted using 2014 Standard Populationa – Top 10 for Males in state, b – Top 10 for Females in stateNationalTopCause of DeathRateMaleFemaleTen(Male)All causes940.71,016.6 715.1Major cardiovascular Unintentional Injuriesa,b52.962.429.5Chronic Lower Respiratory es mellitusa,b26.927.921.6Alzheimer’s Diseasea,b19.022.330.8Influenza and Pneumoniaa,b22.124.018.5Kidney le:Female1.41.41.52.11.41.01.30.71.31.43.7Wonder - Centers for Disease Control and Prevention. Health Data Interactive. Underlying Cause of Death, 1999-2014.6
State-Specific Leading Causes of Mortality, by Gender and Race7North Carolina’s 10 Leading Causes of Death by Gender*Rank12345678910MenMajor cardiovascular diseasesCancerUnintentional injuriesChronic lower respiratory diseasesStrokeDiabetes mellitusInfluenza & PneumoniaAlzheimer’s diseaseKidney diseasesSuicideWomenMajor cardiovascular diseasesCancerStrokeChronic lower respiratory diseasesAlzheimer’s diseaseUnintentional injuriesDiabetes mellitusInfluenza & PneumoniaKidney diseaseSepticemia*Rankings only account for deaths due to singular cause of death and does not account for multiple causes of deathNorth Carolina’s 10 Leading Causes of Death by Race*Rank1567Non-Hispanic WhiteMajor cardiovasculardiseasesCancerStrokeChronic lower respiratorydiseasesUnintentional injuriesAlzheimer’s diseaseInfluenza & Pneumonia8910Diabetes mellitusSuicideKidney diseases234Rank1Asian/Pacific Islander234Major cardiovasculardiseasesCancerStrokeUnintentional injuries56Diabetes mellitusKidney diseases7Chronic lower respiratorydiseasesInfluenza & PneumoniaAlzheimer’s diseaseSepticemia8910Non-Hispanic BlackMajor cardiovascular diseasesCancerStrokeDiabetes mellitusHispanic/LatinoMajor cardiovasculardiseasesCancerUnintentional injuriesStrokeUnintentional injuriesKidney diseasesChronic lower respiratorydiseasesAlzheimer’s diseaseSepticemiaInfluenza & PneumoniaAlzheimer’s diseaseDiabetes mellitusChronic lower respiratorydiseasesKidney diseasesHomicideInfluenza & PneumoniaAmerican Indian/ AlaskanNativeMajor cardiovascular diseasesCancerUnintentional injuriesStrokeOther**CancerDiabetes mellitusChronic lower respiratorydiseasesAlzheimer’s diseaseHomicideSuicideMajor cardiovasculardiseasesStrokeChronic lower respiratorydiseasesUnintentional injuriesKidney diseasesHomicideInfluenza & PneumoniaDiabetes mellitusHomicide****Rankings only account for deaths due to singular cause of death and does not account for multiple causes of death**The 10 leading causes for “Other” may not necessarily be ranked as listed in the chart above, due to inadequate population data*** Data not available7ibid7
North Carolina: Years Potential Life LostYears of potential life lost (YPLL) is an estimate of the average years a person would havelived if he had not died prematurely. Premature death is considered any death that occurredbefore the age of 75. These numbers are reflective of the toll of premature deaths fromspecific causes affecting younger age groups. YPLL calculates the sum of all the years lostfrom all specific diseases for all North Carolina residents. For example, North Carolina maleslost 69,521 years of life in total from heart disease in 2014. For North Carolina in 2014, totalYPLL for all causes of death for males was 432,123 years and 279,227 years for females,which represents a 54.8% greater total years lost for males.North Carolina: Years of Potential Life Lost (YPLL) Before Age 75, 20138450,000400,000Years Potential Life omen50,0000Centers for Disease Control and Prevention, National Center for Injury Prevention and Control. Web-based Injury StatisticsQuery and Reporting System (WISQARS). http://webappa.cdc.gov/sasweb/ncipc/ypll10.html Retrieved January 14, 2016.* infant deaths of less than 7 days of age and fetal deaths of 28 weeks of gestation or more.88
Leading Causes of Death for BoysWhile the rates of birth defects, cancer, and heart disease are similar for both boys and girls,many more boys die from unintentional injuries, homicide, and suicide than girls. It can beconcluded that the higher rate of death in boys may be preventable.North Carolina: Age-Adjusted Leading Causes of Death for Ages 0-179(rates per 100,000; age-adjusted using 2010 Standard Population)Cause of DeathBoysAll causesUnintentional injuriesBirth defectsHomicideCancerSuicideHeart .61.12.2* negligible number1.73.60.60.91.3The higher rates unintentional injuries, homicide, and suicide may be explained, in part, byrisky behaviors. High school boys in North Carolina10 are more likely than girls to:Percentage of High School Students in North Carolina (2011)40%Boys35%Girls30%25%20%15%10%5%0%Not wear aseatbeltDrive whiledrinkingCarry aweapon(includingguns) Carry aweapon atschoolBe threatenedor injured witha weapon atschoolGet into aphysical fight(including atschool)Wonder. Centers for Disease Control and Prevention (CDC). Mortality by underlying cause: US/State, 1999-2014. RetrievedJanuary 15, 2016.10 Eaton, Danice K., et al. Centers for Disease Control and Prevention. (2011) Youth risk behavior surveillance-United States. spx Retrieved November 1, 2014. high school boys in North Carolina are significantly more at risk than the United States average.99
Two Specific Causes of Death:A Closer Look10
Suicide in North CarolinaFormer Surgeon General Dr. David Satcher has stated; “Suicide is our most preventable formof death.” For the nation (as of 2014), suicide is the third leading cause of death in males 1544, and the fourth leading cause of death for females in the same age group. On average,20.9 men per 100,000 will commit suicide, compared to 5.4 women, making suicide thesingle largest gender-based mortality disparity.11 By age group, suicide rates are highest formen over 85 years of age, and by race for Whites in North Carolina.North Carolina: Age-Adjusted Suicide Rates per 100,000 35.0Male9.33.71.71.30.0AmericanIndian/ AlaskanNativeAsian/ icBlackThe rate of suicide for men in North Carolina is 3.7 times the rate for women.Risk factors for suicide include: loss (relational, social, work, or financial), family history ofsuicide, history of child maltreatment, history of depression, history of mental disorders,history of alcohol and substance abuse, feelings of hopelessness, local epidemics of suicide,social isolation due to bullying and other factors, and unwillingness or inability to seek help formental health issues or suicidal thoughts.12Wonder. Centers for Disease Control and Prevention. Health Data Interactive. Retrieved January 14, 2016.Centers for Disease Control and Prevention. Suicide: Risk and Protective ide/riskprotectivefactors.html Retrieved February 7, 2014.111211
Prostate Cancer MortalityData found from the National Cancer Institute, State Cancer Profiles indicates that comparedto the national average, males overall in North Carolina are at higher risk for death fromprostate cancer.13In 2016, the American Cancer Society estimates:14 5,990 new cases of prostate cancer will bediagnosed among men in North Carolina.Obesity has been linked toprostate cancer, particularlyfor men who are obese beforethe age of 30.American Journal of Epidemiology 820 men will die of prostate cancer in NorthCarolina.The National Cancer Institute provides the following age-adjusted death rates for prostatecancer for the years 2008-2012 (per 100,000)13:Race/EthnicityOverallWhite (Non-Hispanic)Black (Includes Hispanic)Hispanic (Any Race)Asian/Pacific IslanderAmerican Indian/Alaska NativeNorth 17.89.416.1** Data has been suppressed to ensure confidentiality and stability of rate estimates. (less than 15 deaths per year)As of the 2008-2012 data (most currently available), the county in North Carolina with thehighest death rates due to prostate cancer:13 For White men (31.8) is Robeson County For Black men (84.7) is Richmond County For American Indian/Alaskan Native men (53.3) is Harris County With Caswell County having the highest prostate cancer death rate (46.4) overall in thestate for men, when not considering race/ethnicityNational Cancer Institute. State Cancer Profiles 2008-2012. http://statecancerprofiles.cancer.gov Retrieved: January 14, 2016.14American Cancer Society. Cancer Facts and Figures 2016 /documents/document/acspc-047079.pdf . Retrieved January 14, 2016.1312
Prostate Incidence Cancer Rates 2013Invasive Cancer Incidence Rates by State (Table 5.23.1M)Rates are per 100,000 persons and are age-adjusted to the 2000 U.S. standard population (19 age groups –Census P25–1130).15National Program of Cancer Registries (NPCR). Centers for Disease Control and Prevention. .aspx Retrieved January 14, 2016.1513
Prostate Death Cancer Rates 2013Cancer Death Rates by State (Table 5.23.2M)Rates are per 100,000 persons and are age-adjusted to the 2000 U.S. standard population (19 age groups – CensusP25–1130).16National Program of Cancer Registries (NPCR). Centers for Disease Control and Prevention. .aspx Retrieved January 14, 2016.1614
Explaining theGender Mortality Gap15
Why the Gender Mortality Gap?Simply put, there is a silent crisis in America, a crisis of epic proportions: on average,American men live shorter and less-healthy lives than American women. A recent study basedon data from the Centers for Disease Control and Prevention (CDC) on ambulatory care andhealth behavior illustrates just how wide the health care gulf between the two sexes is. Amongother things, the study found that:17 Women make nearly twice as many preventive care visits as men. In 2006, 22.8% of adultmen and 11.8% of adult women did not make any health care visits whatsoever. Overall, amongst those aged 18-64 years, 23.9% of men do not have a usual source ofhealthcare, as compared to 13% of women. 17.0% of North Carolina’s residents are currently uninsured. Of these, 52.4% are men. 18 A woman spends 615 more annually on healthcare and medicine ( 3,316) than a man( 2,701). Men are more likely to be regular and heavy alcohol drinkers, heavier smokers who are lesslikely to quit, non-medical illicit drug users, and are more overweight compared to women.A study done by The Commonwealth Fund (see page 24 of this report) presents researchrevealing that an alarming proportion of American men have only limited contact withphysicians and the health care system generally. Many men fail to get routine checkups,preventive care, or health counseling, and they often ignore symptoms or delay seekingmedical attention when sick or in pain. When they do seek care, social taboos orembarrassment can sometimes prevent men from openly discussing health concerns withtheir physicians.Some researchers19 have offered several possible explanations for this disparity. One theoryis that women generally are responsible for their family’s health and so may think abouthealth care needs more than men. They are more likely to have a usual source of care, whichis a strong predictor of health care utilization. They also tend to use medical care forscreening and health education more often than men do. Women have been said to also bemore likely to report and act on illness.Other research has shown that the mortality gap is mostly due to gender differences in theway health is viewed or discussed. “Hundreds of empirical studies consistently show that menare more likely to engage in almost every health risk behavior (e.g., alcohol use, tobacco use,not seeking medical care) increasing their risk of disease, injury, and death.”20Pinkhasov, Ruben M., et al. Are men shortchanged on health? Perspective on health care utilization and health riskbehavior in men and women in the United States. International journal of clinical practice 64.4 (2010): 475-4818 The Number of Estimated Eligible Uninsured People for Outreach Targeting. (2013).Center for Medicaid and MedicareServices Health Insurance Marketplace. data.html RetrievedDecember 19, 201319 Tomkins, Joshua. Why Men Avoid the Doctor. /avoid.html Retrieved November 14, 2013.20 Mahalik, J. R., Burns, S. M., & Syzdek, M. (2007). Masculinity and perceived normative health behaviors as predictors ofmen's health behaviors. Social Science & Medicine, 64(11), 2201-2209.1716
The reason for this, according to researchers, is that the way a man perceives what is“normal” masculine health behavior influences his own behavior. Men often adopt traditionalmasculine ideals, and these ideals often involve riskybehavior. Thus, the trend continues from generation to“Men are less likely to seekgeneration. Researchers have found no correlation, on thepreventive healthcareother hand, of such trends for women. Women are lessmeasures than women.”motivated by what they perceive to be as “normal” for otherAre men shortchanged on health?women.2010, CDCMen’s devotion to the workplace may also be partly toblame. Studies have shown that men are less likely than women to take time off from work forhealth related issues. Men’s reluctance to make timely health care visits, however, is not onlya function of work and time, but also of the way our culture socializes boys from the earliestage: “big boys don't cry." That attitude extends to the workplace where men feel compelled toignore their own physical (and mental) health needs and put in a "full 40 hours" . or more .knowing in their hearts that if they take time off for anything less than a true healthemergency, they will lose status in the workplace, and, in the case of hourly workers, mostprobably their job.17
Aging in America: Effect on the Male-Female RatioAlthough the older population in America is living longer and has a better quality of life thanany other previous generation, disparities among gender still exists. Due perhaps to the lackof awareness and culturally induced behavior patterns, men generally have poorer healthhabits than women, and are generally in worse health condition. This leads to prematuredeath, and thus, a lower life expectancy for men.Health data reflects on the poor health status of aging men and its effect on spouses andloved ones: Despite the fact that approximately 100,000 more males than females are born eachyear, the number of living males decreases rapidly as they age.21 As of 2012, older women outnumber older men at 23.4 million older women to 17.9million older men.22 Almost half of older women (46%) age 75 live alone.19 Due to the fact that men die earlier, older women are nearly twice as likely to reside in anursing home, and are more than twice as likely to live in poverty.20 Older women have less money than their male counterparts. The median income of olderpersons in 2011 was 27,707 for males and 15,362 for females. 19 Older men were much more likely to be married than older women--72% of men vs. 45% ofwomen. 37% older women in 2012 were widows.19 7 out of 10 “baby boom” women will outlive their husbands and many can expect to bewidows for 15 to 20 years.23 This is because women often marry older men and then goon to outlive their husbands.US Administration on Aging. Aging Statistics. http://www.aoa.gov/AoARoot/Aging Statistics/index.aspx RetrievedJanuary 12, 2011.22 US Administration on Aging. A Profile of Older Americans: 2012. http://www.aoa.gov/AoARoot/Aging Statistics/Profile/2012/docs/2012profile.pdf Retrieved November 14, 2013.23 U.S. Administration on Aging. Meeting the Needs of Older Women: A Diverse and Growing Population, The Many Faces ofAging. omen.htm Retrieved November 14, 2013.2118
Aging in North CarolinaIn North Carolina, the male-female ratio converges in the late 20s and then drops rapidly asshown in this chart developed from year 2010 Census data.North Carolina Resident Population: 2010 Census by Age and Sex24AgeBoth sexesTotal populationUnder 5 years5 to 9 years10 to 14 years15 to 19 years20 to 24 years25 to 29 years30 to 34 years35 to 39 years40 to 44 years45 to 49 years50 to 54 years55 to 59 years60 to 64 years65 to 69 years70 to 74 years75 to 79 years80 to 84 years85 years and 2128,674101,823103,205Malesper 997.695.693.590.490.187.582.473.862.442.9Male – Female Ratio by Age Groups 2000 and 2010: USA22Male-Female Ratio120100806020004020102000 to 5 5 to 14 15 to2425 to3435 to4445 to5455 to6465 to7475 to8485 Age0 to 55 to 1415 to 2425 to 3435 to 4445 to 5455 to 6465 to 7475 to 8485 can FactFinder, U.S. Census Bureau. Age Groups and Sex: 2010. community facts.xhtml Retrieved November 8, 20132419
Points of Hopeby Eric "Ric" Bothwell, DDS, MPH, PhDThis report of the health of the citizens of the state of North Carolina highlight long standinggender -related health disparities that have been largely invisible to most people in the U.S.Overcoming these health disparities will be a difficult task but has never been moreachievable than it is today.For over a decade, Men’s Health Network has in fact been supporting efforts such asengaging/offering to assist boys and men toward accepting better health practices in adiversity of “safe and male friendly” environments with considerable success. And this samenuanced approach toward offering help and support from a trusted person may help explainwhy research continues to show that women are successful in promoting better healthbehavior for the males in their lives by supporting, nudging, or even demanding it.Research has shown several radical points of hope: The Internet: A promising approach for assisting males to accept help on virtually anytopic including health that is anonymous, safe, and private is the internet. Like using aGPS when one is lost (which males disproportionately buy), the internet is increasinglybeing shown to be a powerful tool in reaching males with information.Male Peer Support: From the other end of the technology spectrum, the timelessapproaches of male peer support and trans-generational mentoring continues to be auseful approach to assisting males adopt healthy life styles and accept needed help.Several successful programs such as Aha Kane and Sources of Strength have shownthe power of male-male mentoring.Targeted Suicide and Violence Prevention Programs: In response to rising rates ofsuicide in its predominantly male population, the Air Force in the early to mid-1990’simplemented a comprehensive multi-dimensional suicide prevention initiative.Comparing rates from 1990-1996 with those observed during the period of theprevention program (1997-2002), suicide rates were reduced by 33%. Homicide rateswere reduced 51%, severe domestic violence was reduced 54%, moderate domesticviolence was reduced 30% and unintentional injuries dropped 18%25.Men’s Health Network seeks to reduce health disparities by focusing on two broad areas:1. Increasing quality, access and utilization of critical primary health care services forprevention and controlling chronic and infectious diseases ( thus improving healthoutcomes) and,2. Targeting recognized social determinants of health (positive and negative) throughmultifaceted approaches in community settings that address hope, healing, andwellness for males and their families.We strongly encourage you to join us in this critical effort. As John F. Kennedy noted:There are risks and costs to action. But they are far less than the long range risks ofcomfortable inaction.Knox KL, Litts DA, Talcott GW, Feig JC, Caine ED. Risk of suicide and related adverse outcomes after exposure to a suicideprevention programme in the US Air Force: cohort study. BMJ. 2003;327:1376–1380.2520
Addendum21
Life Expectancy: USASource: CDC/NCHS/ Health Data Interactive:
Men’s Health TM North Carolina A report on the health and well-being of men and boys in North Carolina. Recognizing and preventing men's health problems is not just a man's issue. Because of its impact on wives, mothers, daughters, and sisters, men's health is truly a family issue. Represen

