Transcription
International Journal of Scientific & Engineering Research Volume 10, Issue 5, May-2019ISSN 2229-55181592Application of Machine Learning in HighFrequency Trading of StocksObi Bertrand ObiWorldquant University201 St. Charles Avenue, Suite 2500New Orleans, LA 70170, USAobibertrand@gmail.comAbstractAlgorithmic trading strategies have traditionally been centered on follwing the market trends andthe use of technical indicators. Over the years High Frequency algorithmic Trading has been left only inthe hands of institutional players with deep pockets and lots of assets under management, despite hugereturns involved. In this project webuilt trading strategies by applying Machine Learning models totechnical indicators based on High Frequency Stock data. The result is an automated trading systemwhich when applied to any stock could generate returns which are ten times higher than the marketreturns without significant increase in volatility. With advancement in technology High FrequencyAlgorithmic trading can be undertaken even by individuals or retail traders with moderate initialinvestment and technical skills.IJSERKeywords:Machine Lerning; Prediction of stock prices movements; Classification reports;Algorithmic trading; High frequency trading; Key performace indicators1. IntroductionNot too long ago, Algorithmic Trading was only available for institutional players with deeppockets and lots of assets under management. Recent developments in the areas of open source, opendata, cloud computing and storage as well as online trading platforms have leveled the playing field forsmaller institutions and individual traders, making it possible to venture in this fascinating discipline withonly a modern notebook and an Internet connection. Nowadays, Python and its eco-system of powerfulpackages is the technology platform of choice for algorithmic trading. Among others, Python allows youto do efficient data analytics (with e.g. numpy, pandas), to apply machine learning to stock marketprediction (with e.g. scikit-learn) or even make use of Google’s deep learning technology (withtensorflow) and Microsoft’s CNTK.Algorithmic trading basically refers to the trading of financial instruments based on some formalalgorithm. An algorithm is a set of operations (mathematical, technical) to be conducted in a certainsequence to achieve a certain goal. For example, there are mathematical algorithms to solve a Rubik’scube (The Mathematics of the Rubik’s Cube or Algorithms for Solving Rubik’s Cube). Such an algorithmcan perfectly solve the problem at hand via a step-by-step procedure. Another example is algorithms forfinding the root(s) of an equation (if it (they) exist(s) at all). In that sense, the objective of a mathematicalalgorithm is often well specified and an optimal solution is often expectedIJSER 2019http://www.ijser.org
International Journal of Scientific & Engineering Research Volume 10, Issue 5, May-2019ISSN 2229-55181593High-frequency trading(HFT)is a type of algorithmic trading characterized by complex computeralgorithms that trade in and out of positions in fractions of seconds, leveraging arbitrage strategies inorder to profit from the public markets. Commonly, traders take advantage of the penny spread betweenthe bids-ask on equities. For the typical retail trader, this would seem redundant and the pay-off would beminuscule. For HFTs, the profit from the spread accumulates and as thousands of trades are executed,there are millions of dollars to be made [1].Traditionally, financial markets operated on a quote-driven process where a few market makersprovided the sole liquidity and prices for Financial Assets. Recently, major developments have beenmadeto automate the Financial Markets which have led to many trading firms using computer algorithms totrade the Assets. High Frequency Trading (HFT), in particular, has been a major topic due to the featuresthat distinguishes it from electronic and manual trading. This includes the extremely high speed ofexecution (microseconds), multiple executions per session, and very short holding periods (usually lessthan a day).1.1. Problem statementTime series data in financial markets are highly nonlinear, nonstationary and noisy in nature.Traditional models based on statistical methods, such as the Autoregressive Moving Average (ARMA)model, Autoregressive Integrated Moving Average (ARIMA) model, and General AutoregressiveConditional Heteroskedasticity (GARCH) model, suffer from limitations due to their linearityassumption. Predicting how the stock market will perform is one of the most difficult things to do. Thereare so many factors involved in the prediction such as; physical factors, psychological, rational andirrational behaviour, etc. All these aspects combine to make share prices volatile and very difficult topredict with a high degree of accuracy. Waren Buffet states that: “Forecasts may tell you a great dealabout the forecaster; they tell you nothing about the future.” Hence finding the right algorithm toautomatically and successfully predict and trade in financial markets is the Holy Grail in finance.IJSER1.2. Project ObjectivesThe main objective of this project is to develop a High Frequency Trading System which usesMachine Learning to predict the movements of stock market prices with reasonable level of accuracyandto trade the stock with simple trading strategy to generate adequate performance. Other objectives includethe following:1. Comparative analysis of Machine learning Algorithims on High Frequency Stock data todetermine algorithms with high predictive power for stock price movements2. Perform technical analyses as features to the Machine Learning models in the High frequencyTrading System3. Generate and track adequate performance from the High frequency Trading System.4. Add to the elaborate body of literature on application of Machine learning to Finance and HighFrequency Trading1.3. HypothesisMachine Learning Algorithms cannot predict stock price movement with reasonable amount ofcertainty in High Frequency TradingIJSER 2019http://www.ijser.org
International Journal of Scientific & Engineering Research Volume 10, Issue 5, May-2019ISSN 2229-551815942. Literature ReviewSeveral authors have employed Machine learning technologies in predicting and trading stockmarkets. The following Algorithms have been used in various situations:Because of their ability to model nonlinear relationships without pre-specification during themodeling process, neural networks (NNs) have become a popular method in financial time-seriesforecasting. NNs also offer huge flexibility in the type of architecture of the model, in terms of number ofhidden nodes and layers. Indeed, Pekkaya and Hamzacebi compare the results from using a linearregression versus a NN model to forecast macro variables and show that the NN gives much better results[3].Many studies have used NNs and shown promising results in the financial markets. Grudnitski andOsburn implemented NNs to forecast S&P500 and Gold futures price directions and found they were ableto correctly predict the direction of monthly price changes 75% and 61% respectively [4]. Another studyshowed that a NN-based model leads to higher arbitrage profits compared to cost of carry models [5].Phua, Ming and Lin implement a NN using Singapore’s stock market index and show a forecastingaccuracy of 81% [6].Another popular machine learning classification technique that does not require any domainknowledge or parameter setting is the decision tree. It also often offers a better visually interpretablemodel compared to NN, as the nodes in the tree can be easily understood. The simplest type of decisiontree model is the classification and regression tree (CART). Sorensen et al. show that CART decisiontrees perform better than single-factor models based on the same variables in picking stock portfolios [7].Another study found that a boosted alternating decision tree with expert weighing generated abnormalreturns for the S&P500 index during the test period [8]. To improve accuracy, some studies used therandom forest algorithm for classification, Booth et al. show that a regency-weighted ensemble of randomforests produce superior results when analyzed on a large sample of stocks from the DAX in terms of bothprofitability and prediction accuracy compared with other ensemble techniques [9]. Similarly, a gradientboosted random forest model applied to Singapore’s stock market was able to generate excess returnscompared with a buy-and-hold strategy [10]. Some recent researches combine decision tree analysis withevolutionary algorithms to allow the model to adapt to changing market conditions. Hsu et al. presentconstraintbased evolutionary classification trees (CECT) and show strong predictability of a company’sfinancial performance [11].IJSERSupport Vector Machines (SVM) is also often used in predicting market behaviors. Huang et al.compare SVM with other classification methods (random Walk, linear discriminant analysis, quadraticdiscriminant analysis and elman backpropagation neural networks) and finds that SVM performs the bestin forecasting weekly movements of the Nikkei 225 index [12]. Nair et al. propose a system that is agenetic algorithm optimized decision tree support vector machine hybrid and validate its performance onthe BSE-Sensex and found that its predictive accuracy is better than that of both a NN and Naive bayesbased model [13]While some studies have tried to compare various machine learning algorithms against eachother, the results have been inconsistent. Patel et al. compares four prediction models, NN, SVM, randomforest and naive-Bayes and find that over a ten year period of various indices, the random forest modelperformed the best [14]. However, Ou and Wang examine the performance of ten Machine learningclassification techniques on the Hang Seng Index and found that the SVM outperformed the other models[15].IJSER 2019http://www.ijser.org
International Journal of Scientific & Engineering Research Volume 10, Issue 5, May-2019ISSN 2229-551815953. Methodology3.1. Background to study areaThis project is centered on stocks in the Dow Jones Industrial Average (DJIA). The Dow JonesIndustrial Average [16], or simply the Dow, is a stock market index that indicates the value of 30 large,publicly owned companies based in the United States, and how they have traded in the stock marketduring various periods of time. The value of the Dow is not a weighted arithmetic mean and does notrepresent its component companies' market capitalization, but rather the sum of the price of one share ofstock for each component company. The sum is corrected by a factor which changes whenever one of thecomponent stocks has a stock split or stock dividend, so as to generate a consistent value for the index. Asat the 31st of December 2018; the Market capitalisation of the Dow Jones Industrial Average is 6.56trillion. The components are traded in the New York Stock Exchange (NYSE) and NASDAQ. The choiceof this index is due to the availability of high-frequency financial data with high order-to-trade ratios.Alternative Indices that could be used are: S&P 500, NIFTY, HANSENG, CAC 40, etc.3.2. Data collectionOne of the 30 Stocks of the Dow Jones Industrial Average (DJIA) based on their historical SharpRatios is selected. High Frequency Historical (Minute by minute) Stock Datais downloaded from YahooFinance [2] using a Data Mining Functiondesigned in Python. Stock prices dataset downloaded includethe following features: Date/Time, Open, High, Low, Close, Volume, and Adj. Close, for the last 2700trading periods (Minute) consisting of 7 Trading Days.IJSER3.3. Data analysisThree stages of Data analysis are conducted: Feature engineering through Technical Analysis,Machine Learning and choice of high performant learning algorithm, forcasts of market trends andapplication of simple trading strategy.3.3.1. Feature engineering: Several features are calculated and added to the features listed above (in datacollection). These features will be computed using the following Technical Analysis on the stock datadownloaded (Open, High, Low, Close, Volume, and Adj. Close). The features are as follows: Trend Indicators: Average directional index (A.D.X.), Commodity channel index (CCI),Detrended price oscillator (DPO), Know sure thing oscillator (KST), Ichimoku Kinkō Hyō,Moving average convergence/divergence (MACD), Mass index, Moving average (MA),Parabolic SAR (SAR), Smart money index (SMI), Trend line, Trix, Vortex indicator (VI) Momentum Indicators: Money flow index (MFI), Relative strength index (RSI), Stochasticoscillator, True strength index (TSI), Ultimate oscillator, Williams %R (%R) Volume Indicators: Accumulation/distribution line, Ease of movement (EMV), Force index (FI), Negative volume index (NVI), On-balance volume (OBV), Put/call ratio (PCR), Volume–pricetrend (VPT) Volatility Indicators : Average true range (ATR), Bollinger Bands (BB), Donchian channel,Keltner channel, CBOE Market Volatility Index (VIX), Standard deviation (σ)These indicators (features) are computed and included on the data set based on the degree ofrelaationship (coorelation) or the effects of these features with the movement in stock prices.3.3.2. Machine learning models: The following Supervised learning classificationalgorithms (Asdiscussed in quantinsti) [17] will be employed in the forecasting of stock markets1. Decision Trees (CART)IJSER 2019http://www.ijser.org
International Journal of Scientific & Engineering Research Volume 10, Issue 5, May-2019ISSN 2229-55182.3.4.5.6.7.8.1596Logistic regression(LR)Naïve Bayes (NB)Support Vector Machines (SVM)K. neighbours(KNN)Random Forest(RF)Linear Decriminant Analyses(LDA)Boosting with Extreme Gradient Boosting(XGBOOST)The dataset represents; 27 features and one target(y). The target presents an increase in stock price (1) anda decrease in stock price (-1) per trading minute. This data is scaled using the standard scaler algorithm inscikit learn. The data is then partition into training set (80%) and a test set (20%) using themodel selection (train test split) algorithm in scikit learn. The data is then fed to the Machine learningalgorithms for modelling.3.3.3. Trading strategy (backtesting)1. Buy and hold – the stock is purchased at the opening price on the first minute of the test periodand then sold at the closing price of the last minute of the test period.2. The model itself is evaluated as follows: if the model predicts the price will close higher, then thestock is bought at the open and sold at the close. If the model predicts the price will close lower,then the stock is sold at the open and bought at the closeIJSER3.4. Project implementation toolsThe High Frequency Trading system is implemented in Python 2.7, Anaconda and JupiterNotebook using the Following Liabraries: Numpy for Data analysisPandas for Data AnalysisScipy for statistical analysisScikit learn for implementation of Machine learning AlgorithmsMatplotlib and seaborn for graphical representation of results.3.5. Presentation of results Heat maps for feature engineering, showing relationship of features and technical indicators Table showing performance matrix of different Machine Learning Algorithms Table showing the classification report of the Machine Learning Algorithm retained for theproject Line graphs showing evolution in performance of the machine learning trading strategy againstthe market(Buy and Hold) Key performance indicators Matrix showing annualised performance ratios of the MachineLearning Trading system and the market SWOT (Streghth, Weakness, Opportunities and Threats) Analyses of the trading system will alsobe conducted4. ResultsInteresting results were obtained from the application of the Machine learning project as follws:IJSER 2019http://www.ijser.org
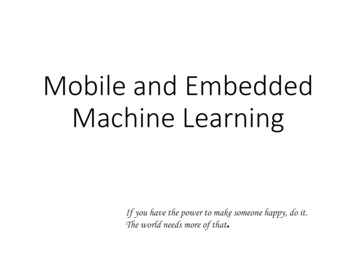
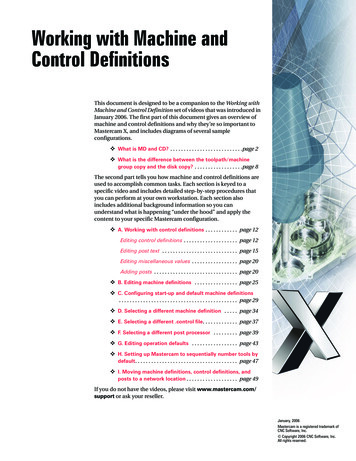
International Journal of Scientific & Engineering Research Volume 10, Issue 5, May-2019ISSN 2229-551815974.1. Heatmap of relationship of features or indicators used for el.From the heatmap above it is clear that all the features contribute to the prediction of the targetvariable (y). The most outstanding features are: The rate of change (ROC), returns (RET), RelativeStrength Index (RSI), Commodity Channel Index (CCI). The target variable (y); represents the increae (1)or the decrease (-1) in stock prices.IJSER 2019http://www.ijser.org
International Journal of Scientific & Engineering Research Volume 10, Issue 5, May-2019ISSN 2229-551815984.2. Performance of machine learning algorithms in prediction of stock price movementsEight classification algorithms were used. The accuracy score of the different Machine LearningModels were computed. The results are shown on table 1. below:Table 1.Acuracy score of machine learning models:ModelDescriptionAcuracy Score0LRLogistic Regression Classifier0.9943071LDALinear Decriminant Analysis Classifier0.8880462KNNK Nearest Neighbours Clasifier0.8273243CARTDecision Trees Classifier1.0000004NBGausian naïve Bayes Classifier0.8102475SVMSupport Vector Machines Classifier0.9544596RFRandom Forest Classifier1.000000XGBoostExtreme Gradient Boosting Classifier1.0000007IJSERFrom the result above; all the models achieve considerable level of performance in predicting movementsin stock prices. Outstanding models include: Decision Trees (CART), Random Forest (RF), and ExtremeGradient Boosting (XGBoost) with an accuracy score of 100%.4.2.1. Hypothesis testing: The Null hypothesis stipulates that Machine Learning Algorithms cannotpredict movements in high frequency stock prices with reasonable level of accuracy:The Hypothesis was tested in python by applying eight Machine learning models to forecast the directionof movement of high frequency (One minute) stock prices obtained from Yahoo Finance. Theminumumaccuracy score of the models is 80% justifying the hypothesis that application of Machine Learningalgorthms can predict stock prices movements in High Frequency Trading setting.Decision Trees Classifier (CART) is thus retained to predict stock prices movements for thepurpose of this project.4.2.2. Detail performance of machine learning algorithm retainedDecision Trees Classifier was used to train 80 Percent of the data set consisting of 2105 data point with27 features. The model was then use to classify or predict the target(y) consisting of 527 data points. Thefollowing classification performance report was produced in table ningalgorithmprecisionRecallf1-scoresupport-11avg / From the table, the model predicts two classes of data points “Y”; a predicted decrease in stock price isdenoted by “-1” while a predicted increase is denoted by “1”. The model predicted 245 decreases and282 increases for the stock price of IBM tested. This is inline with the target variable (yTest) giving anIJSER 2019http://www.ijser.org
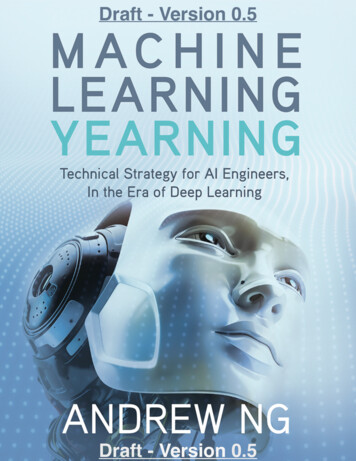
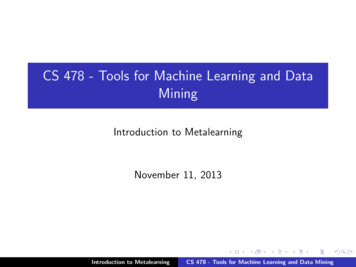
International Journal of Scientific & Engineering Research Volume 10, Issue 5, May-2019ISSN 2229-55181599accuracy score of 100% as denoted by the f1-score. This also justifies the hypothesis that MachineLearning Algorithms can predict the stock market with reasonable accuracy.4.3. Performance of the trading strategyThe performance of the trading strategy is measured against the market returns (Buy and Hold strategy).The trading strategy is as follows: If the Model predicts an increase in price; we buy at the OpenIf the model predicts a decrease in stock price, we sell the stock.The asumption for this strategy is that short selling is allowwed, No transaction cost and there isequal investment.The performance of this strategy and the market (‘Buy and Hold’) is presented in the following Linegraphs and performance table as follows:4.3.1. Performance evolutionIJSERFigure 2: Evolutions of Cumulative Returns:Evolution of returns shows that at the end of the trading period the cumulative strategy returns is 10 timeshigher than the market returns. This return is generated from 527 trading operations (282 Purchase ordersand 245 sales orders of stocks). These transactions are all carried out within one day (The 8th of March2019) representing the test set in the prediction model. This is highly different from low frequency tradingsystem which could have conducted only one or two trades per stock in a day.IJSER 2019http://www.ijser.org
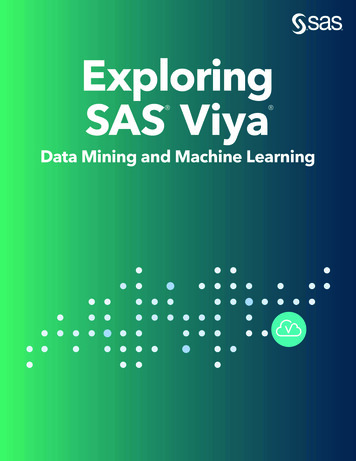
International Journal of Scientific & Engineering Research Volume 10, Issue 5, May-2019ISSN 2229-551816004.3.2: Key performance indicators of the strategy Vs atorStrategy returnMarket returnAnnualized Return0.51219.5550Annualized Std Dev0.06960.3508Avg Loss Return-0.0038NaNvg Win Return0.00490.0379Gain to Pain Ratio2.0517NaNLake Ratio0.14070.0000Loss Rate0.32450.0000IJSERMax Drawdown-0.48240.0000Sharpe Ratio7.352927.2359Trade Expectancy0.0045NaNWin Rate0.67551.0000From the table above; the performance indicators of the strategy are highly superior to those of themarket:1. The annualised return of the strategy is almost 10 times higher than that of the market. Hencean investor using Machine Learning system could perform significantly higher than the market2. The annualised standard deviation shows the risk or volatility of the system. Here the volatilityof the strategy is higher than the Market. This is common in HFT, due to the fact that severaltrade orders of thesame stock are carried out in minutes, coupled with orders received from otherinvestors causes the market to be highly volatile. This justifies the fact that High fequencymarkets are highly volatile.3. The Average Loss Return for the strategy is 0, compared to -0.0038 for the market.This is dueto the fact that the strategy model could comfortably predict the stock movements in the periodconcerned4. The Average Win return is also 0.0379, greater than 0.0049 for the market. This supports theincrease in strategy returns morethan the market5. The Lake Ratio, Loss rate and the Maximum Draw Down for the strategy is 0. This surportsthe positive evolution of cumulative returns as shown on Figure 2.6. The sharp Ratio is the ratio of excess returns and volatitility (Annualised standard deviation).The strategy Sharp Ratio (27) is highly superior to that of the Market (7). This is due to theminimal risk (volatility) of the strategy of 0.3. This justifies the fact that the increased strategyreturns is due to smart trading strategy (using Machine learning), and not an increase in volatility.7. The Win Rate of the strategy is 100% as compared to 65% for the market. This with otherindicators shows clearly that Machine Learning Algorithms could effectively predict stock pricemovements, trade and produce superior return than the market in High Frequency Environment.IJSER 2019http://www.ijser.org
International Journal of Scientific & Engineering Research Volume 10, Issue 5, May-2019ISSN 2229-551816014.4. Swot analysis of the systemThe strengths, weaknesses, opportunities and threats of the sytem are analysed below:4.4.1. Strengths1. Ability to generate several trades(527) in a day using simple machine learning strategy on HighFrequency data2. The system can make use of trading opportunities immidietely as they present themselves inminutes.3. Ability to generate superior returns about 10 times higher than the market4. Simple trading strategy based on accurate prediction of market movements using simple MachineLearning Algorithms5. High Win rate of 100% with a win return per trade of 3%6. Increased anualised sharp ratio leading to high alpha generation and higher profits.7. It ensures "best execution" of trades as it minimizes the human element in trading decisionmaking.8. Improves liquidity with lesser Drawdowns9. The system also reduces transactions costs significantly due to limited human interferences10. The system performs significantly well on all the stocks in Dow Jones Industrial Average indexand even on stocks out of the indexIJSER4.4.2. Weaknesses1. Increase in volatility (from 6% to 35%) due to large number of trades within a limited time frame.2. The system is not very interactive to the user. opportunities exist to make the system fullyfunctional and interactive3. Require huge amount of time in designing the functions and optimising the algorithms.4. Strict monitoring of the system to avoid system overruns and failures5. Difficulties in applying the system to several(morethan one) stock at a time due to difficulties inobtaining free High frequency data6. Market sentiment indicators and Government regulation were not included as part of the featuresset. These indicators can greatly influence the market returns7. Transaction cost and other expenses are not factored into the system further development willinclude the modules4.4.3. Opportunities1. Availbility of performant computers, software and internet facilities which facilitates theimplementation of High Frequency algorithmic trading2. Availability of simple programming languages, application development tools and modules likepython, pandas, scikit learn, statsmodels, CNTK, matplotlib, Technical analyses library, etc tofacilitate the designing of this project3. Availability of huge trading opportunities in minutes to take advantage of.4. Availability of financial markets with regulatory mechanisms (Securities Exchange Commision inUSA, etc) to curtail the effects and imperfections of high frequency algorithmic trading.4.4.4. Threats1. Unavailability of free quality High Frequency data for longer period of times. For this project wecould only get one minute data for the last seven trading days.2. Increase in volatility could lead to frequent stock market breakdowns and imperfections3. It requires high testing, monitoring and regulation as error in the system could lead to high lost ofcapital4. It requires huge investment for the system implementation and trading.IJSER 2019http://www.ijser.org
International Journal of Scientific & Engineering Research Volume 10, Issue 5, May-2019ISSN 2229-551816025. Return margins are very tiny. Low investment and volatility will lead to very low profits and lowcash flow.6. High cost of acquisition of data for the trading sytem on longer time frames.4.5. Further Research:Further research will be based on building a fully functional interactive Algorithm trading sytem in thefollowing areas: Continue and build a fully functional and interactive trading system with multiple stcoks andportfolios at a time.Build a database of historical high frquency stock data for major stock exchanges in the worldand populate it with Data for the last five years of trading (Data would be purchased).Add other technical indicators to the system and enable the system to trade based on technicalindicators and machine learning at a time.Add other Machine Learning and Reinforcement Learning algorithms to trade combination oftechnical indicators and machine learning on huge High Frequency stock dataAdd Options, Commodities, Forex and Cryto data on the system for effective High frequencyalgorithmic tradingDevelop and add other backtest functions based on technical indicatorsIJSER5.0 ConclusionEnormous opportunities exist in High Frequency trading with the possibility of makingexceptional returns within the shortest possible time. Technological advancements and application ofMachine Learning algorithms facilitates the implementation of High Frequency Trading and developmentof performant trading strategies by individuals, retail and institutional traders. Machine Learning is thusrecommended for modelling High frequency trading strategies.AcknowledgementsMy immense gratitude goes to Worldquant University for a challenging opportunity in developing mycapacity in modern technology and applications in Finance. Special appreciation goes to the Faculty andProfessors for their regular support through out the program.ReferenceThis project and codes are found on my github page: . Other references consulted are as follows:[1].[2].[3].[4].[5].[6].[7].[8].High Frequency cy trading.Yahoo e/chart.Mehmet Pekkaya and Coŧkun HamzaÃğebi. An application on forecasting exchange rate by using neuralnetwork. Congress of YAEM, 27, 2007.Gary Grudnitski and Larry Osburn. Forecasting s&p and gold futures prices: An application of neuralnetworks. Journal of Futures Markets, 13:631–643, 1993.Shang-Wu Yu. Forecasting and arbitrage of the nikkei stock index futures: Anapplicationofbackpropagationnetworks. Asia-Pacific Financial Markets, 6:341– 354, 1999.Ming D. Phua, P.K.H. and W. Lin. Neural network with genetically evolved algorithms for stocks prediction.Asia-Pacific Journal of Operational Research, 18:103–107, 2001.Miller-Keith L. Sorensen, Eric H. and Chee K. Ooi. The decision tree approach to stock selection. Journal ofPortfolio Management, 27:42, 2000.GermanCreamerandYoavFreund. Automatedtradingwithboostingandexpert weighting. Quantitative Finance,4:401–420, 2010.IJSER 2019http://www.ijser.org
International Journal of Scientific & Engineering Research Volume 10, Issue 5, May-2019ISSN 7].[18].1603Gerding Enrico Booth, Ash and Frank McGroarty. Automated trading with performance weighted randomforests and seasonality. Expert Systems with Applications, 41:3651–3661, 2014.Qing-Guo; Li Jin Qin, Qin; Wang and Shuzhi Sam Ge. Linear and nonlinear trading models with gradientboosted random forests and application to Singapore stock market. Journal of Intelligent Learning Systemsand Applications, 5:1–10, 2013.Yuan Lin Hsu, Chi-I; Hsu and Pei Lun Hsu. Financial performance prediction using constraint-basede
Algorithmic trading strategies have traditionally been centered on follwing the market trends and the use of technical indicators. Over the years High Frequency algorithmic Trading has been left only in the hands of institutional players with deep pockets and lots o