Transcription
MICCAI Workshop on:Biophotonics Imagingfor Diagnostics and Treatment6 October, 2006Bjarne Kjær ErsbøllThomas Martini Jørgensen (Editors)Kgs. Lyngby 2006IMM-TECHNICAL REPORT-2006-17
MICCAI 06Workshop on Biophotonics Imagingfor Diagnostics and TreatmentOctober 6, 2006ProceedingsEditors:Bjarne Kjær ErsbøllThomas Martini JørgensenSponsors:Biophotonics Network, DenmarkBIOP Graduate SchoolRisø National LaboratoryTechnical University of Denmark
Technical University of DenmarkInformatics and Mathematical ModellingBuilding 321, DK-2800 Kgs. Lyngby, DenmarkPhone 45 45253351, Fax 45 NICAL REPORT: ISSN 1601-2321ISBN: 87-643-0116-8
PrefaceBiophotonics can be defined as the study of the interaction of light withbiological material. With the recent advances in biomedical science, ourunderstanding of the mechanisms of human health and disease has extendedinto the regime of cellular and molecular structure and function. The ability toimage, analyze, and manipulate living tissue at this level (and to do so in aminimally- or noninvasive manner) has become essential for continuedprogress in biomedical research and development. Light is unique in that itcan be utilized to perform exactly these functions; and as a consequencebiophotonics is widely regarded as the basis for the next generation of clinicaltools and biomedical research instruments.With bioimaging the impact and amount of information contained in visualdata is going to be huge. For this reason, imaging remains one of the mostpowerful tools in biomedical research.
Contents1Hyperspectral image analysis: Some applications inbiotechnology and their prospective solutionsMark Berman et al., CSIRO, Australia7Quantifying composition of human tissues from multispectral images using a model of image formationEla Claridge et al., School of Computer Science, The Universityof Birmingham, UK15Multispectral recordings and analysis of psoriasis lesionsLine H. Clemmensen and Bjarne Ersbøll, IMM, DTU, Denmark19Creating surface chemistry maps using multispectralvision technologyJens Michael Carstensen et al., Videometer A/S, Denmark29Optical imaging of the embryonic heart for a betterunderstanding of congenital heart defectsTalât Mesud Yelbuz, Dept. of Pediatric Cardiology and IntensiveCare Medicine, Hannover Medical School, Hannover, Germany33Stereo reconstruction of the epicardium for opticalfluorescence imagingDesmund Chung et al., Department of Medical Biophysics,University of Toronto, Canada41Biomedical applications of terahertz technologyVincent Wallace, Teraview, United Kingdom43The physical principles of chemical recognition in terahertzspectral imagingPeter Uhd Jepsen and Stewart J. Clark, COM, DTU, Denmark
51A bidimensional signal processing approach to vesicletrafficking analysis in 3D T fluorescence videomicroscopyIkhlef Bechar and Alain Trubuil, Unité de Mathématiques etInformatique Appliquées, INRA Jouy-en-Josas, France61Characterization of pre- and postoperative macular holesfrom retinal OCT imagesJakob Thomadsen et al., Netcompany IT and BusinessConsulting, Denmark69Texture and wavelet based lesion classification usingcolor imagesArtur Chodorowski et al., Signals and Systems, ChalmersUniversity of Technology, Sweden75Preliminary clinical results for the in vivo detection ofbreast cancer using interstitial diffuse optical spectroscopyAnthony Kim et al., Sunnybrook Research Institute, Dept ofMedical Biophysics, Toronto, Canada83Optical coherence tomography in dermatologyJakob Thomsen et al., OPL, Risø National Laboratory, Denmark93The intrinsic dimension of multispectral imagesCicero Mota et al., Departamento de Matematica, UniversidadeFederal do Amazonas, Manaus, Brazil
MICCAI 2006 Workshop on Biophotonics Imaging1
MICCAI 2006 Workshop on Biophotonics Imaging2
MICCAI 2006 Workshop on Biophotonics Imaging3
MICCAI 2006 Workshop on Biophotonics Imaging4
MICCAI 2006 Workshop on Biophotonics Imaging5
MICCAI 2006 Workshop on Biophotonics Imaging6
MICCAI 2006 Workshop on Biophotonics Imaging7Quantifying composition of human tissues frommultispectral images using a model of image formationEla Claridge, Dzena Hidovic-Rowe, Felipe Orihuella Espina, Iain StylesSchool of Computer Science, The University of Birmingham, Birmingham B15 2TT, .bham.ac.ukAbstract. This paper describes a novel method for quantitative interpretation ofmultispectral images. By constructing an optical model of a tissue and by modelling the image formation process we predict the spectral composition of lightremitted from the tissue. The parameters characterising the tissue are varied torepresent the entire range of tissue instances. The modelling of image formationis used in place of statistical modelling in which training is performed usingmeasured data with known parameterisation. In this way the method overcomesa common problem in medical imaging where “ground truth” data can be impossible to obtain. The paper shows application of the method to the recoveryof histological parameters characterising the skin, the eye and the colon.1IntroductionColour plays an important role in the clinical diagnosis of many conditions. However,the receptors in the clinician’s eye, as well as the sensors in a standard RGB camera,provide only a limited representation of the visible spectrum. Research in medicalspectroscopy has shown that spectral data can yield information beyond what is possible by observation or photography. One well known example is pulse oximetrywhich uses two spectral measurements to determine blood oxygenation. Althoughvery useful, spectroscopy is inherently one-dimensional and lacks the ability to showspatial variations, which are an important diagnostic factor. Abnormalities often showthemselves as unexpected patterns or distortions of regular features and colours.Multispectral imaging can combine these two important indicators: spectral signatures and spatial variations. Suitable imaging systems exist, but interpretation of multispectral data is an open problem. One common approach is spectral classificationwhose objective is to distinguish between the spectra of normal and abnormal tissues.Based on the classification, false-coloured “diagnostic” images are then presented to aclinician. However, there is a well recognised lack of enthusiasm amongst the clinicians for such “black box” systems. Our earlier research has shown that images whichreveal information on the basis of which diagnosis can be formed with high confidence, are much more acceptable.Light which enters the tissue interacts with its components, and through these interactions (mainly absorption and scatter) the spectral composition of light is alteredin a characteristic way. Thus remitted light bears an imprint of tissue properties. Howcan we derive information related to these properties from the spectra? If the parame-
MICCAI 2006 Workshop on Biophotonics Imaging8ters describing composition of the imaged tissue were known a priori, the spectralinformation could be correlated with these known parameter values using statisticalanalysis (e.g. multivariate techniques). A statistical model constructed through training using this “ground truth” data could be then used to estimate the parameter valuesassociated with the image spectra. However, most tissues are too complex and theparameters of interest, for example the level of blood supply, cannot be easily determined. Moreover, linear methods are not very appropriate in this domain because thelight scatter in tissue makes the relationships between the tissue composition and itsspectra highly non-linear.In recent years we have developed a methodology which overcomes the problemcaused by the lack of the “ground truth” data. Instead of training a model on knownmeasured spectral data, we train it on the spectral data generated by a physics-basedmodel of image formation applied to an optical model of a tissue. We construct a nonlinear multi-dimensional model, parametrised by those tissue components which havebeen found to affect the spectral variability. Fortuitously, we have found that usuallythe same parameters carry diagnostically relevant information. Moreover, the analysisof spectral variability as a function of the parameter changes allows us to define asmall number of spectral bands which contain the bulk of information pertaining tothe parameters. Following image acquisition in these chosen bands, the parameters arerecovered from the multispectral image data through the “model inversion”. The recovered parameter values are represented in the form of parametric maps, one foreach parameter. The maps show both spatial variations and variations in the magnitude of the parameters, and have been found useful in diagnosis.We have applied this method of quantitative parameter recovery to multi-spectralimages of the skin [5], the eye [6] and the colon [2]. This paper draws on that earlierwork, explains the general principles of our method and shows examples of the clinical applications.2Image formation modelTissue model. Although in this paper we concentrate on human tissues, our methodology is applicable to any material which is composed of a number of optically homogenous layers occurring in a known and pre-determined order. The generic requirements are that each layer’s composition and the optical properties of its components must be known across a range of wavelengths, as must be the typical ranges ofthe layer thickness and component concentrations. Optical responses from all thelayers under consideration must be detectable.Typical tissue components of interest are pigments (e.g. haemoglobins in theblood) and structural fibres (e.g. collagen), membranes and cells. Their optical properties are specified by the wavelength dependent factors: the refractive index, the absorption coefficient, the scatter coefficient and the anisotropy factor. These propertiesare treated as the model “constants” and have to be specified a priori. The modelvariables are typically the quantities of the above components which vary from oneinstance of the tissue to another, for example haemoglobin concentration, thickness of
MICCAI 2006 Workshop on Biophotonics Imaging9a collagenous layer or density of collagen fibrils. These variables are the parameterswhich we would like to recover from multispectral images of the tissue.Light interaction model. A spectrum remitted from a tissue is the result of interaction of incident light with the tissue components. Any absorbers (pigments) will attenuate light at specific wavelengths, and the degree to which light is attenuated willdepend in part on the pigment concentration. Any scatterers will selectively alterpaths of the incident photons at different wavelengths and in this way change theshape of the remitted spectra. These interactions can be modelled and for a giventissue composition (as defined above) the corresponding diffuse reflectance spectrumcan be computed by solving a light transport equation, normally using an approximatemethod (e.g. Kubelka-Munk). In this work we use Monte-Carlo method [4], a stochastic approach which simulates the interactions of a large number of photons (of theorder of 104-5) with tissue. It does so by computing the probability that a photon of aspecific wavelength is reflected, absorbed or scattered in a given tissue layer. A reflectance curve is generated by carrying out simulations for all the wavelengths.Imaging system model. The final step in the model of image formation is the processof image acquisition. The tissue is illuminated using a light source with a given spectral profile (I0(λ)). The remitted light is then separated into narrow-band spectralcomponents, normally using filters with known transmission properties (Fn(λ)). Thefiltered light is recorded by a camera whose sensors (e.g. CCD) have a particularquantum efficiency characteristics (Q(λ)). The imaging model can be expressed as{ I0(λ) Fn(λ) Q(λ) dλ } n 1, ,N3(1)Tissue reflectance model: the ground truthGiven the optical model of a tissue and a method for modelling of the light interactionwe can predict the spectra remitted from the real tissue. Further on, given a model ofthe imaging system, including spectral filter definitions, we can predict values in themultispectral image data. This forward model of image formation provides us with themeans of relating tissue parameter magnitudes to image values. In section 4 we shalldescribe the methods for carrying out the inverse process, that is obtaining the parameter magnitudes from image values. In this section we shall outline the algorithmfor computing the tissue reflectance model and discuss the essential details related toits implementation.Building the model. A generic algorithm for constructing the tissue reflectancemodel is shown below. In the essence, for a given tissue it computes the range of allpossible reflectance spectra, and then their multispectral representations. In order toimplement this algorithm we have to choose which tissue components (parameters) torepresent in the model; and for each parameter we have to define its range and sampling (discretisation). In the last step we have to define the filters which implement
MICCAI 2006 Workshop on Biophotonics Imaging10the transition from spectra to image values through the application of the imagingsystem model (Eq. 1).givenincident light I0the number and the order of distinct optical layersthe optically active components within each layerabsorption and scatter coefficients for all the componentsfor all values of parameter p1for all values of parameter p2. . .for all values of parameter pKcompute Reflectance Spectrum r1,.rM Light Interaction Model(I0, p1, , pK)compute multispectral image vector y1,.,yN convolve( r1,.,rM , Imaging System Model)Tissue related parameters. Each tissue has specific and unique composition in termsof the optical layers, their arrangement and quantities. This information is normallyobtained from histology textbooks. The composition of superficial tissues is limited toa relatively small number of absorbing pigments and scatter-originating connectivetissues. Their optical properties can be found from research publications (e.g. see [8]).Some quantities stay constant; some quantities vary, but have little effect on thespectra. Prior to making a commitment to a particular parameterisation it is useful tocarry out preliminary modelling for all the known parameters in order to determinetheir role as a variable or as a constant: the more of the variable parameters the morecomplex the model and the subsequent parameter recovery. The choice of granularityfor parameter discretisation is not critical as normally the spectra change smoothly asa function of the parameter changes. We have found empirically that having around5 1 discrete values within a given range gives satisfactory results.Spectrum related parameters. By acquiring multi-spectral images we represent acontinuous spectrum by a set of discrete values. As the image acquisition is implemented through bandpass filtering, it is necessary to define the number and the spectral locations of the filters, and for each filter its bandwidth and transmittance. A simple solution is to choose uniform sampling throughout the entire visible range. However, this may lead to increase in computational effort. We have implemented amethod for optimal filter selection which defines a small number of filters, M (for Nvariable parameters M N or M N 1) with the objective to minimise the error withwhich the parameters can be recovered from image values. The method also ensuresthat with the chosen filters there is a one-to-one, unique, correspondence between allthe parameter vectors and all the image vectors. The details are given in [1,5].Formalised description of the model. The tissue reflectance model is constructed forN variable parameters which have been found to affect the shape of the remitted spectra. Each specific instance of tissue can thus be defined by an N-dimensional parame-
MICCAI 2006 Workshop on Biophotonics Imaging11ter vector p p1,.,pn . The range of each parameter is discretised to kn levels, givingin total K k1 x k2 x . x kn parameter vectors which, together, define all the possibleinstances of the given tissue (within given discretisation). Through modelling of thelight interaction with tissue and of the image acquisition process we associate witheach parameter a spectrum and an M-dimensional image vector i i1,.,iM . Theparameter vectors together with the image vectors form the tissue reflectance model:i f(p). This model is used in the next step to derive parameters from multispectralimages of tissue.4Image interpretationThe model captures the relationship between the tissue parameters and the corresponding image vectors. In this sense it is equivalent to a statistical model obtained bytraining using images with known ground truth. We now can proceed with the mainobjective of this work, which is to find the parameters given multispectral imagevalues. We shall refer to this process of parameter recovery as the “model inversion”.In general, this is a very difficult task, especially when the model is highly non-linear.We have explored three different inversion methods, as described below.Direct spectral matching. The simplest method of inversion is to find a model spectrum which best matches the given measured spectrum. The parameters used to generated the model spectrum are then assumed to correspond to the parameters whichrepresent the measured spectrum. The method of finding the best match was implemented as a distance minimisation problem. In addition to the parameter values, thismethod can return additional useful quantities, for example the scale factor, which is afunction of the distance between the camera sensor and the imaged tissue and whichhelps to appreciate the shape of the colon surface.Model inversion via multidimensional interpolation. As the forward model is constructed using a numerical solution to the radiative transport equation, it is not possible on its basis to formulate an analytical inverse function which would return theparameters given the spectra. We can exploit the fact that, formally, the model is avector-valued function on a vector domain (i f(p), see Sec. 3). If a given measurement vector î corresponds exactly to a model image vector i, the parameter vector pcan be obtained via a simple look-up. In all other cases we need to find an approximate solution. Given that the mapping between image vectors and parameter vectorsis unique, and the density of the data points is sufficiently high, we can employ theinverse function theorem and compute parameter vector p for an arbitrary measurement vector î using a truncated Taylor expansion.Neural network. Using the discretised model we have trained a two-layer, radialbasis neural network. The image vectors generated by the model were used as inputs,and the corresponding model parameter vectors were provided as the target outputs
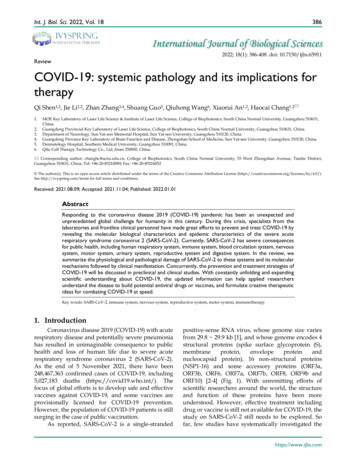
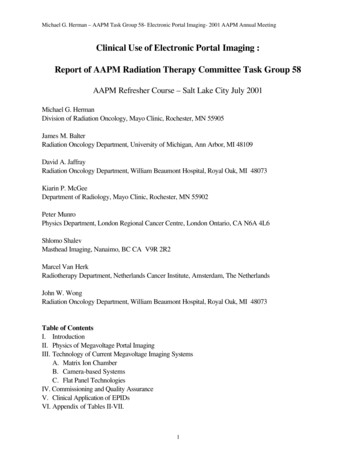
MICCAI 2006 Workshop on Biophotonics Imaging12[7]. After training, the input to the network were the measurement vectors obtainedfrom the image, and the output were the estimated parameter vectors.5Experimental resultsThe parameter recovery methods described above were applied to a range of multispectral medical images [2,5,6]. In this section we show examples of applications forthree tissues: the skin, the eye and the colon.Before showing the results we briefly outline a typical image acquisition process.Multispectral imaging is implemented using a liquid crystal tuneable filter VarSpec(C.R.I., USA) which allows the selection of narrow Gaussian shaped filters of halfwidth 5-7nm in the range from 400 to 700nm. The filter is mounted on front of a highsensitivity monochrome camera Retiga Exi 1394 (QImaging, Canada). The individualspectral images forming the multi-spectral data set are acquired serially. The acquisition time is chosen to ensure that the images are correctly exposed.Prior to quantitative interpretation the acquired image data is pre-processed to remove the effects of the image acquisition system. Individual images are normalised toan exposure time of one second, a gain of one and offset of zero. Spectrum at eachpixel is then deconvolved with the imaging model spectrum to give a “pure” tissuereflectance spectrum which can then be compared to the model spectrum.Skin. The skin imaging work was carried out with the purpose of early detection ofskin cancers, and in particular malignant melanoma. The skin model comprises threelayers, and variable parameters include the haemoglobin concentration, melanin concentration in the epidermal and the dermal layers, and the thickness of the dermis[5,6]. Only small areas of the skin are imaged and for this reason the imaged skin areacan be assumed to be flat and thus to get uniform illumination. This removes the needto carry out spatial normalisation of the illuminant, resulting in a fairly simple modelwhere spectra are represented by four optimally selected spectral bands [5]. The fourparameters are derived from the model using linear interpolation. Figure 1 shows anexample of quantitative parametric maps of a skin cancer. The parameter recoverymethod has been used clinically for several years and it has proved to be a powerfultool for cancer diagnosis and other applications [3].Eye. We have developed a four-layer model of the eye structure, parametrised by fiveparameters: the concentration of the haemoglobins and the melanins (separately) indifferent layers, and the concentration of the macular pigment. The back of the eye(ocular fundus) is imaged through an ophthalmic microscope (called a fundus camera). The passage of light through the eye, including the pupil, and the curvature ofthe fundus, make it impossible to determine the spatial distribution of the incidentlight. For this reason the model uses the normalised spectral representation (imagequotients [5,7]). Each spectrum is represented by six narrow spectral bands, one ofwhich acts as a normalising factor. As the eye cannot stay still during image acquisition, the images in the individual spectral bands have to be registered prior to theparameter extraction. Inconsistent illumination caused by the movement sometimes
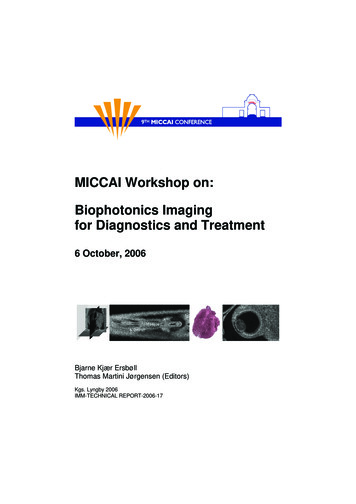
MICCAI 2006 Workshop on Biophotonics Imaging13causes problems with the parameter recovery, and is the subject of work in progress.The two parameters of clinical interest, the levels of the retinal blood and the levels ofthe macular pigment, are derived from the image data using neural networks. Figure 2shows the examples of the parametric maps of retinal blood and Macular Pigment.Colon. The colon has three optically distinct layers. The layers are parameterised byhaemoglobin concentration and its saturation, and by three parameters characterisingthe connective tissue: the size of collagen fibres, their density and the layer thickness.As the colon surface is uneven, an additional parameter estimates the distance between the point on the surface and the CCD sensor and acts as a scaling factor on themagnitude of each spectrum. The images are obtained from ex-vivo colon samplesand 33 narrow band spectra are recorded. The parameters are recovered using thedirect spectral matching. Figure 3 shows the parametric maps of the colon in whichclear differences between the normal and the cancerous tissue can be seen.6Discussion and conclusionsThis paper has described a novel method of quantitative interpretation of multispectralimages and showed its application to the recovery of histological parameters fromimages of the skin, the eye and the colon. The novelty of the method lies in the way itconstructs and encodes the relationship between the parameters of interest and theimage data. In traditional statistical methods such relationships are constructed experimentally. This requires the availability of the “ground truth”, which most often isa physical entity (object) for which parameter values are known. The object properties, such as for example its spectral reflectance, are measured and related to theknown parameters through a statistical model. In our work, which involves imagingof living human tissues, it is virtually impossible to obtain the ground truth throughmeasurements. In their place we have constructed a virtual experimental set-up whichis based on a detailed model of image formation. The optical model of tissue providesthe required ground truth for the subsequent inversion process through which thequantitative tissue parameters can be recovered.One disadvantage of our method is that it requires a great deal of a priori information, including detailed parametrisation of tissue properties, as well as the development of high-fidelity light propagation models. However, if quantitative results arerequired, the effort in researching parameters and refining models is worthwhile.As the method is based on physics, it is genuinely quantitative. The images shownin this paper provide visual representation of the recovered data, but behind the pixelsthere are true physical quantities for concentration, density and thickness of the tissuecomponents. We believe that such results provide objective information about tissues,even in the presence of inevitable errors, and are more clinically valuable than, forexample, classification based on spectral data.
MICCAI 2006 Workshop on Biophotonics Imaging14(d)(a)(b)(c)Fig. 1. (a) Colour image of a skin cancer melanoma; parametric maps showing levels of(bright more) (b) dermal melanin, (c) collagen thickness and (d) dermal blood(a)(b)(c)(d)Fig. 2. (a) and (c): RGB images and their parametric maps (bright high level) showing (b)Macular Pigment; arrow points to fovea where elevated levels of MP can be seen. (d) retinalblood; retinal vessels can be clearly seen; arrow points to fovea with decreased levels of blood(c)(a)(d)(b)Fig. 3. (a) RGB image of the colon with cancerous area outlined; parametric maps showinglevels of (dark high level) (b) haemoglobin in mucosa, (c) thickness of mucosa and (d) thescaling factor (proportional to the elevation)References1. Claridge E, Preece SJ (2003) An inverse method for the recovery of tissue parameters fromcolour images. Information Processing in Medical Imaging (IPMI), LNCS 2732, 306-317.2. Hidovic D, Claridge E (2005) Model based recovery of histological parameters from multispectral images of the colon. Medical Imaging 2005. Proc. SPIE Vol. 5745, 127-137.3. Moncrieff M, Cotton S, Claridge E, Hall P (2002) Spectrophotometric intracutaneous analysis - a new technique for imaging pigmented skin lesions. BJD 146(3), 448-457.4. Prahl SA et al. (1989). A Monte Carlo model of light propagation in tissue. SPIE InsituteSeries IS 5, 102–111.5. Preece SJ, Claridge E (2004) Spectral filter optimisation for the recovery of parameterswhich describe human skin. IEEE PAMI, 26(7), 913-922.6. Styles IB et al. (2005) Quantitative interpretation of multispectral fundus images. MedicalImaging 2005: Proc. SPIE Vol. 5746, 267-278.7. Styles IB et al. (in print) Quantitative analysis of multispectral fundus images. MedicalImage Analysis.8. Tissue Optics (1994) SPIE Milestone Series Vol. MS 102, Tuchin VV (Ed.).
MICCAI 2006 Workshop on Biophotonics Imaging15Multi-spectral recordings and analysis ofpsoriasis lesionsLine H. Clemmensen and Bjarne K. ErsbøllInformatics and Mathematical Modelling, Technical University of Denmark, DK-2800Lyngby, Denmark. lhc@imm.dtu.dk and be@imm.dtu.dkAbstract. An objective method to evaluate the severeness of psoriasislesions is proposed. In order to obtain objectivity multi-spectral imagingis used. The multi-spectral images give rise to a large p, small n problemwhich is solved by use of elastic net model selection. The method ispromising for further studies of larger data sets including more patientsthan the four regarded here.1IntroductionTraditionally, evaluation of psoriasis lesions are performed subjectively by trainedstaff using the PASI (psoriasis area and severity index, [1]). This evaluation formis limited with regards to large-scale studies. In 2001 SAPASI (self-administratedPASI) was proposed where the evaluation is performed by the patients themselves [2]. This study concluded that objective methods for clinical evaluation ofpsoriasis is needed.The ratings of the four patients considered here have been performed according to the severity index of the PASI. It’s scale is from 0 (none) to 4 (maximum).The severity of the lesions are measured by the degree of erythema and the degree of infiltration of the lesions. Erythema is the redness of the skin caused bydilatation and congestion of the capillaries. This is often a sign of inflammationor infection. Infiltration refers to the thickness of the psoriasis lesion1 .To obtain an objective method of evaluation multi-spectral imaging is considered. Each multi-spectral image consists of nine spectral bands. Hence, a largeamount of data is present for each of the few observations. Such constitutionsare referred to as large p, small n problems. To analyze the problem at handwe use least angle regression - elastic net which introduces a sparsity into thesolution and in this way selects a subset of features [3].2MethodThis study considers four patients each with two lesions imaged. Two to fiveimages have been acquired of each lesion area. This amounts to a total of 26images. The lesions have been valuated in the range from 0 to 2, i.e. the variance1Psoriatic skin is thicker than healthy skin, [1].
MICCAI 2006 Workshop on Biophotonics Imaging16regarding the severity index is small within the four patients. The segmentationof the ROIs (regions of interest) of the inflammations and the scales of the lesionsis illustrated in Figure 1.10000Frequency800060
Light interaction model. A spectrum remitted from a tissue is the result of interac-tion of incident light with the tissue components. Any absorbers (pigments) will at-tenuate light at specific wavelengths, and the degree to which light is attenuated will depend in part on the pig