Transcription
Michael G. Herman – AAPM Task Group 58- Electronic Portal Imaging- 2001 AAPM Annual MeetingClinical Use of Electronic Portal Imaging :Report of AAPM Radiation Therapy Committee Task Group 58AAPM Refresher Course – Salt Lake City July 2001Michael G. HermanDivision of Radiation Oncology, Mayo Clinic, Rochester, MN 55905James M. BalterRadiation Oncology Department, University of Michigan, Ann Arbor, MI 48109David A. JaffrayRadiation Oncology Department, William Beaumont Hospital, Royal Oak, MI 48073Kiarin P. McGeeDepartment of Radiology, Mayo Clinic, Rochester, MN 55902Peter MunroPhysics Department, London Regional Cancer Centre, London Ontario, CA N6A 4L6Shlomo ShalevMasthead Imaging, Nanaimo, BC CA V9R 2R2Marcel Van HerkRadiotherapy Department, Netherlands Cancer Institute, Amsterdam, The NetherlandsJohn W. WongRadiation Oncology Department, William Beaumont Hospital, Royal Oak, MI 48073Table of ContentsI. IntroductionII. Physics of Megavoltage Portal ImagingIII. Technology of Current Megavoltage Imaging SystemsA. Matrix Ion ChamberB. Camera-based SystemsC. Flat Panel TechnologiesIV. Commissioning and Quality AssuranceV. Clinical Application of EPIDsVI. Appendix of Tables II-VII.1
Michael G. Herman – AAPM Task Group 58- Electronic Portal Imaging- 2001 AAPM Annual MeetingTG58 is published in its entirety in Medical Physics Volume 28(5) pages 712-737. Thispresentation will review some critical information from TG58 and update the audience withcurrent technologies and applications. This especially includes an update of references in eachsection of the manuscript.I. INTRODUCTIONA critical requirement in radiation therapy is accurate day-to-day treatment setup. Early studiesbased on port films indicated the benefits of portal verification1-4. Numerous subsequent studieshave characterized the magnitude and nature of setup errors for a variety of clinical conditions.Random and systematic errors of up to 6mm (σσ) have been reported in previous studies2,3,5-27.An effective means to reduce setup error would be to increase the frequency of treatmentverification with portal imaging28. Such action using port film is time consuming and laborintensive and can reduce throughput in a busy radiation therapy department. In addition,quantitative interpretation of geometric discrepancies is difficult and tedious to perform withnon-digital imaging systems29. The need for an improved portal imaging system to enhanceverification of conformal radiation therapy spurred the development of on-line electronic portalimaging devices (EPIDs).The modern era of electronic portal imaging began in the early 1980s with demonstrationby the late Norman Bailey of the use of a fluoroscopic system to acquire megavoltagetransmission images30. The introduction of the scanning liquid ionization chamber system in1990 was quickly followed by the introduction of camera-based fluoroscopic EPIDs from othermanufacturers. At present, EPIDs are commercially available in the US from at least 5 vendors.Initially, these devices were embraced with great expectation by the radiation therapycommunity. At the time when Task Group 58 (TG58) was formed in 1995, about 250 systemshad been sold in the US. In years since, informal surveys indicate that the initial promise has notled to wide spread clinical application of EPIDs. An informal survey of 69 institutions withEPIDs, conducted by members of TG58, indicated that 25% do not use the devices at all. Themost common mode of operation is for the radiotherapists to perform visual inspection of thepatient setup as a first-line of action to reduce large setup errors or mistakes. Only 50% of thesurveyed institutions have secondary review stations and only half of these appear to havecomprehensive analysis tools. About 40% of the institutions with EPIDs have developed acomprehensive quality assurance (QA) program, but fewer than half of these perform theprogram regularly. Thirty-five percent of respondents do not have a QA program at all. Themajority of users surveyed consider image quality from current EPIDs inferior to that of portfilms and thus the EPID is not used, contrary to statements of superior EPID resolutionrepeatedly made in the literature. On the other hand, EPIDs are used because many users believethat these devices save time and provide quantitative feedback.It is clear that EPID technology is under-utilized in the US. Furthermore, EPIDs are notused to produce their intended clinical benefit. Despite the impressive clinical results ofEuropean studies31,32, it remains clear that apparent hurdles limit EPID utilization in the US.TG58 was formed to help AAPM members understand and implement EPID technology. It is thegoal of this report to provide information to enhance and encourage effective use of thesepowerful devices.The specific charges of Task Group 58 are:2
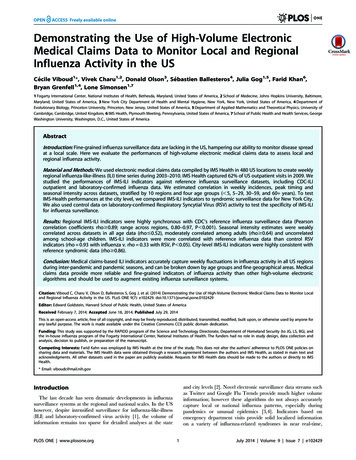
Michael G. Herman – AAPM Task Group 58- Electronic Portal Imaging- 2001 AAPM Annual Meeting1. To provide comprehensive technical information about the operation, limitations andsystem characteristics of the various commercially available EPIDs for the purpose ofimplementation, use and developing quality assurance programs.2. To summarize existing experience on the effective implementation and use of theEPID for imaging in various clinical treatment sites and conditions from simple filmreplacement to quantitative statistical methods.3. To describe tools currently available for on-line and off-line evaluations of theimages.4. To specify the requirements and discuss issues related to quality assurance for EPIDsystems, including the archive and management of the large amount of imaging data.II. THE PHYSICS OF PORTAL IMAGINGTreatment verification usually involves comparison of a portal image acquired during atreatment fraction with a reference image that is generated prior to the initiation of thetreatment course. Sometimes, the first approved portal image is also used as the referenceimage. While the portal image is formed by the megavoltage beam used to treat the patient, thereference image can be kilovoltage (e.g. simulation film), megavoltage or a digitallyreconstructed radiograph (DRR).It is generally accepted that the quality of images acquired using megavoltage x-rays isinherently poorer than that acquired with kilovoltage x-rays. Besides the well known decrease insubject contrast (e.g., the differential attenuation between bone or air and soft tissues) as theenergy of an x-ray beam increases, many other factors contribute to the poor quality of portalimages. These include the performance of the image receptor, x-ray scatter due to patientthickness, the size of the x-ray source, noise in thehuman eye-brain system, and (indirectly) the positionof the image receptor. The purpose of this section is toexplain how these factors influence the portal imagequality and to understand the fundamental limitationsof imaging with megavoltage x-ray beams. This in turnshould help readers understand what they can andcannot expect from the imaging performance ofEPIDs.φp1φp2A number of key quantities give an objectiveφp1 measure of image quality. Figure 1 illustrates theimage formation process and its relation to some keyφp2 indicators of image quality. This chapter addressescontrast, noise, spatial resolution, detective quantumφsefficiency (DQE) of EPIDs and X-ray scatter.Fig.1 Schematic representation of theimaging process. Fluences φ defined in text.A. ContrastContrast, C, describes how much an object stands out from its surroundings and isdefined as333
Michael G. Herman – AAPM Task Group 58- Electronic Portal Imaging- 2001 AAPM Annual Meetingφp2 - φp1signalC mean signal(φp2 φp1 2 φs)/2(1)where φp1, φp2, and φs are the primary and scatter photon fluences reaching the image receptor(Fig. 1). Motz and Danos have shown that this expression can be re-written as332(1 e )(2)C 1 e 2 SF1 - SFwhere: is the difference in attenuation between the object and the background (i.e. Lx µbone - µwater ), µbone and µwater are the x-ray attenuation coefficients for bone and water,respectively, Lx is the thickness of the anatomic structure, and SF is the scatter fraction {SF φs/( φs φp)}. Equation 1 shows that the contrast is increased by increasing the difference inattenuation along the x-ray path and is decreased by the addition of a scatter fluence.Subject contrast of 1 cm thick bone or air objects embedded within 20 cm of water as afunction of x-ray energy can be calculated using Equation 2. For simplicity, the contrast has beencalculated assuming that no x-ray scatter occurs (i.e., SF 0). For comparison purposes, 50 kevapproximates the mean energy of the x-ray energy spectra used to generate a simulator image(100 kVp, diagnostic energy) and 2 MeV that of the 6 MV beam to generate a portal image.Examining the subject contrast at these two x-ray energies shows the subject contrast decreasesfrom 0.5 to 0.037 (a factor of 13) for the bone and from 0.2 to 0.05 for the air pocket (only afactor of 4). This explains the enhanced visibility of the air passages relative to bony anatomyseen in the therapy image as compared to the simulator image.Contrast is the result of differences in x-ray attenuation within the patient. At lowenergies, the photoelectric process dominates. Since the photoelectric cross-section isproportional to the atomic number raised to the third power (Z3), the higher atomic number ofbone results in a larger attenuation coefficient compared to that of water. However, thephotoelectric cross-section is also inversely proportional to the energy cubed (1/E3). Comptonscattering becomes the dominant interaction process above 20 keV for soft tissues and above 50keV for bone (assuming that the atomic number of bone is 13). The Compton scattering crosssection is dependent on the electron density of a material, which, except for hydrogen, varies onlyslightly with atomic number. The electron density of water ( ρe(water) 3.34x10²³electrons/cm3) is comparable to that of bone (ρe(bone) 5.81x10²³ electrons/cm3). Therefore,the difference in attenuation, and hence the contrast, reduces significantly at megavoltageenergies.B. Signal to Noise RatioQuantum NoiseThe most important concept to understand is that image quality (or “detectability” of bonyanatomy) is ultimately determined not by the subject contrast of the object being imaged but bythe signal-to-noise ratio (SNR) of the image. A number of sources of noise contribute to the4
Michael G. Herman – AAPM Task Group 58- Electronic Portal Imaging- 2001 AAPM Annual MeetingSNR. A limiting source of noise is due to x-ray quantum statistics. This is best explained againwith Figure 1, which shows the process of x-ray image formation. The difference in attenuationbetween an object and its surroundings (i.e., subject contrast) results in different number of x-rayquanta reaching and interacting in an image receptor. The subject contrast is determined by theenergy of the x-ray beam, the radiological properties of the object being imaged, and the amountof x-ray scatter reaching the image receptor. However, since image formation is a statisticalprocess involving the detection of discrete x-ray quanta, there will be a statistical uncertainty(known as x-ray quantum mottle) in the number of x-ray quanta that interact in the imagereceptor. The detectability of the object therefore depends not only on how large the difference inattenuation is between the object and its surroundings, but also on how large this signaldifference is compared to the uncertainty in the signal, i.e. SNR.The number of x-ray quanta detected in some time interval follows Poisson countingstatistics. For a Poisson process, the variance in the number of detected x-ray quanta is equal tothe mean number of detected photons. Therefore, if the mean fluences are known, a signal-tonoise ratio can be calculated. The signal-to-noise ratio of the bone signal shown in Figure 1 iscalculated asφp2 - φp1image signalSNR (φp2 φp1 2 φs)/2noise(3)Rewriting in terms of the geometry shown in Figure 1, we obtain2(1 e )SNR A φi T η(4)1 e 2 SF1 - SFwhere: A is the area of the detector element, φi is the incident fluence, T is the patienttransmission, and η is the x-ray detector efficiency. Equation 4 shows that the SNR, like thecontrast, decreases as the difference in attenuation between the object and the background ( )decreases. However, unlike the contrast, the SNR is proportional to the number of x-raysdetected (A. φi.T. η the area x fluence x transmission x collection efficiency number ofdetected x-rays). In addition, scatter reduces the SNR by adding noise without contributing to thesignal.The SNR versus x-ray energy for an image of a 1 cm thick bone in 20cm of tissue can becalculated using Equation 4. A typical diagnostic imaging procedure delivers a dose of 0.05 cGy(50 mR) to the patient34. For the same patient dose at megavoltage energies, the SNR would be 100 times smaller. While the diagnostic SNR would satisfy Rose's criteria for visibility(SNR 5)33, the megavoltage beam would not (Table I). However for the same photon fluence, amegavoltage beam delivers more dose. Doses more common in megavoltage imaging are alsoshown in Table I.Table I. Calculated SNR and patient doses at diagnostic and therapeutic x-ray rapeuticTherapeutic(50 keV)(2 MeV)(2 MeV)(2 MeV)(2 MeV)5
Michael G. Herman – AAPM Task Group 58- Electronic Portal Imaging- 2001 AAPM Annual MeetingPatient Dose0.05 cGy0.05 cGy1 cGy10 cGy55 cGySNR71 14.81535Detective QuantumEfficiencyThis simple model demonstrates that subject contrast decreases with increasing x-rayenergy. Not only does the contrast of objects decrease, the rate of decrease depends on theeffective atomic number of the object. This results in the contrast of air passages exceeding thatof bony anatomy when x-ray energy exceeds 100 keV. Furthermore, the SNR of the bone signaldecr
Radiotherapy Department, Netherlands Cancer Institute, Amsterdam, The Netherlands John W. Wong Radiation Oncology Department, William Beaumont Hospital, Royal Oak, MI 48073 Table of Contents I. Introduction II. Physics of Megavoltage Portal Imaging III. Technology of Current Megavoltage Imaging Systems A. Matrix Ion Chamber B. Camera-based Systems